Digital Microloans Dashboard in Power BI is a ready-to-use reporting template for microfinance institutions, digital lending startups, NGO lending programs, branch managers, credit teams, loan officers, and portfolio analysts who need fast visibility into repayment, outstanding balance, processing fees, risk category, loan product, branch, borrower type, loan officer, channel, purpose, and demographics. Instead of rebuilding visuals every reporting cycle, you can open the .pbix file, replace or connect your approved data source, refresh the report, and review 5 focused Power BI pages with KPI cards, charts, and slicers.
This template is designed for teams that already manage loan records in Excel exports, CSV files, database extracts, or lending system downloads and want a practical Power BI reporting layer. You can also review Microsoft’s guidance on creating reports in Power BI if you want to understand the report-building environment behind the template.
Download the Digital Microloans Dashboard in Power BI from NextGenTemplates.
Key Features of Digital Microloans Dashboard in Power BI
5 focused report pages. The Power BI file includes Overview Page, Portfolio Analysis, Risk Analysis, Branch Performance, and Demographics so users can move from executive summary to detailed portfolio views.
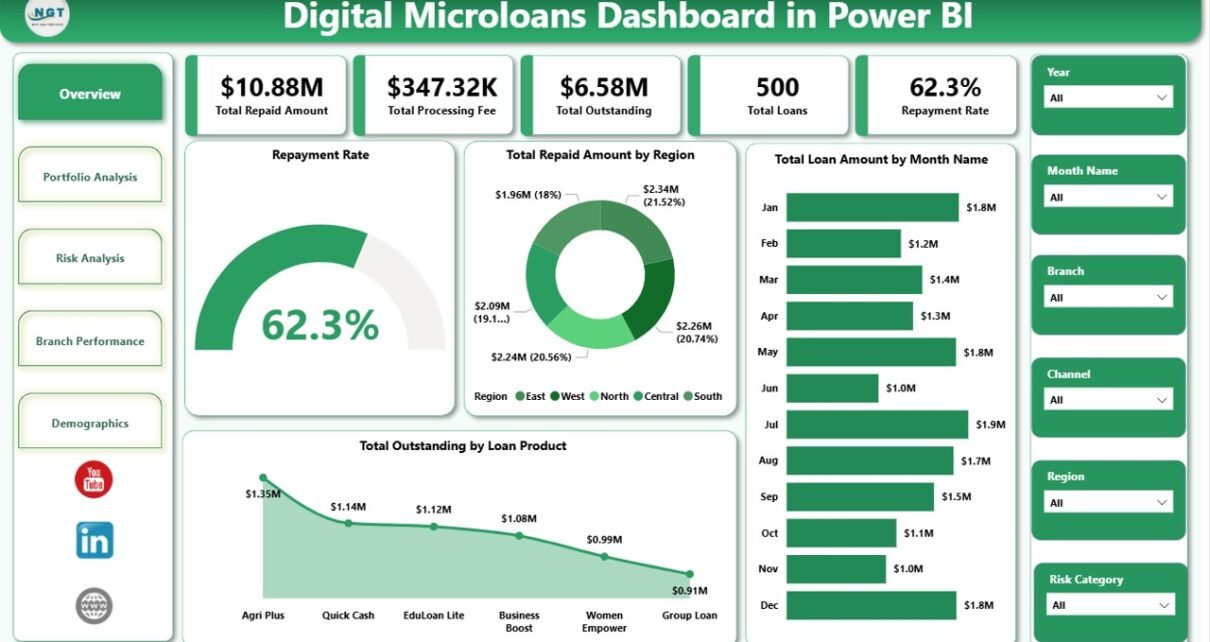
High-level KPI cards. The Overview Page shows Total Repaid Amount, Total Processing Fee, Total Outstanding, Total Loans, and Repayment Rate. These cards help managers check collection progress, fee income, loan count, and open exposure quickly.
Interactive slicers. The report includes slicers that allow users to filter the visuals quickly. This is useful for branch reviews, monthly meetings, regional analysis, officer performance checks, and borrower segment reporting.
Portfolio and risk visuals. The report includes charts for repayment rate, repaid amount by region, loan amount by month, outstanding by product, loan amount by channel, outstanding by borrower type, loan purpose, risk category, default rate, branch, gender, loan officer, and average loan size.
Editable Power BI format. Because this is a .pbix file, you can customize measures, visuals, labels, colors, pages, and data source connections in Power BI Desktop.
Dashboard Pages Explanation
1 – Overview Page
The Overview Page is the executive summary page of the report. It combines KPI cards, slicers, and core visuals so the team can understand portfolio health without moving through every detail page first.
Total Repaid Amount shows the total value collected from borrowers in the selected filters. It helps teams monitor collection progress and compare repayment performance over time.
Total Processing Fee shows the fee income linked to microloan disbursements. Finance teams can use it to understand fee revenue and compare fee patterns with lending volume.
Total Outstanding shows the remaining unpaid exposure. This card is important for risk monitoring, collection planning, and management reporting.
Total Loans shows the loan count in the selected view. It helps teams understand portfolio scale and workload across branches, officers, channels, or borrower groups.
Repayment Rate shows repayment effectiveness as a percentage. A declining repayment rate can signal collection pressure, borrower stress, or a risk policy issue.
Repayment Rate chart gives a quick visual view of repayment performance. It helps managers see whether the selected portfolio segment is healthy or needs review.
Total Repaid Amount by Region compares collections across regions. It helps identify strong repayment areas and regions that may need field follow-up.
Total Loan Amount by Month Name tracks disbursement value by month. It is useful for spotting growth, seasonality, or unusual changes in lending activity.
Total Outstanding by Loan Product shows open balance by product type. Teams can use it to review product-level exposure and decide where to focus collection or underwriting review.
2 – Portfolio Analysis
The Portfolio Analysis page explains how lending is distributed across channels, borrower types, and loan purposes. It is useful for product managers, portfolio teams, and digital lending operations leaders.
Total Loan Amount by Channel compares lending value by origination channel. This helps teams see whether branch, app, agent, partner, or online channels are driving most disbursement.
Total Outstanding by Borrower Type shows unpaid exposure by customer group. It helps identify which borrower segments carry larger balances and may need deeper monitoring.
Total Loan Amount by Loan Purpose shows why borrowers are taking loans and which use cases drive the highest amount. It can support product planning, borrower education, and portfolio strategy.

3 – Risk Analysis
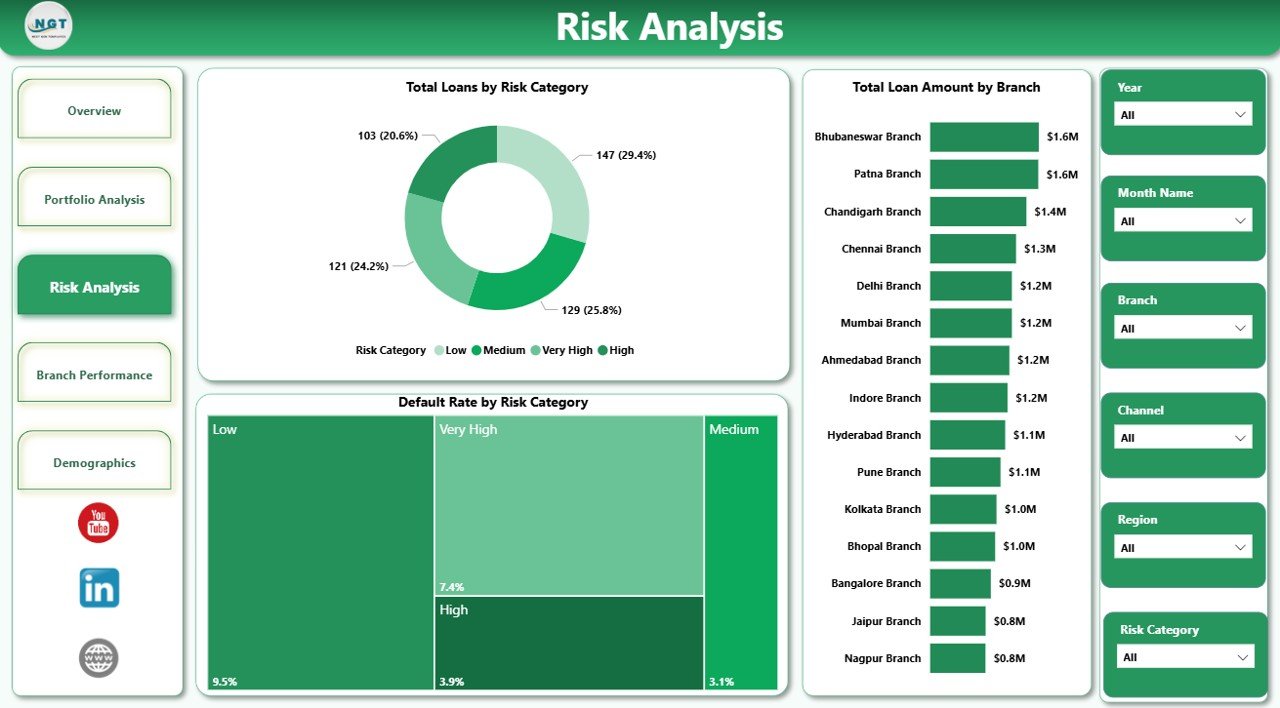
The Risk Analysis page focuses on portfolio quality, risk category movement, default behavior, and branch-level exposure. It gives credit and risk teams a fast way to see where attention is needed.
Total Loans by Risk Category counts loans by assigned risk tier. This helps teams see whether the portfolio mix is becoming more conservative or more risk-heavy.
Default Rate by Risk Category compares default behavior across risk groups. If a supposedly low-risk group shows high default, the scoring model or underwriting policy may need review.
Total Loan Amount by Branch compares disbursement amount across branches. Managers can use this view to connect branch growth with repayment and risk quality.
4 – Branch Performance
The Branch Performance page is built for operational review. It helps branch leaders compare lending volume, borrower mix, and loan officer repayment performance.
Total Loan Amount by Gender shows how loan value is distributed by borrower gender. This can support inclusion reporting and borrower segment review.
Repayment Rate by Loan Officer compares repayment performance across officers. It helps managers identify coaching needs, workload issues, and strong performers.
Total Loan Amount by Loan Officer compares officer-managed lending volume. Used with repayment rate, it gives a balanced view of volume and quality.

5 – Demographics
The Demographics page helps teams understand borrower mix, loan purpose patterns, and average loan size. It is useful for customer segment reporting and inclusion-focused analysis.
Repayment Rate by Gender compares repayment performance by borrower gender. It can help teams identify whether specific borrower groups need support, education, or product review.
Total Loans by Loan Purpose shows the count of loans by use case. It helps separate high-volume borrower needs from high-value loan purposes.
Avg Loan Size by Borrower Type compares average ticket size across borrower groups. This supports review of borrower limits, product fit, and portfolio concentration.

Digital Microloans Dashboard in Power BI vs. Tableau vs. Paid Lending SaaS – Feature Comparison
| Feature | Digital Microloans Dashboard in Power BI | Tableau alternative | Paid lending SaaS |
|---|---|---|---|
| Cost | $17.99 one-time | License plus report build time | Monthly or annual subscription |
| Platform | Power BI Desktop | Tableau Desktop or Cloud | Vendor-hosted system |
| Setup time | Open .pbix and replace or connect data | Build model and visuals | Implementation and configuration |
| Real-time team collaboration | Available if published to Power BI Service | Available with Tableau Cloud | Usually included by vendor |
| Mobile access | Available through Power BI Service and app | Available through Tableau mobile options | Depends on vendor plan |
| Customizable fields | Editable report and model | Editable with Tableau skills | Limited by vendor reporting options |
| Share with link | Possible after publishing with correct permissions | Possible with Tableau Cloud | Usually role-based inside platform |
| Year-1 cost at 5 users | $17.99 plus any Microsoft licensing | Often much higher | Often hundreds or thousands |
| Microloan page structure | Built in | Must be designed | Depends on vendor reports |
Who Should Use This Template
This template is useful for microfinance institutions, digital lending startups, NGO finance programs, branch managers, loan officers, portfolio managers, credit analysts, finance analysts, and consultants who need a Power BI dashboard for loan portfolio reporting.
It is not intended to replace a lending system, repayment collection app, borrower communication tool, accounting system, or credit decision engine. It is a reporting template for analysis and management review.
Real-World Use Cases
Asha manages a regional microfinance portfolio. She uses the Overview and Risk Analysis pages before monthly review meetings to explain repayment rate, outstanding balance, default behavior, and risk category mix.
Daniel works at a digital lending startup. He reviews loan amount by channel and loan purpose to understand which acquisition sources and borrower needs are driving the portfolio.
Meera supervises branch loan officers. She compares repayment rate by loan officer and total loan amount by officer before coaching conversations so performance discussions are based on both quality and volume.
Advantages of Digital Microloans Dashboard in Power BI
The main advantage is speed. The report pages, cards, charts, and slicers are already arranged around common microloan management questions: how much was repaid, how much is outstanding, where are defaults, which products carry exposure, which branches are growing, and which borrower segments matter most.
The second advantage is flexibility. Since the file is built in Power BI, users can modify visuals, measures, columns, themes, relationships, and data sources according to their reporting process.
Opportunities for Improvement
This dashboard is not a live lending platform. It does not send borrower reminders, collect payments, originate loans, or enforce loan approval workflows. Larger institutions may want automated data pipelines or direct database connections. Smaller and mid-sized teams can still use this as a practical reporting layer when they have structured exports or approved source data.
Best Practices
Keep a clean backup copy before modifying the model, validate date and amount fields before refresh, use consistent naming for branches, officers, products, channels, risk categories, borrower types, and loan purposes, and review totals after connecting your own data. When publishing to Power BI Service, confirm access permissions and borrower-data privacy rules.
Explore Relevant Templates
You may also like Digital Microloans Dashboard in Excel, Microfinance Institutions Dashboard in Excel, Credit Union Dashboard in Power BI, and Buy-Now-Pay-Later Platforms Dashboard in Excel. Browse more Power BI templates and Power BI dashboard templates.
Frequently Asked Questions
What KPIs are included in the Digital Microloans Dashboard in Power BI?
The Overview Page includes Total Repaid Amount, Total Processing Fee, Total Outstanding, Total Loans, and Repayment Rate.
Do I need Power BI Desktop?
Yes. The template is a .pbix file and should be opened in Power BI Desktop.
Can I connect my own data?
Yes. You can replace the sample data or connect your own approved source inside Power BI, then refresh and validate the report.
Can I customize the pages and visuals?
Yes. You can change visuals, measures, fields, labels, colors, filters, and page layout.
Is this suitable for microfinance teams?
Yes. It is designed for microloan and microfinance portfolio reporting across repayment, risk, branch, product, channel, purpose, officer, and borrower segment views.
Can this replace loan management software?
No. It is a reporting dashboard, not loan origination, repayment collection, borrower communication, or accounting software.
About the Author
Built by PK – Microsoft Certified Professional with 15+ years of Excel, Google Sheets, and Power BI experience. Founder of NextGenTemplates, reaching 300K+ subscribers across YouTube channels. Every template is hand-built and tested before release.
Conclusion
The Digital Microloans Dashboard in Power BI helps lending and microfinance teams turn structured loan records into clear portfolio reporting. With 5 report pages, KPI cards, slicers, and focused visuals for repayment, outstanding balance, processing fees, risk, branches, loan officers, borrower type, channel, purpose, and demographics, it gives teams a practical way to review portfolio health in Power BI.
Visit YouTube.com/@PKAnExcelExpert for Excel and Power BI tutorials.