Home>Blogs>Dashboard>Diversity and Inclusion KPI Dashboard in Excel>Diversity and Inclusion KPI Dashboard 1
Diversity and Inclusion KPI Dashboard 1
23
Dec 2024
0Comments Off on Diversity and Inclusion KPI Dashboard 1
PK
Meet PK, the founder of PK-AnExcelExpert.com! With over 15 years of experience in Data Visualization, Excel Automation, and dashboard creation. PK is a Microsoft Certified Professional who has a passion for all things in Excel. PK loves to explore new and innovative ways to use Excel and is always eager to share his knowledge with others. With an eye for detail and a commitment to excellence, PK has become a go-to expert in the world of Excel. Whether you're looking to create stunning visualizations or streamline your workflow with automation, PK has the skills and expertise to help you succeed. Join the many satisfied clients who have benefited from PK's services and see how he can take your Excel skills to the next level!
https://www.pk-anexcelexpert.com
Related Articles
Legal and Compliance Resource Allocation KPI Dashboard in Excel
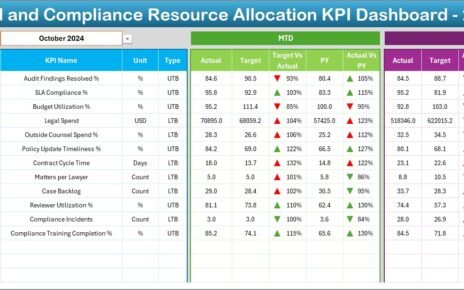
In today’s fast-paced business environment, legal and compliance teams play a vital role in risk management, governance, and regulatory adherence.
Combine Multiple Tables with VSTACK Function
Have you ever had multiple tables in Excel that you needed to combine into one? If so, you're in the
Investment Management Dashboard in Excel
Managing investments without clarity always leads to missed opportunities and delayed decisions. Therefore, investors, analysts, portfolio managers, and finance teams


