Sustainability and profitability must work together for eco resorts. While eco resorts focus on nature conservation, guest satisfaction, and responsible tourism, they still need strong financial and operational control. That is exactly why an Eco Resorts KPI Dashboard in Excel plays a crucial role.
Instead of managing scattered reports, manual registers, or disconnected Excel files, eco resort managers can monitor all key performance indicators in one structured dashboard. As a result, decision-making becomes faster, clearer, and more accurate.
In this detailed guide, you will learn what an Eco Resorts KPI Dashboard in Excel is, why it matters, how it works, its worksheet structure, advantages, best practices, and frequently asked questions. By the end, you will clearly understand how this dashboard helps eco resorts achieve sustainable growth without compromising operational efficiency.
What Is an Eco Resorts KPI Dashboard in Excel?
An Eco Resorts KPI Dashboard in Excel is a centralized performance monitoring tool designed to track, analyze, and visualize key performance indicators related to eco resort operations.
Instead of reviewing raw numbers or manual records, resort owners and managers can instantly view:
- Monthly and yearly performance
- Target vs actual comparisons
- Previous year performance
- Trends across different KPIs
- Operational and sustainability metrics
Because the dashboard works inside Excel, it remains easy to update, flexible to customize, and accessible to most users. Moreover, it does not require advanced BI tools or complex systems.
Why Do Eco Resorts Need a KPI Dashboard?
Eco resorts operate in a unique environment. They must balance sustainability goals with revenue growth, guest experience, and cost control. Therefore, clear performance visibility becomes essential.
An Eco Resorts KPI Dashboard in Excel helps because:
- It converts raw data into actionable insights
- It highlights underperforming areas quickly
- It tracks sustainability and operational KPIs together
- It supports data-driven decisions
- It improves accountability across teams
Without a KPI dashboard, eco resorts often rely on assumptions. However, assumptions do not support long-term growth. Therefore, structured KPI tracking becomes a necessity.
How Does an Eco Resorts KPI Dashboard in Excel Work?
The Eco Resorts KPI Dashboard in Excel follows a simple yet powerful logic.
First, users enter actual, target, and previous year data in dedicated input sheets. Then, Excel formulas calculate MTD (Month-to-Date) and YTD (Year-to-Date) values. After that, the dashboard automatically updates all visuals, KPI cards, and trend charts.
Because the dashboard uses drop-downs and dynamic formulas, users can:
- Change the selected month
- Switch between KPIs
- Compare different periods instantly
- Identify trends without manual recalculation
As a result, the dashboard saves time and improves accuracy.
What Are the Key Features of the Eco Resorts KPI Dashboard in Excel?
This Eco Resorts KPI Dashboard in Excel comes with a well-structured worksheet design. Each worksheet plays a specific role in performance monitoring.
Let us explore each worksheet in detail.
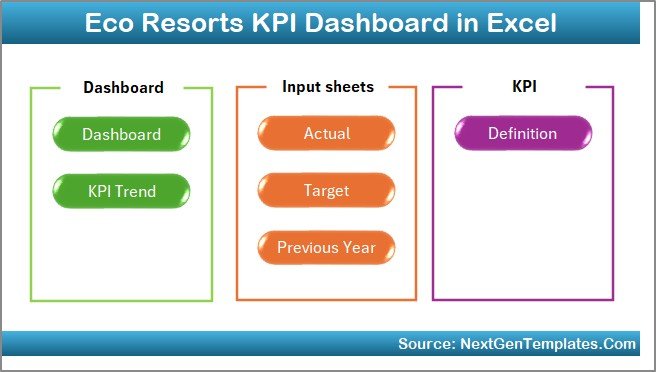
Summary Page: How Does the Index Sheet Improve Navigation?
The Summary Page works as an index sheet for the entire dashboard.
Key highlights of the Summary Page:
- It contains 6 navigation buttons
- Each button links to a specific worksheet
- Users can jump to any section with one click
- It improves usability for non-technical users
Because of this page, managers do not waste time searching through sheet tabs. Instead, they access the required analysis instantly.
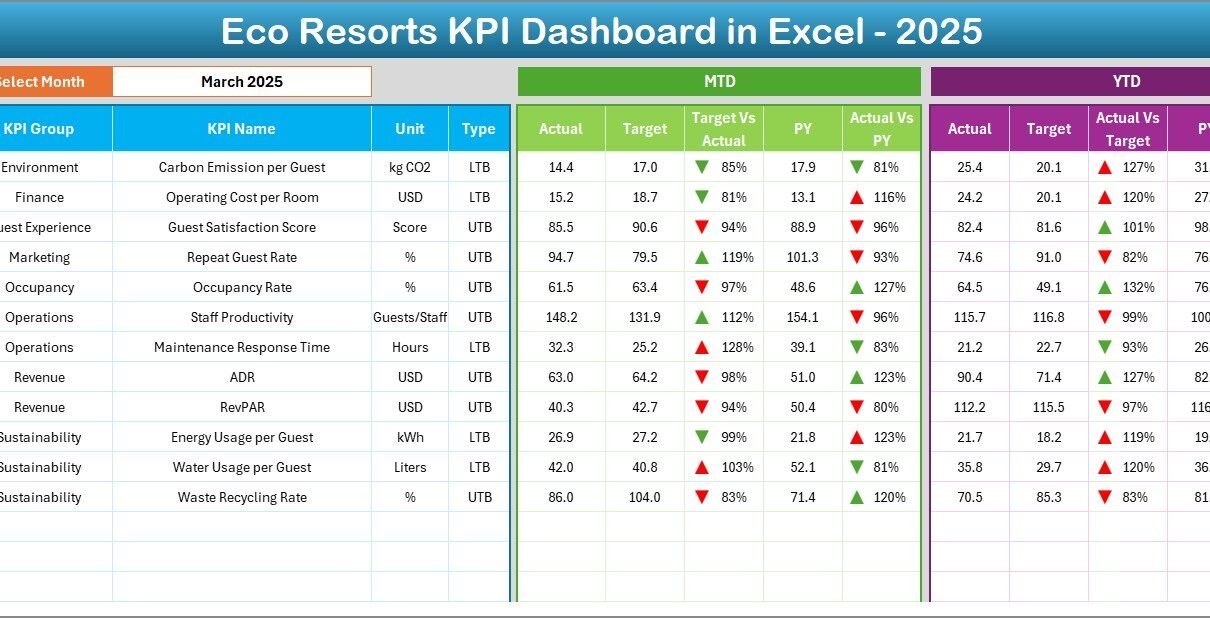
Dashboard Sheet: How Does the Main KPI Dashboard Work?
The Dashboard Sheet serves as the heart of the Eco Resorts KPI Dashboard in Excel.
Month Selection Logic
- Cell D3 contains a month drop-down
- Users select the required month
- All dashboard numbers update automatically
KPI Performance Display
The dashboard shows:
MTD (Month-to-Date) Metrics
- Actual values
- Target values
- Previous Year values
- Target vs Actual comparison
- Previous Year vs Actual comparison
- Conditional formatting with up/down arrows
YTD (Year-to-Date) Metrics
- Actual values
- Target values
- Previous Year values
- Target vs Actual comparison
- Previous Year vs Actual comparison
- Conditional formatting with up/down arrows
Because of this layout, users can evaluate short-term and long-term performance together.

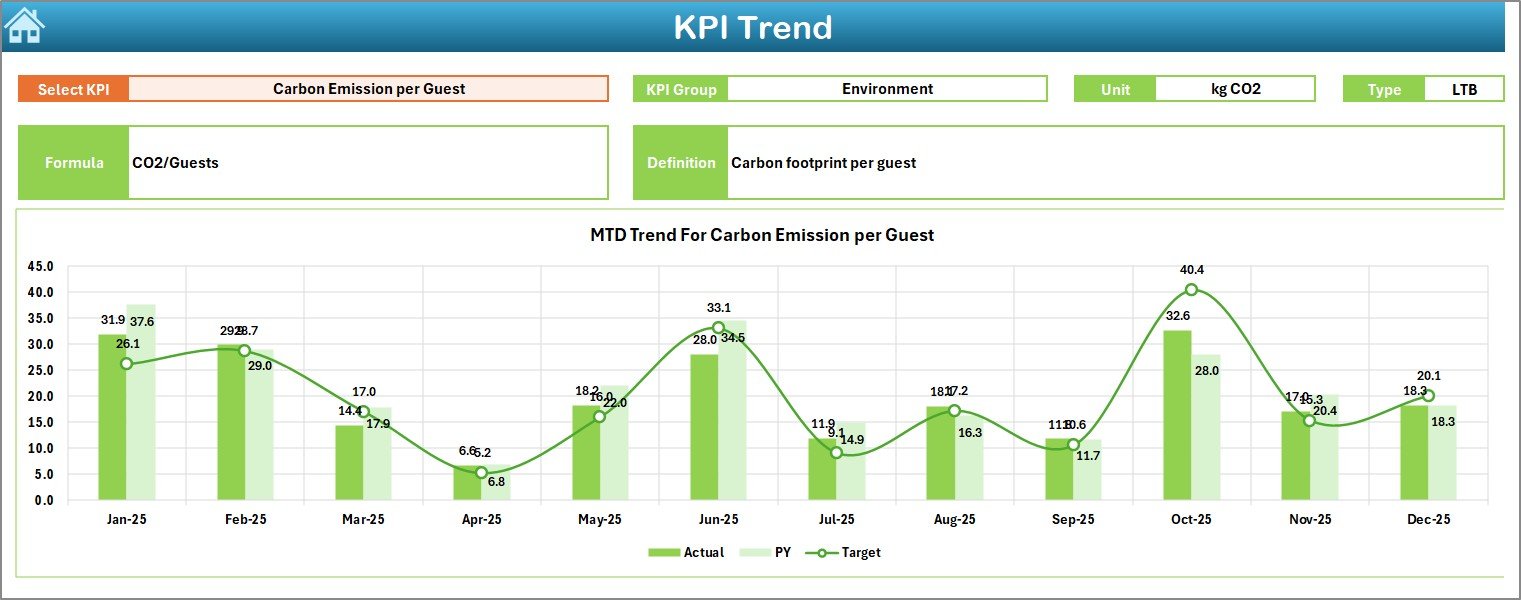
Trend Sheet: How Can You Analyze KPI Trends Over Time?
The Trend Sheet allows users to deep-dive into individual KPIs.
KPI Selection
- Cell C3 contains a KPI name drop-down
- Users select a specific KPI
- All related details update automatically
KPI Details Displayed
- KPI Group
- Unit of KPI
- Type of KPI (Lower the Better / Upper the Better)
- KPI Formula
- KPI Definition
Trend Charts
The sheet displays:
- MTD trend chart (Actual, Target, PY)
- YTD trend chart (Actual, Target, PY)
Because of these visuals, users can easily identify patterns, seasonality, and performance gaps.
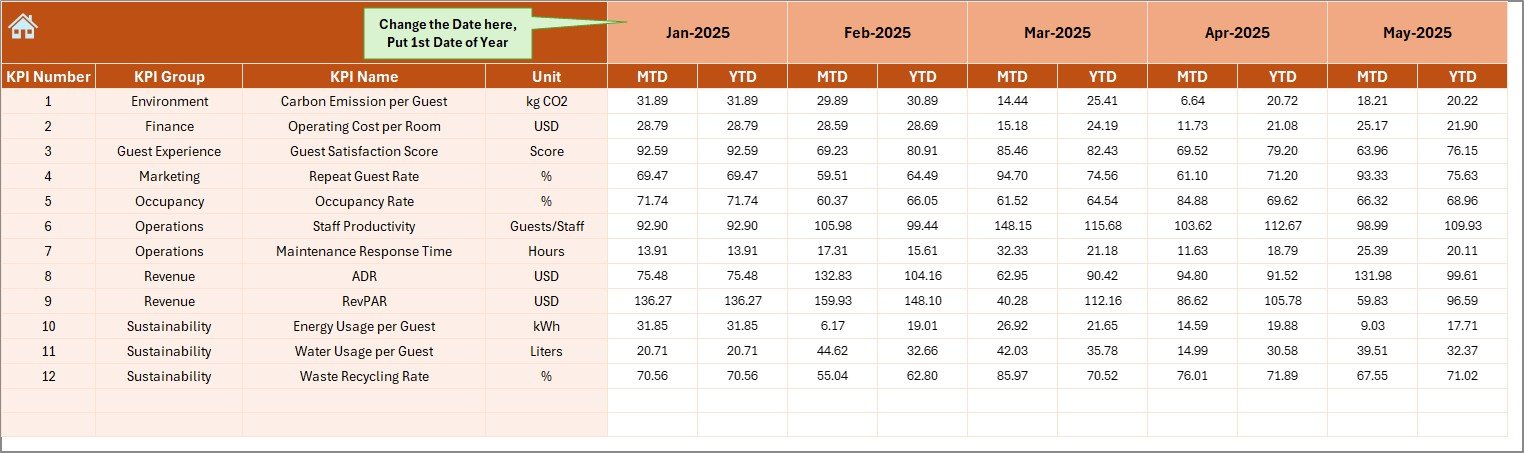
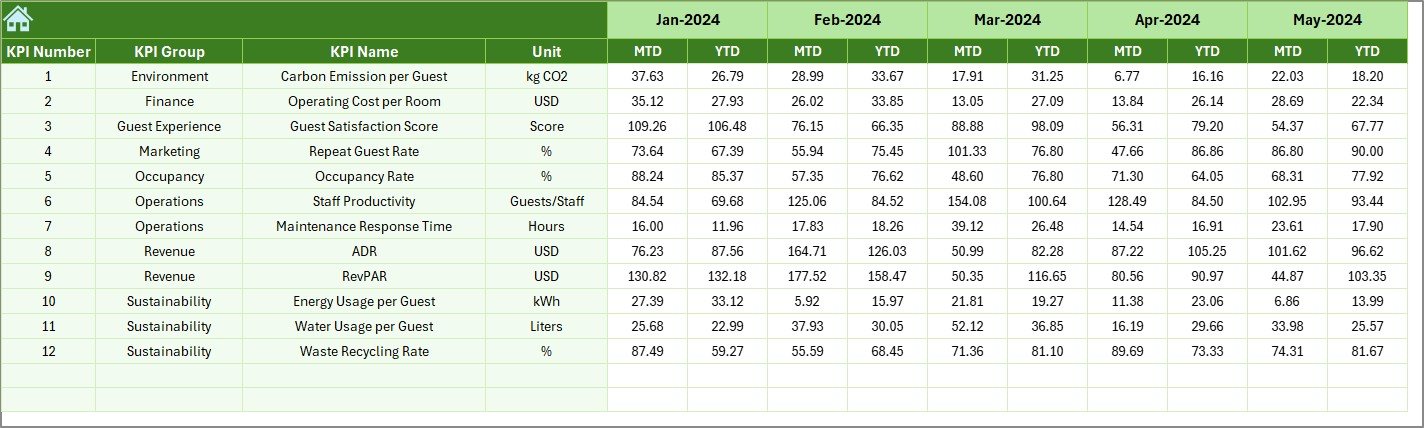
Actual Numbers Input Sheet: Where Do You Enter Actual Data?
The Actual Numbers Input Sheet stores actual performance data.
Data Entry Logic
- Cell E1 defines the first month of the year
- Users input actual MTD and YTD values
- Data updates automatically based on month selection
This structure ensures consistent data flow across the dashboard. Moreover, it reduces manual calculation errors.
Target Sheet: How Are Targets Managed?
The Target Sheet stores planned or target values for each KPI.
Key functions:
- Enter monthly MTD targets
- Enter cumulative YTD targets
- Support accurate variance analysis
Because targets remain separate from actual data, planning and performance evaluation stay clear and organized.
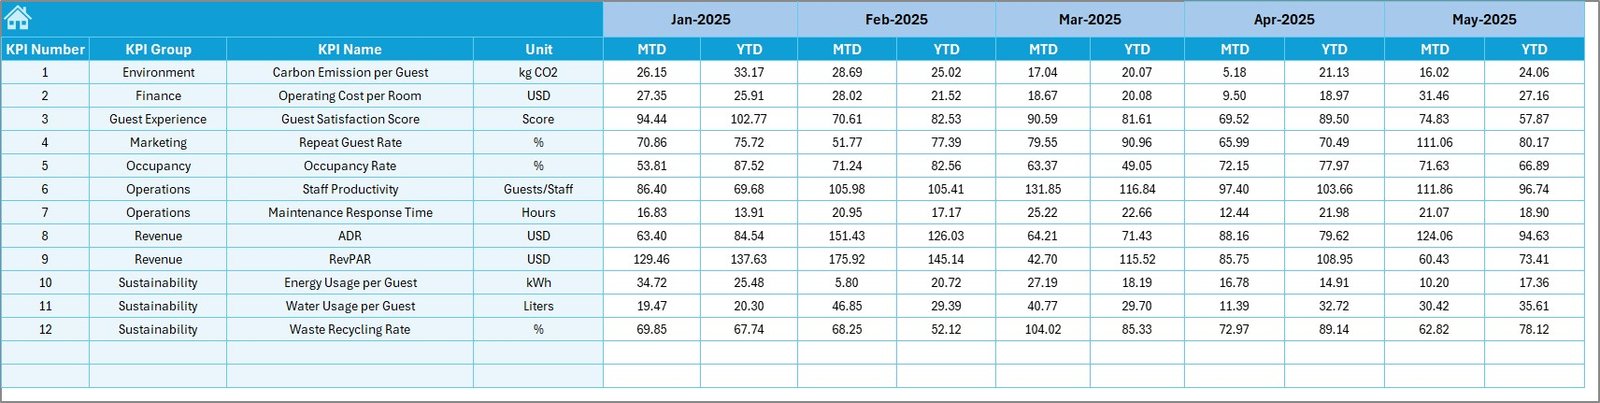
Previous Year Numbers Sheet: Why Is Historical Comparison Important?
The Previous Year Numbers Sheet captures last year’s performance.
Benefits of this sheet:
- Enables year-on-year comparison
- Highlights growth or decline trends
- Supports long-term performance analysis
By comparing current results with previous year data, eco resorts can track progress more effectively.
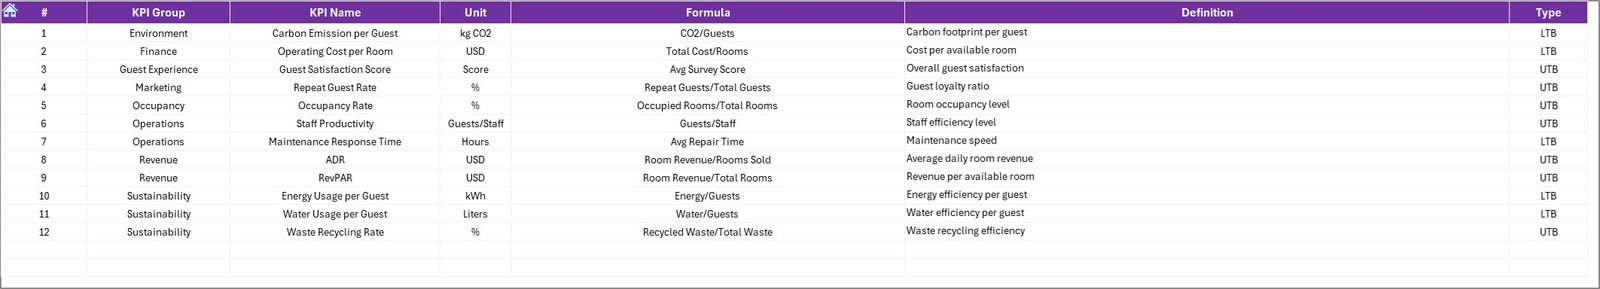
KPI Definition Sheet: How Does It Improve Data Consistency?
The KPI Definition Sheet acts as a KPI master table.
Information captured:
- KPI Name
- KPI Group
- Unit
- Formula
- KPI Definition
Because all KPIs follow standardized definitions, confusion reduces significantly. Moreover, new users understand the metrics without additional explanation.
What KPIs Can Eco Resorts Track Using This Dashboard?
An Eco Resorts KPI Dashboard in Excel can track a wide range of KPIs, such as:
- Occupancy rate
- Average daily rate (ADR)
- Revenue per available room (RevPAR)
- Energy consumption per guest
- Water usage per room
- Waste recycling rate
- Guest satisfaction score
- Staff productivity
- Maintenance response time
- Cost per occupied room
Because the dashboard remains flexible, resorts can customize KPIs based on their sustainability and business goals.
Advantages of Eco Resorts KPI Dashboard in Excel
An Eco Resorts KPI Dashboard in Excel offers several strong advantages.
- Centralized Performance Monitoring
All KPIs stay in one place. As a result, managers avoid scattered reports.
- Easy to Use
Excel remains familiar to most users. Therefore, training requirements stay minimal.
- Time-Saving Automation
Once data is entered, calculations and visuals update automatically.
- Better Decision-Making
Clear visuals help managers take timely and informed actions.
- Cost-Effective Solution
Unlike advanced BI tools, Excel dashboards require no additional software investment.
- Supports Sustainability Goals
Eco resorts can track environmental KPIs alongside financial KPIs.
How Does This Dashboard Support Sustainable Resort Management?
Sustainability remains at the core of eco resort operations. Therefore, tracking sustainability metrics becomes essential.
This dashboard supports sustainability by:
- Monitoring energy and water usage trends
- Tracking waste reduction initiatives
- Comparing environmental performance year-on-year
- Aligning operational efficiency with eco goals
Because sustainability data becomes visible, eco resorts can take corrective actions quickly.
Best Practices for the Eco Resorts KPI Dashboard in Excel
Following best practices ensures long-term success with the dashboard.
- Define KPIs Clearly
Always maintain clear KPI definitions in the KPI Definition Sheet.
- Update Data Regularly
Update actual, target, and previous year data monthly.
- Validate Data Before Entry
Check data accuracy before input to avoid misleading results.
Use Consistent Units
Maintain consistent measurement units across all KPIs.
Review Trends Monthly
Analyze trend charts regularly to identify early warning signs.
Limit KPI Overload
Track only meaningful KPIs to keep the dashboard focused.
What Challenges Can Arise While Using KPI Dashboards?
Although KPI dashboards offer many benefits, challenges may arise.
Common challenges:
- Inconsistent data entry
- Poor KPI definitions
- Overcomplicated formulas
- Too many KPIs
- Irregular updates
However, following best practices helps avoid these issues effectively.
How Can Eco Resorts Customize This KPI Dashboard?
Customization plays a major advantage of Excel dashboards.
Eco resorts can:
- Add new KPIs
- Modify KPI groups
- Adjust formulas
- Change dashboard visuals
- Include additional trend charts
Because Excel remains flexible, the dashboard evolves with business needs.
Why Is Excel Still a Powerful Tool for KPI Dashboards?
Many organizations move towards BI tools. However, Excel still holds strong value.
Excel works well because:
- It supports advanced formulas
- It allows dynamic dashboards
- It integrates easily with data sources
- It remains cost-effective
- It offers quick customization
Therefore, Excel remains a reliable choice for eco resort KPI dashboards.
Conclusion: Why Should Eco Resorts Use a KPI Dashboard in Excel?
An Eco Resorts KPI Dashboard in Excel transforms raw data into meaningful insights. It helps eco resorts monitor performance, track sustainability goals, and improve operational efficiency.
Because the dashboard offers MTD and YTD analysis, trend tracking, and year-on-year comparison, managers gain complete performance visibility. Moreover, Excel’s flexibility ensures easy customization without heavy investments.
In today’s competitive hospitality environment, eco resorts need clarity, speed, and accuracy. This KPI dashboard delivers all three in a simple and structured way.
Frequently Asked Questions About Eco Resorts KPI Dashboard in Excel
- What is the main purpose of an Eco Resorts KPI Dashboard in Excel?
The main purpose is to track, analyze, and visualize eco resort performance metrics in one centralized dashboard.
- Can non-technical users use this dashboard?
Yes, the dashboard uses simple Excel features and navigation buttons, making it user-friendly.
- How often should data be updated?
You should update data monthly to ensure accurate MTD and YTD analysis.
- Can the dashboard track sustainability KPIs?
Yes, it can track energy, water, waste, and other sustainability-related KPIs.
- Can we add more KPIs later?
Yes, Excel allows easy customization and KPI expansion.
- Does this dashboard support year-on-year comparison?
Yes, it includes a dedicated previous year data sheet for comparison.
- Is Excel reliable for long-term KPI tracking?
Yes, with proper data management and best practices, Excel remains reliable for long-term KPI analysis.
Watch the step-by-step video tutorial:
Visit our YouTube channel to learn step-by-step video tutorials