In today’s data-driven world, education services face constant pressure to measure performance, improve student outcomes, and ensure operational efficiency. From schools and colleges to training institutes and online learning platforms, decision-makers must keep track of multiple performance indicators. However, collecting and analyzing this information manually takes time, creates errors, and slows down decision-making.
To solve this, the Education Services KPI Dashboard in Excel provides a ready-to-use solution that combines performance tracking with easy-to-understand visualizations. This article will walk you through its features, benefits, best practices, and real-world applications, so you can see how it can transform your education management process.
What is an Education Services KPI Dashboard in Excel?
Click to Purchases Education Services KPI Dashboard in Excel
An Education Services KPI Dashboard in Excel is a structured performance management tool built using Microsoft Excel. It is designed to measure and monitor the Key Performance Indicators (KPIs) of schools, colleges, training centers, and educational institutions.
Instead of working with multiple spreadsheets and scattered reports, this dashboard provides:
-
A centralized view of performance data.
-
Charts and trend analysis to monitor growth.
-
MTD (Month-to-Date) and YTD (Year-to-Date) comparisons.
-
Automated conditional formatting with up/down arrows for quick interpretation.
The dashboard is fully customizable and requires only basic Excel knowledge to operate, making it suitable for educators, administrators, and analysts alike.
Key Features of the Education Services KPI Dashboard
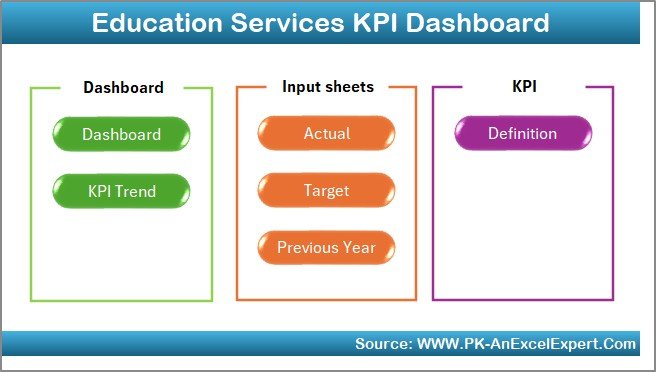
This dashboard includes seven worksheet tabs, each with a specific purpose. Let’s go through them one by one.
Home Sheet
-
Serves as the index page of the dashboard.
-
Contains six clickable buttons that link directly to respective sheets.
-
Provides a user-friendly navigation system, ensuring that even non-technical users can operate it without confusion.
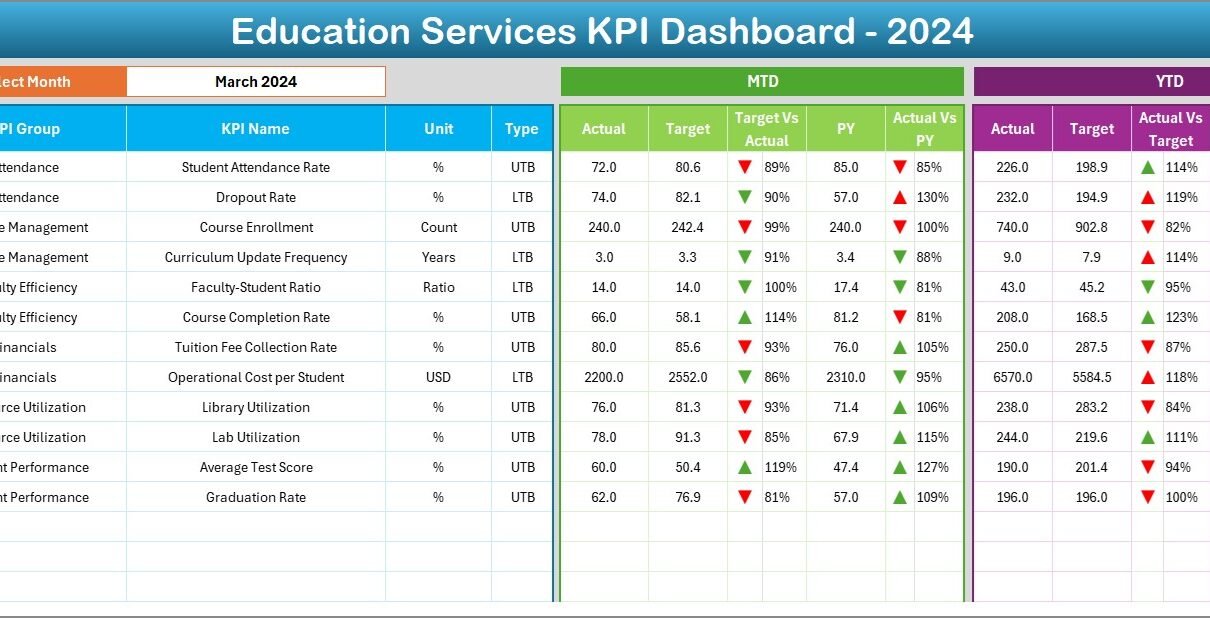
Dashboard Sheet Tab
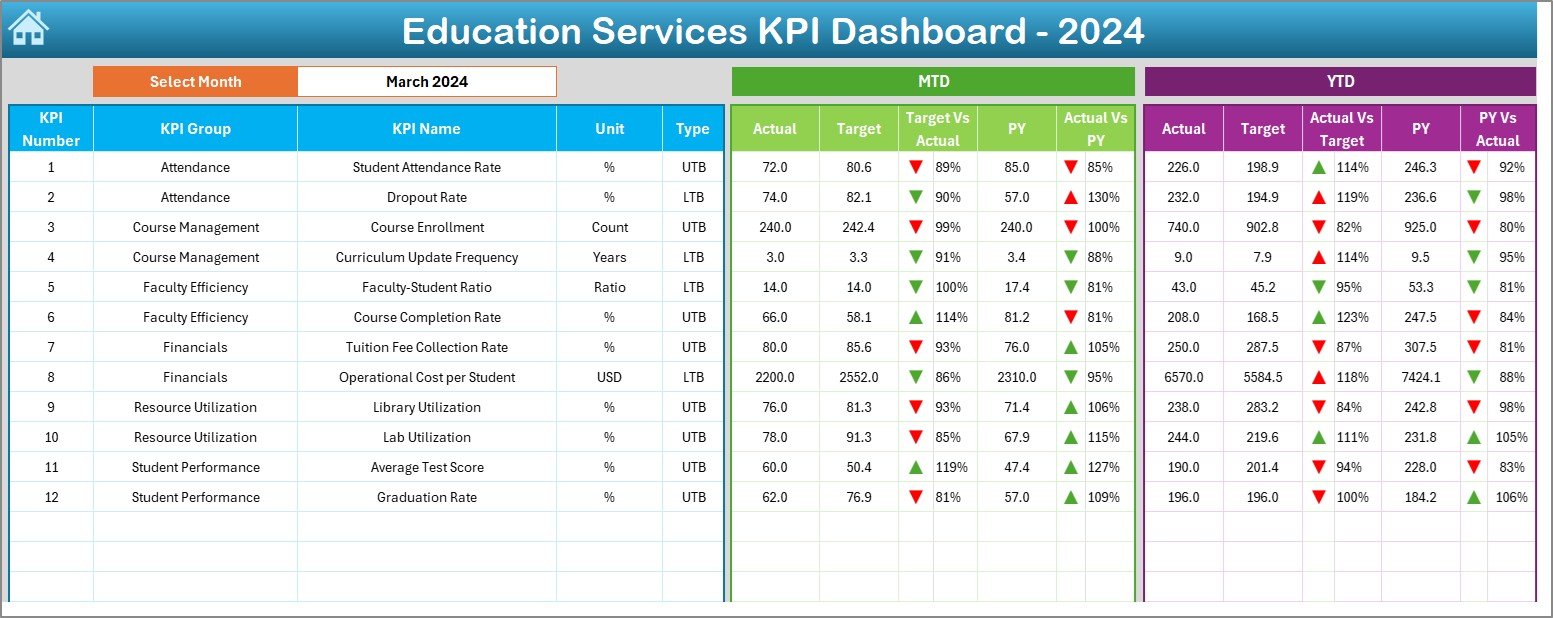
-
Acts as the main control panel where all KPI results are displayed.
-
Contains a Month selector (drop-down in cell D3). Once a month is selected, all numbers update automatically.
Displays:
- MTD Actual vs Target vs Previous Year
- YTD Actual vs Target vs Previous Year
-
Uses conditional formatting with arrows to indicate positive or negative performance trends.
KPI Trend Sheet Tab
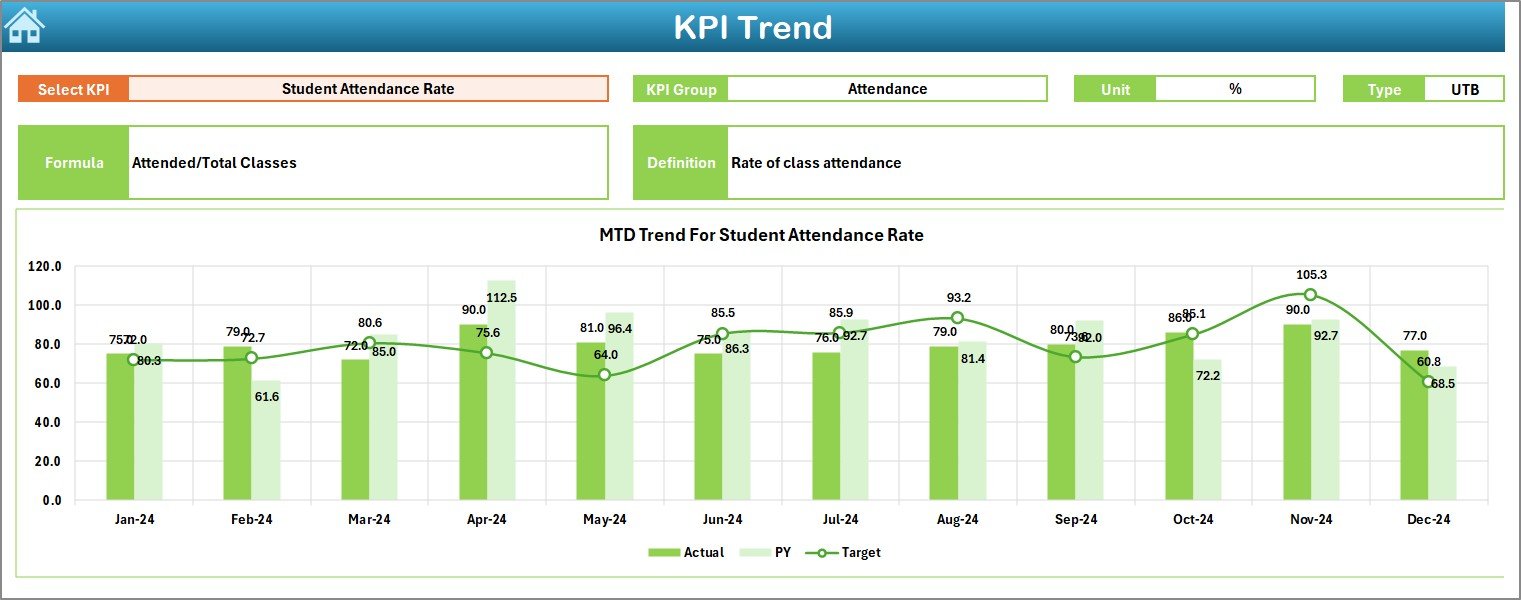
-
Lets you select a KPI from a drop-down list (cell C3).
-
Shows details such as KPI Group, Unit, Formula, and Definition.
-
Displays trend charts for Actual, Target, and Previous Year (both MTD and YTD).
-
Helps visualize performance over time, making it easier to identify strengths and weaknesses.
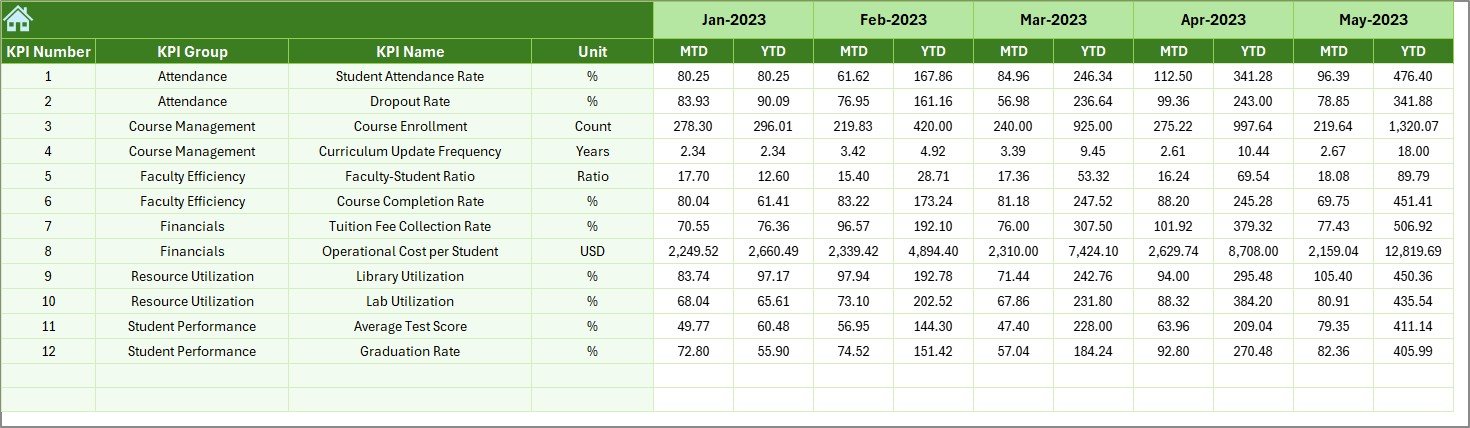
Actual Numbers Input Sheet
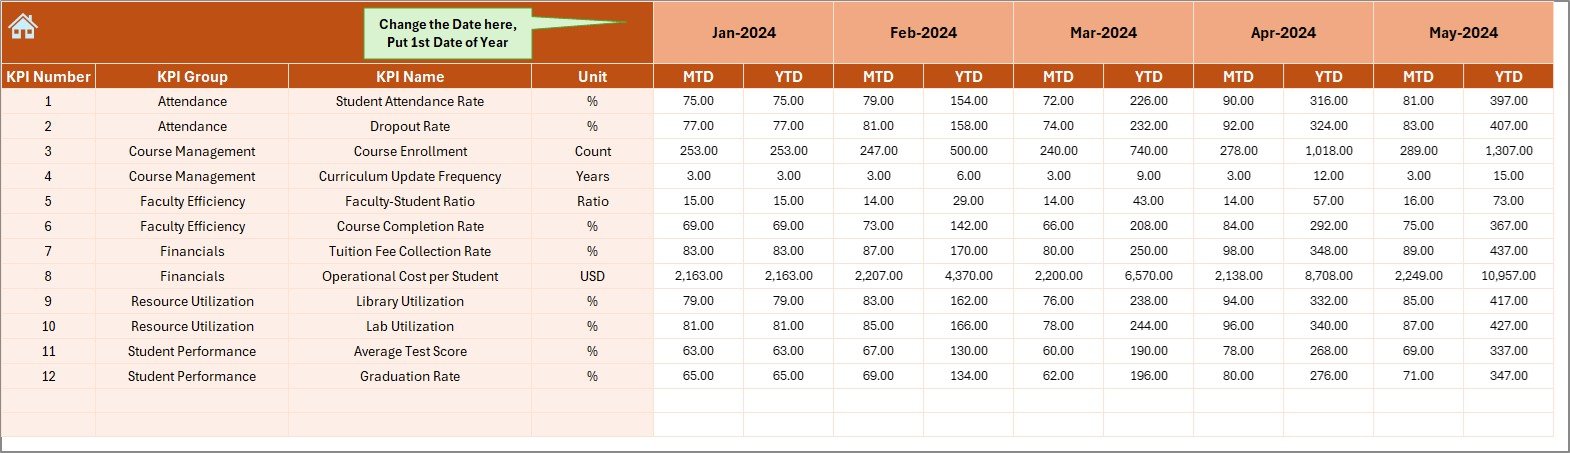
-
Designed for entering the actual performance values.
-
Supports both MTD and YTD entry.
-
Includes a control (cell E1) where you can set the first month of the year, ensuring flexibility for academic calendars.
Click to Purchases Education Services KPI Dashboard in Excel
Target Sheet Tab
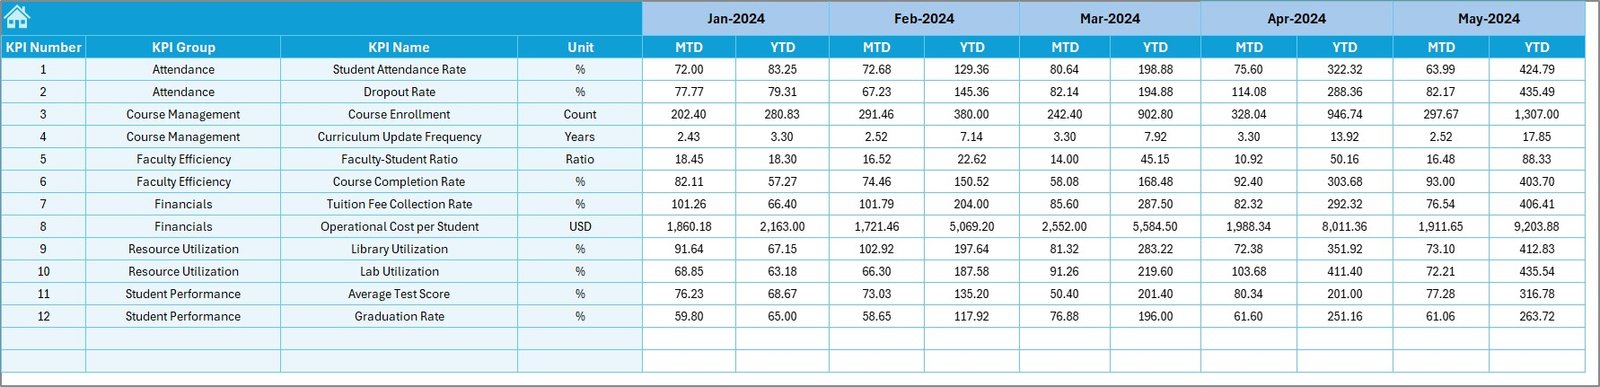
-
Dedicated to inputting monthly targets.
-
Allows entries for both MTD and YTD targets.
-
Ensures that benchmarks are always aligned with institutional goals.
Previous Year Numbers Sheet
-
Stores last year’s data for comparison.
-
Helps in calculating growth trends and historical performance analysis.
KPI Definition Sheet Tab
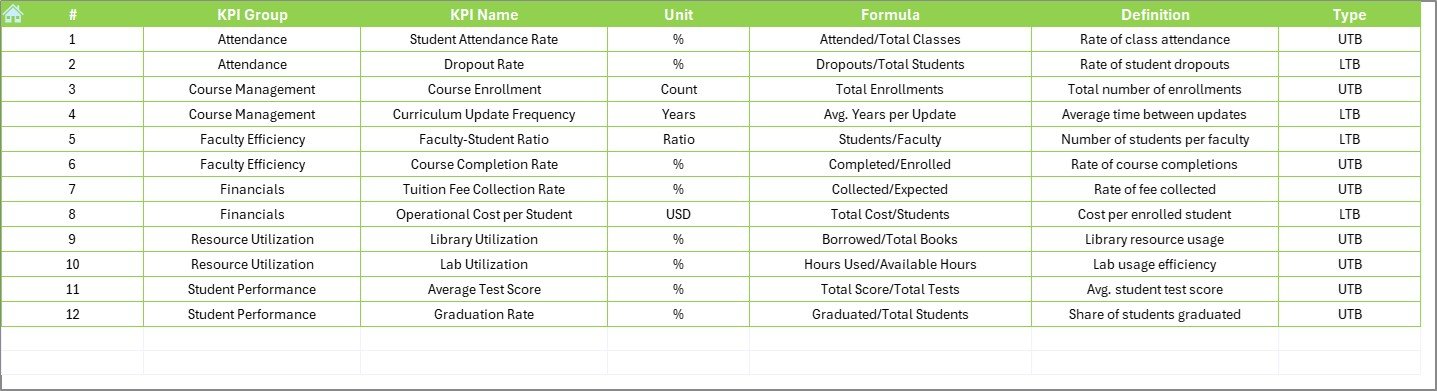
-
Contains the KPI Master List.
-
Includes columns for KPI Name, KPI Group, Unit, Formula, and Definition.
-
Keeps everything standardized and easy to interpret.
Why Do Educational Institutions Need a KPI Dashboard?
Educational institutions handle a wide range of metrics, from student satisfaction to faculty performance. Without a dashboard, administrators often struggle with:
-
Scattered data sources (different files for different KPIs).
-
Time-consuming manual reporting.
-
Lack of real-time performance insights.
-
Difficulty in tracking progress against goals.
The Education Services KPI Dashboard eliminates these problems by offering a single, automated system that provides instant insights.
Examples of KPIs in Education Services
Some of the common KPIs that can be tracked using this dashboard include:
-
Student Enrollment Rate – Total number of students enrolled compared to the target.
-
Student Retention Rate – Percentage of students continuing to the next term.
-
Faculty Utilization Rate – Measures teaching hours delivered vs planned.
-
Course Completion Rate – Tracks how many students successfully complete courses.
-
Average Class Attendance – Shows student participation levels.
-
Student Satisfaction Score – Based on surveys and feedback.
-
Dropout Rate – Percentage of students leaving before program completion.
-
Revenue per Student – Measures financial performance.
-
Operational Cost per Student – Helps track efficiency in spending.
By customizing the KPI Definition sheet, institutions can adapt the dashboard to their unique requirements.
Advantages of Education Services KPI Dashboard in Excel
Using this dashboard provides numerous benefits:
✅ Centralized Reporting – All KPIs are available in one place.
✅ Time-Saving – Automated updates reduce manual effort.
✅ Data-Driven Decisions – Administrators get real-time performance insights.
✅ Customization – KPIs can be added, removed, or modified easily.
✅ Visual Clarity – Charts and conditional formatting make trends easy to interpret.
✅ Historical Comparison – Previous year data helps track growth.
✅ User-Friendly – Built in Excel, so no extra software is required.
Opportunities for Improvement
While the dashboard is powerful, institutions can enhance its effectiveness by:
🔹 Integrating it with Learning Management Systems (LMS) for automatic data flow.
🔹 Adding real-time data connections (e.g., Power Query or SQL).
🔹 Including survey-based qualitative data like student feedback.
🔹 Using predictive analytics for forecasting future enrollment and retention trends.
🔹 Expanding the KPI library to cover research performance, grants, and faculty development.
Best Practices for the Education Services KPI Dashboard
To get maximum value from this tool, follow these best practices:
- Define KPIs Clearly – Use precise definitions in the KPI Definition sheet.
- Ensure Data Accuracy – Double-check all inputs in the Actual and Target sheets.
- Update Regularly – Enter actual numbers at the end of each month to maintain accuracy.
- Use Conditional Formatting – Keep visual indicators for quick decision-making.
- Align with Goals – Ensure that selected KPIs align with your institution’s strategic objectives.
- Involve Stakeholders – Share the dashboard with faculty, management, and decision-makers.
- Review Trends – Use the KPI Trend sheet to monitor long-term performance, not just monthly snapshots.
Real-World Use Cases
Here are some practical examples of how this dashboard can be applied:
-
Universities – Monitor faculty workload, research output, and student retention.
-
Schools – Track attendance, test results, and parent satisfaction.
-
Training Institutes – Measure course completion rates and student feedback.
-
Online Education Platforms – Evaluate engagement, revenue per student, and drop-off rates.
Step-by-Step Guide to Using the Dashboard
-
Open the Home Sheet – Navigate to the section you need.
-
Set the First Month – Define the start month in the Actual Numbers Input sheet.
-
Enter Targets – Input target values for each KPI in the Target sheet.
-
Add Actual Data – Record monthly actual values in the Actual Numbers Input sheet.
-
Review Dashboard – Select the month in the Dashboard sheet to view performance.
-
Analyze Trends – Go to the KPI Trend sheet for a detailed comparison.
-
Compare with Previous Year – Use the Previous Year Numbers sheet for historical insights.
Conclusion
The Education Services KPI Dashboard in Excel is a powerful yet simple tool for improving education management. It provides a centralized platform for monitoring performance, identifying gaps, and making informed decisions. With its automated calculations, customizable KPIs, and visual reports, it enables administrators to focus on strategy rather than manual reporting.
By adopting this dashboard, educational institutions can improve efficiency, enhance student outcomes, and achieve long-term growth.
Frequently Asked Questions (FAQs)
1. What is an Education Services KPI Dashboard?
It is an Excel-based tool designed to track and monitor KPIs for educational institutions such as schools, colleges, and training centers.
2. Can I customize the KPIs in the dashboard?
Yes, the KPI Definition sheet allows you to add or modify KPIs according to your institution’s requirements.
3. Do I need advanced Excel skills to use it?
No. The dashboard is user-friendly and requires only basic Excel knowledge.
4. How often should I update the dashboard?
You should update it monthly by entering actual data in the Actual Numbers Input sheet.
5. Can this dashboard be used for online education platforms?
Absolutely. It can track engagement, retention, course completion, and revenue per student for e-learning institutions.
6. Does the dashboard support historical comparisons?
Yes, it includes a Previous Year Numbers sheet to compare current performance with the past year.
7. What makes this dashboard better than manual reporting?
It saves time, reduces errors, and provides real-time visual insights that manual reports cannot deliver
Visit our YouTube channel to learn step-by-step video tutorials