Educational nonprofits play a vital role in shaping communities, supporting students, and improving access to learning opportunities. However, managing programs, tracking donations, monitoring expenses, and measuring impact often becomes challenging when organizations rely on scattered spreadsheets and manual reporting. Therefore, nonprofit leaders increasingly adopt structured dashboards to gain clear insights and make informed decisions.
The Educational Nonprofits Dashboard in Excel provides a powerful yet simple solution. It helps organizations monitor performance, funding, operational costs, and student satisfaction in one centralized platform. Moreover, since Excel remains widely accessible, nonprofits can implement this dashboard without expensive software investments.
In this comprehensive article, you will learn everything about the Educational Nonprofits Dashboard in Excel — including its structure, features, advantages, implementation strategy, best practices, and frequently asked questions.
Click to Purchases Educational Nonprofits Dashboard in Excel
What Is an Educational Nonprofits Dashboard in Excel?
An Educational Nonprofits Dashboard in Excel is a ready-to-use analytical reporting system designed to track nonprofit education programs using interactive charts, KPI cards, and filters.
Instead of reviewing multiple reports separately, nonprofit managers can analyze all key performance indicators from a single dashboard. As a result, leadership teams quickly understand program effectiveness and financial health.
The dashboard transforms raw data into meaningful insights such as:
-
Program expenses across countries
-
Student satisfaction levels
-
Grants and donations received
-
Operating costs by funding source
-
Regional performance comparison
-
Monthly financial trends
Because Excel supports automation, formulas, and visualization tools, organizations can monitor performance continuously while reducing manual work.
Why Do Educational Nonprofits Need a Dashboard?
Educational nonprofits handle multiple responsibilities simultaneously. For example, they manage funding sources, deliver programs, monitor outcomes, and maintain transparency for donors. However, without structured analytics, decision-making becomes slow and reactive.
A dashboard solves these challenges by providing:
-
Real-time visibility into organizational performance
-
Clear tracking of funds utilization
-
Improved accountability and reporting
-
Faster strategic planning
Furthermore, stakeholders expect measurable impact today. Therefore, dashboards help nonprofits present data-driven results confidently.
Key Features of the Educational Nonprofits Dashboard in Excel
This ready-to-use dashboard includes a Page Navigator placed on the left side, allowing users to move easily between analytical pages. Each page focuses on a specific performance area, ensuring structured analysis.
The Excel application file contains five analytical pages, along with supporting data sheets.
How Does the Overview Page Help Decision-Makers?
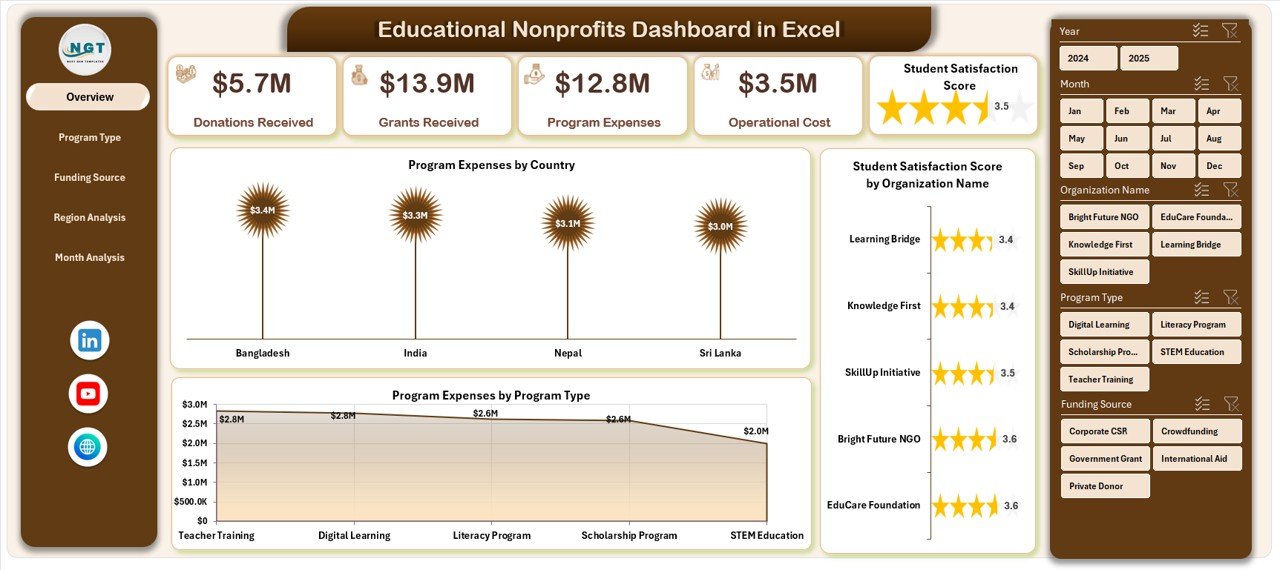
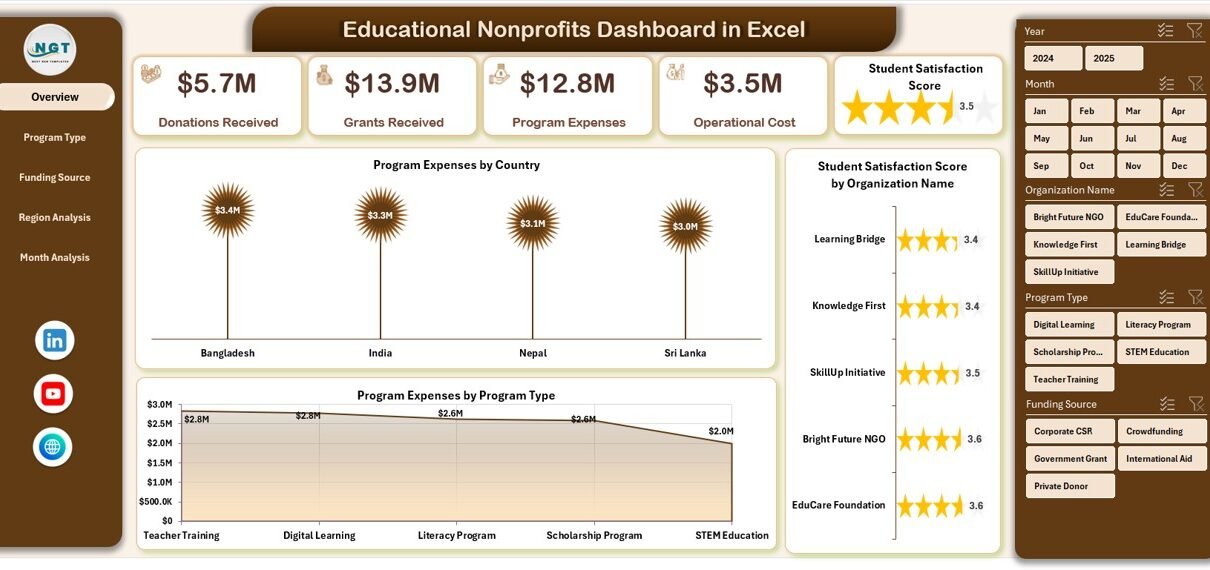
The Overview Page serves as the main interface of the dashboard. It provides a quick snapshot of organizational performance.
Key Elements
-
Right-side slicer for dynamic filtering
-
Four KPI cards showing essential metrics
-
Interactive charts for high-level insights
Charts Included
-
Program Expenses by Country
-
Student Satisfaction Score by Organization Name
-
Program Expenses by Program Type
Because this page summarizes major indicators, leaders immediately understand where resources go and how programs perform.
Additionally, users can apply filters to analyze specific countries or organizations instantly.
Click to Purchases Educational Nonprofits Dashboard in Excel
What Insights Does Program Type Analysis Provide?
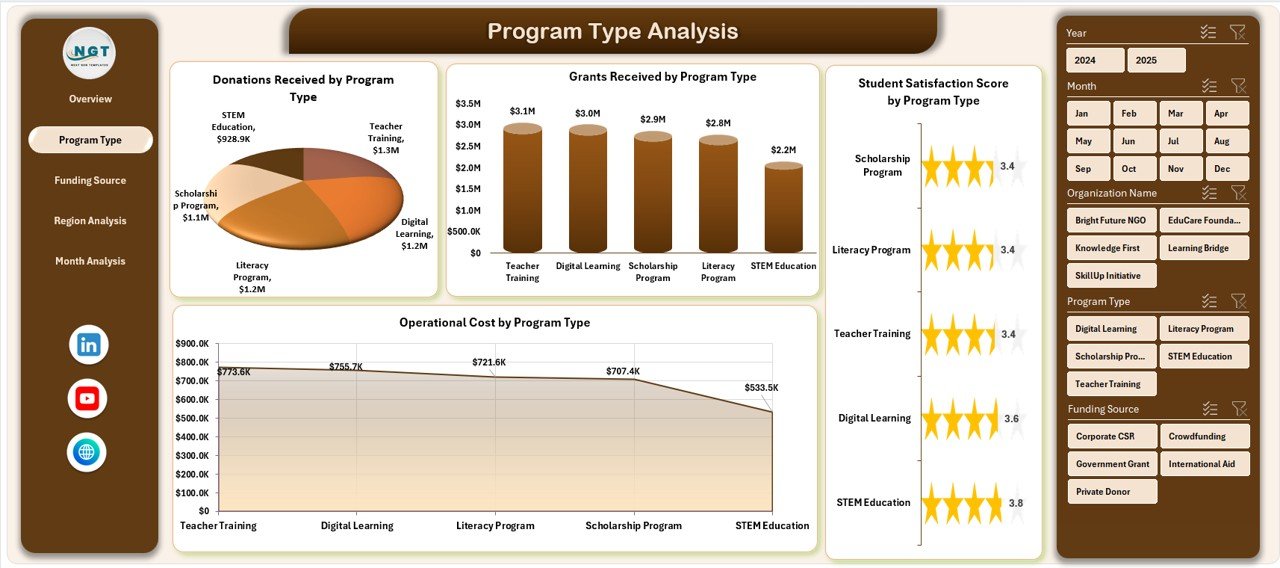
Different educational programs deliver different outcomes. Therefore, nonprofits must evaluate performance across program categories.
The Program Type Analysis Page helps users compare program effectiveness and cost efficiency.
Features
-
Right-side slicer for filtering
-
Four analytical charts
Charts Included
-
Student Satisfaction Score by Program Type
-
Grants Received by Program Type
-
Operating Cost by Program Type
-
Program performance comparison visuals
As a result, organizations identify which programs create the highest impact relative to investment.
How Does Funding Source Analysis Improve Financial Transparency?
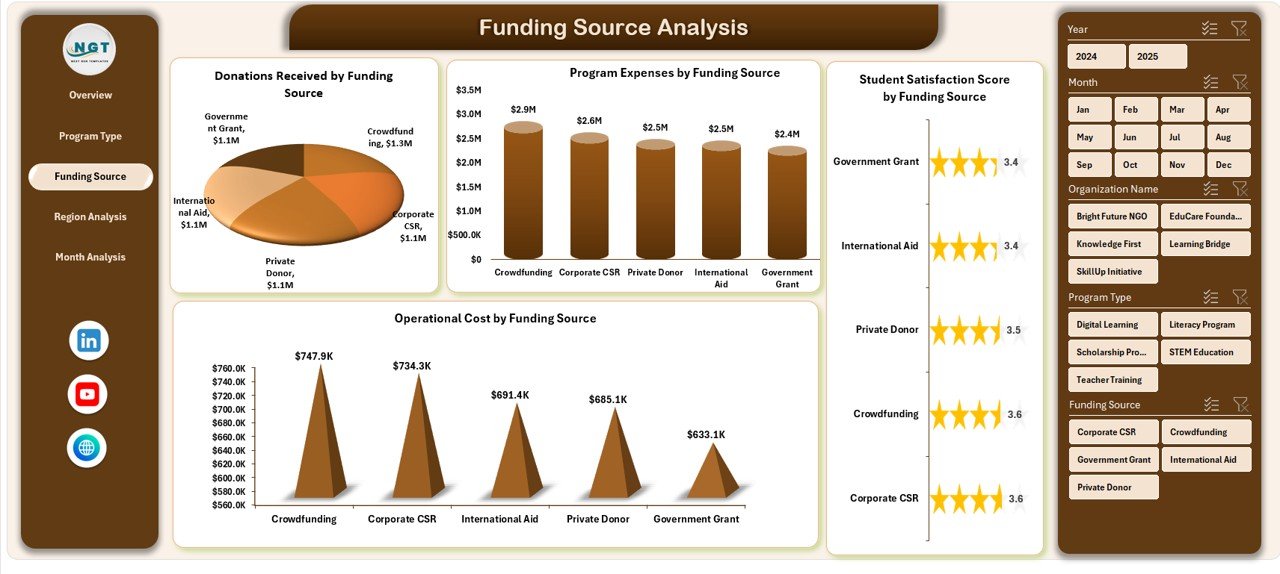
Funding sources play a crucial role in nonprofit sustainability. However, many organizations struggle to track how different funding streams influence performance.
The Funding Source Analysis Page solves this problem.
Charts Included
-
Student Satisfaction Score by Funding Source
-
Donations Received by Funding Source
-
Program Expenses by Funding Source
-
Operating Cost by Funding Source
Therefore, nonprofit leaders can understand:
-
Which funding sources support successful programs
-
How efficiently donations are utilized
-
Whether operating costs remain balanced
Consequently, organizations strengthen donor trust through transparent reporting.
Why Is Region Analysis Important for Educational Nonprofits?
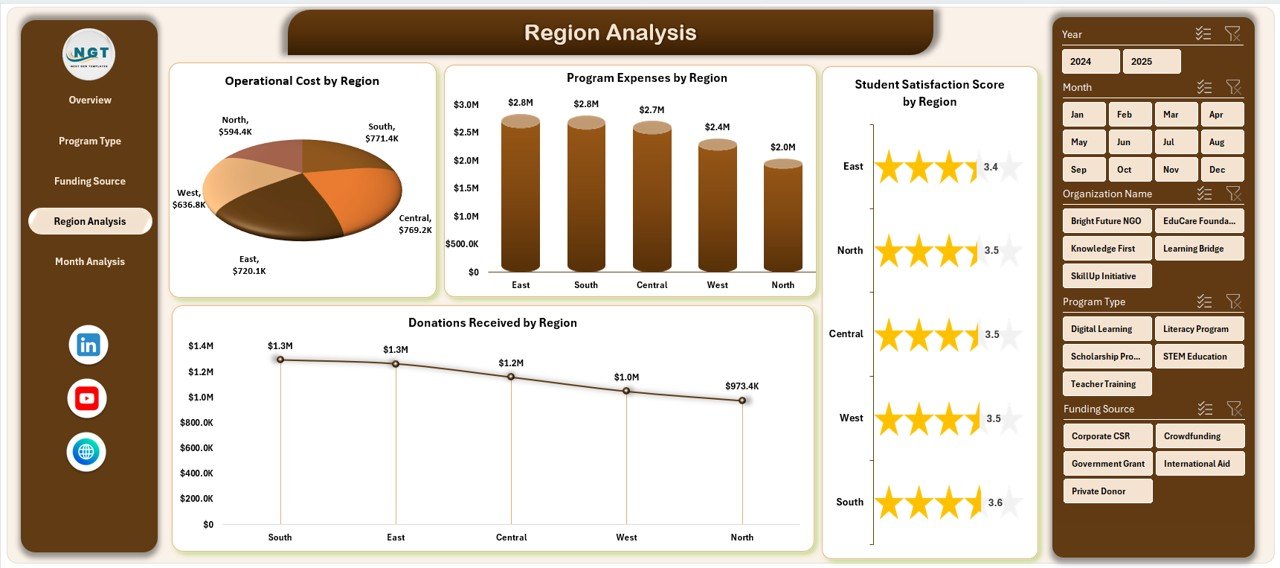
Educational impact often varies across geographic regions. Some areas may require higher investment, while others achieve better outcomes with fewer resources.
The Region Analysis Page provides location-based performance insights.
Charts Included
-
Student Satisfaction Score by Region
-
Donations Received by Region
-
Program Expenses by Region
-
Operating Cost by Region
Because of these insights, nonprofits can:
-
Allocate resources more effectively
-
Identify underserved regions
-
Improve regional program strategies
-
Click to Purchases Educational Nonprofits Dashboard in Excel
What Does Month Analysis Reveal About Financial Trends?
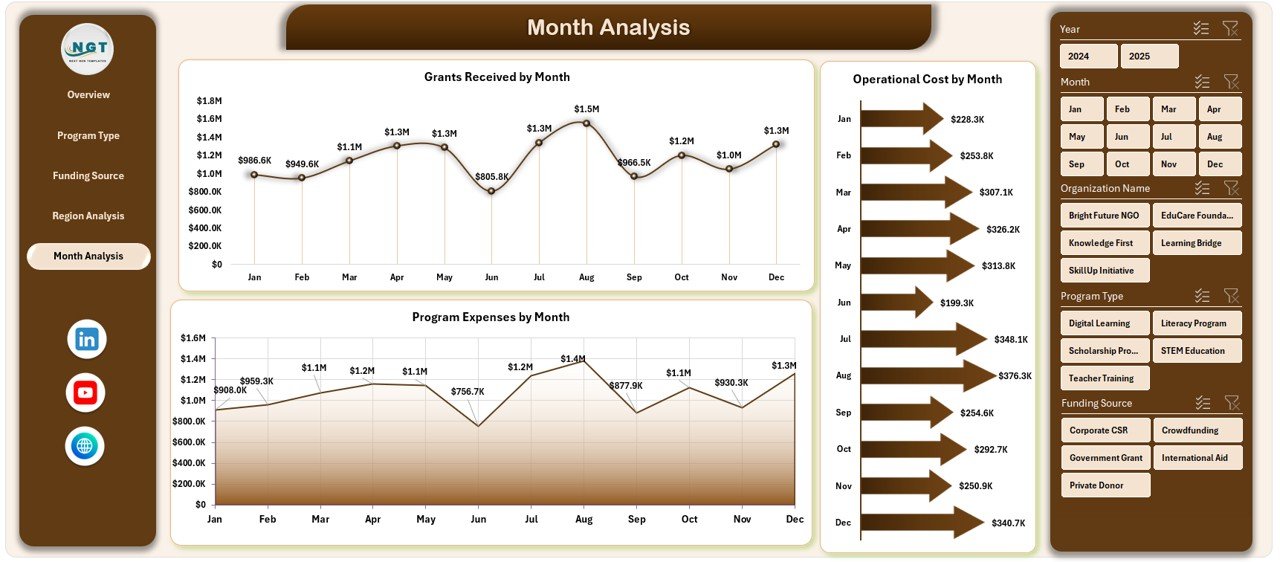
Financial performance changes throughout the year. Therefore, tracking monthly trends helps organizations plan budgets and funding cycles.
The Month Analysis Page includes:
-
Program Expenses by Month
-
Operating Cost by Month
-
Grants Received by Month
This analysis allows nonprofits to:
-
Detect seasonal funding patterns
-
Forecast future expenses
-
Optimize resource planning
Moreover, leadership teams can adjust strategies before financial challenges arise.
What Are the Supporting Sheets in the Dashboard?
Support Sheet
The support sheet manages backend calculations, lookup tables, and structured formulas. Although users rarely interact with this sheet directly, it ensures dashboard accuracy and automation.
Data Sheet
The data sheet acts as the primary data input area where users record:
-
Program details
-
Funding information
-
Expenses
-
Donations
-
Satisfaction scores
-
Regional and organizational data
Once users update the data sheet, the dashboard refreshes automatically.
Advantages of Educational Nonprofits Dashboard in Excel
Using this dashboard provides several operational and strategic benefits.
📊 Centralized Performance Monitoring
-
All metrics appear in one location.
-
Decision-makers avoid switching between files.
💰 Improved Financial Transparency
-
Track donations and grants clearly.
-
Demonstrate accountability to donors.
🎯 Better Program Evaluation
-
Compare program types easily.
-
Identify high-impact initiatives quickly.
⏱️ Time-Saving Reporting
-
Automated charts reduce manual analysis.
-
Reports generate instantly.
📈 Data-Driven Decision Making
-
Leaders rely on facts instead of assumptions.
-
Strategic planning becomes easier.
💡 Cost-Effective Solution
Click to Purchases Educational Nonprofits Dashboard in Excel
-
Excel eliminates expensive software costs.
-
Teams adopt the system quickly.
How Can Organizations Implement This Dashboard Successfully?
Implementing a dashboard requires planning and consistency. Follow these steps for smooth adoption.
Step 1: Prepare Your Data
Collect accurate data related to programs, expenses, and funding sources.
Step 2: Standardize Data Entry
Ensure team members use consistent formats.
Step 3: Upload Data into the Data Sheet
Enter information into predefined columns.
Step 4: Apply Filters and Review Insights
Use slicers to analyze performance.
Step 5: Share Reports with Stakeholders
Export dashboard views for meetings and donor presentations.
Best Practices for the Educational Nonprofits Dashboard in Excel
Organizations achieve better results when they follow proven practices.
✅ Update Data Regularly
Frequent updates ensure reliable insights.
✅ Maintain Data Accuracy
Verify entries before analysis.
✅ Use Filters Strategically
Analyze specific programs, regions, or funding sources.
✅ Focus on Key KPIs
Avoid information overload.
✅ Train Team Members
Ensure everyone understands dashboard usage.
✅ Review Trends Monthly
Identify issues early and adjust strategies.
Common Challenges Educational Nonprofits Face Without a Dashboard
Without structured analytics, organizations often encounter problems such as:
-
Delayed reporting
-
Limited financial visibility
-
Difficulty measuring program impact
-
Inefficient resource allocation
-
Reduced donor confidence
However, dashboards eliminate these obstacles by organizing data visually.
How Does This Dashboard Improve Donor Communication?
Click to Purchases Educational Nonprofits Dashboard in Excel
Donors expect transparency and measurable outcomes. Therefore, presenting clear analytics strengthens relationships.
With this dashboard, nonprofits can:
-
Show funding utilization visually
-
Demonstrate program outcomes
-
Provide professional reports quickly
-
Highlight impact metrics clearly
As a result, organizations improve fundraising success.
Who Can Benefit from This Dashboard?
The Educational Nonprofits Dashboard in Excel benefits various stakeholders.
Nonprofit Leaders
Monitor strategy and performance.
Program Managers
Evaluate operational effectiveness.
Finance Teams
Track funding and expenses.
Donors & Stakeholders
Understand organizational impact.
Analysts & Coordinators
Simplify reporting tasks.
Why Excel Remains Ideal for Nonprofit Dashboards?
Although advanced tools exist, Excel continues to offer strong advantages.
-
Easy to use
-
Widely available
-
Customizable
-
Low cost
-
Compatible with existing workflows
Therefore, even small nonprofits can implement professional analytics without technical expertise.
Future Opportunities for Educational Nonprofits Using Dashboards
As organizations grow, dashboards enable advanced analytics such as:
-
Impact forecasting
-
Grant performance prediction
-
Resource optimization models
-
Automated reporting systems
Consequently, nonprofits move toward data-driven operations.
Conclusion
Educational nonprofits operate in a mission-driven environment where every decision influences student outcomes and community development. Therefore, organizations must monitor performance carefully while maintaining financial transparency.
The Educational Nonprofits Dashboard in Excel provides a structured, user-friendly, and powerful solution for tracking programs, funding, expenses, and satisfaction metrics. By combining interactive visuals with centralized reporting, the dashboard transforms complex data into actionable insights.
Moreover, organizations improve accountability, enhance donor confidence, and make smarter decisions through clear analytics. As a result, nonprofits can focus more on delivering educational impact rather than managing spreadsheets.
Frequently Asked Questions (FAQs)
What is an Educational Nonprofits Dashboard in Excel used for?
It helps nonprofits track program performance, funding, expenses, and satisfaction metrics in one centralized reporting system.
Do I need advanced Excel skills to use this dashboard?
No. The dashboard comes ready to use with automated calculations and filters.
Can small nonprofits use this dashboard?
Yes. Excel makes it affordable and suitable for organizations of all sizes.
How often should data be updated?
Organizations should update data monthly or weekly for accurate insights.
Can the dashboard be customized?
Yes. Users can modify charts, KPIs, and layouts based on organizational needs.
Does the dashboard support multiple regions and programs?
Yes. It analyzes performance across regions, program types, and funding sources.
How does this dashboard help donors?
It provides transparent visual reports showing how funds create impact.
Visit our YouTube channel to learn step-by-step video tutorials