Electricity procurement plays a critical role in managing operational costs for organizations across industries. Whether you manage manufacturing plants, commercial buildings, data centers, or public infrastructure, electricity remains one of the most significant and recurring expenses. Therefore, tracking procurement cost, taxes, contracts, suppliers, and energy sources accurately is no longer optional.
However, many organizations still rely on scattered spreadsheets and manual reports. As a result, visibility drops, cost overruns increase, and decision-making becomes reactive instead of proactive.
That is exactly why the Electricity Procurement Dashboard in Excel becomes an essential solution.
In this detailed and SEO-friendly blog post, you will learn everything about the Electricity Procurement Dashboard in Excel. You will understand what it is, how it works, its structure, key features, advantages, best practices, and frequently asked questions. By the end, you will clearly see how this dashboard helps you gain control, transparency, and confidence in electricity procurement decisions.
Click to Purchases Electricity Procurement Dashboard in Excel
What Is an Electricity Procurement Dashboard in Excel?
An Electricity Procurement Dashboard in Excel is a ready-to-use analytical template designed to track, analyze, and visualize electricity procurement data in a structured and interactive way. Instead of working with raw tables, this dashboard converts complex procurement data into clear KPIs, charts, and trends.
Because the dashboard runs in Microsoft Excel, it remains easy to use and flexible. At the same time, it delivers powerful insights without the need for expensive BI tools or complex systems.
This dashboard helps answer important questions such as:
-
What is our gross electricity procurement cost?
-
How much tax do we pay on electricity procurement?
-
What is the net procurement cost after tax?
-
Which utility suppliers cost the most?
-
How do different contract types impact cost?
-
Which energy sources drive higher tax impact?
-
How does electricity procurement change month by month?
Why Do Organizations Need an Electricity Procurement Dashboard?
Electricity procurement involves multiple variables, including suppliers, contracts, energy sources, regions, and taxes. Therefore, managing this data manually often leads to errors and delays.
Organizations need an Electricity Procurement Dashboard because it:
-
Centralizes electricity procurement data
-
Improves cost transparency and accountability
-
Highlights tax impact and hidden costs
-
Supports supplier and contract analysis
-
Enables trend-based decision-making
As a result, organizations gain better control over electricity spend and reduce financial risk.
Key Features of the Electricity Procurement Dashboard in Excel
The Electricity Procurement Dashboard in Excel comes with a clean layout and powerful analytical capabilities. Let us explore its key features step by step.
Page Navigator for Easy Access
The dashboard includes a Page Navigator located on the left side. This navigator allows users to move seamlessly across different analytical pages.
Because of this feature, users save time and access insights instantly without scrolling through multiple sheets.
Dashboard Structure – 5 Analytical Pages Explained
The Electricity Procurement Dashboard in Excel consists of 5 dedicated analytical pages, each designed to answer specific procurement-related questions.
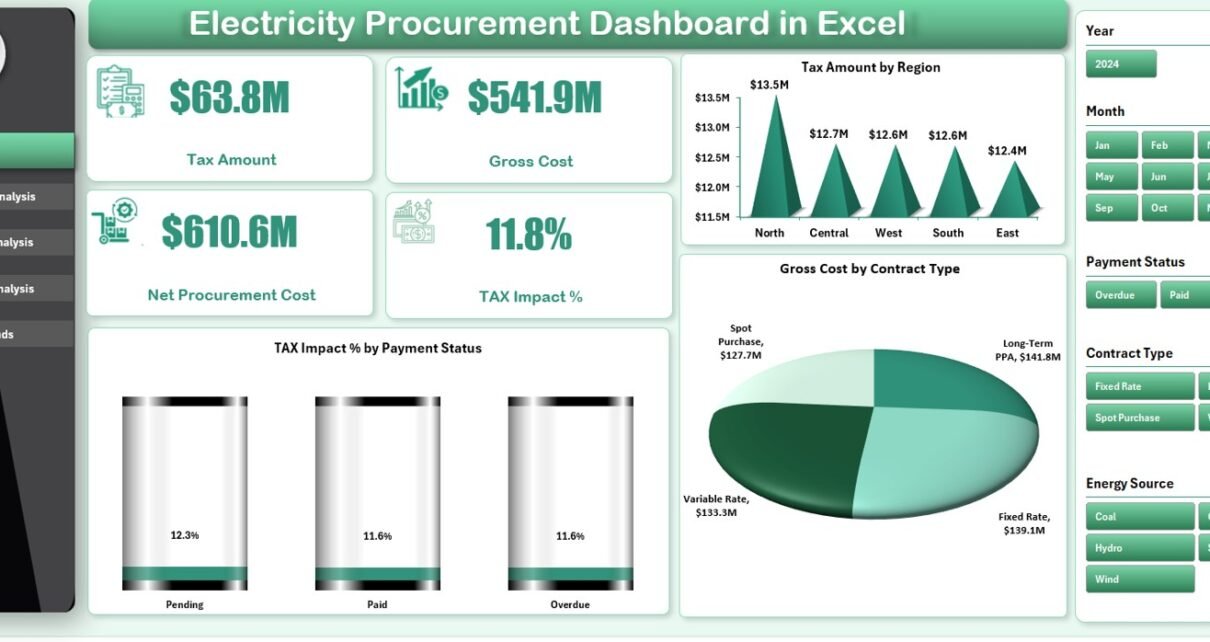
1. Overview Page – What Is Our Overall Electricity Procurement Performance?
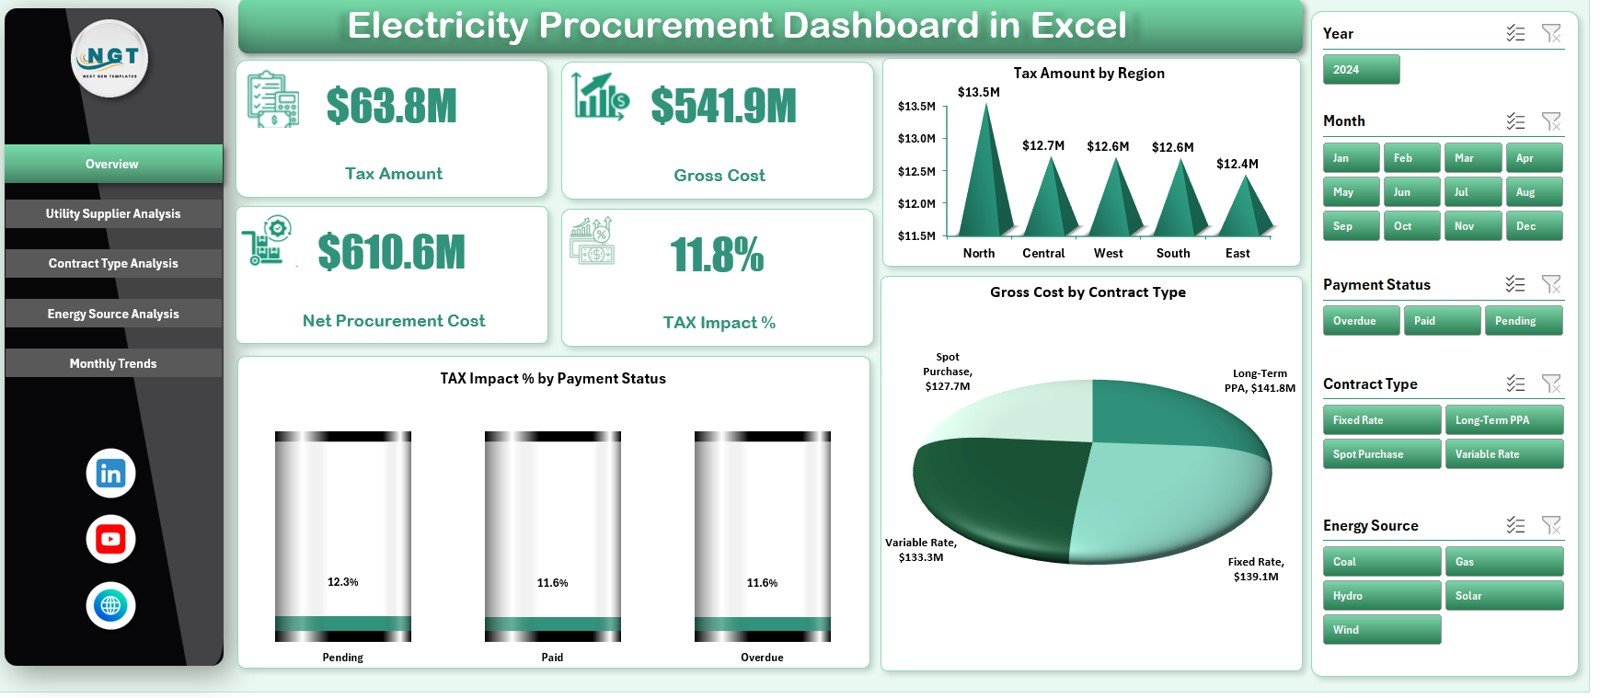
The Overview Page provides a high-level summary of electricity procurement performance. It acts as the first point of reference for management and decision-makers.
KPI Cards on the Overview Page
The Overview Page includes key KPI cards that highlight critical procurement metrics:
-
Tax Amount – Shows the total tax paid on electricity procurement
-
Gross Cost – Displays the total electricity procurement cost before deductions
-
Net Procurement Cost – Shows the actual cost after tax adjustments
-
Tax Impact % – Indicates how much tax affects overall procurement cost
These KPIs deliver instant clarity on cost structure and financial impact.
Charts on the Overview Page
The Overview Page also includes three insightful charts:
-
Tax Amount by Region – Compares tax burden across regions
-
Gross Cost by Contract Type – Shows cost distribution by contract category
-
Tax Impact % by Payment Status – Highlights tax impact based on payment conditions
Together, these visuals help stakeholders understand where costs concentrate and where corrective action is required.
Click to Purchases Electricity Procurement Dashboard in Excel
2. Utility Supplier Analysis – Which Suppliers Drive Higher Costs?
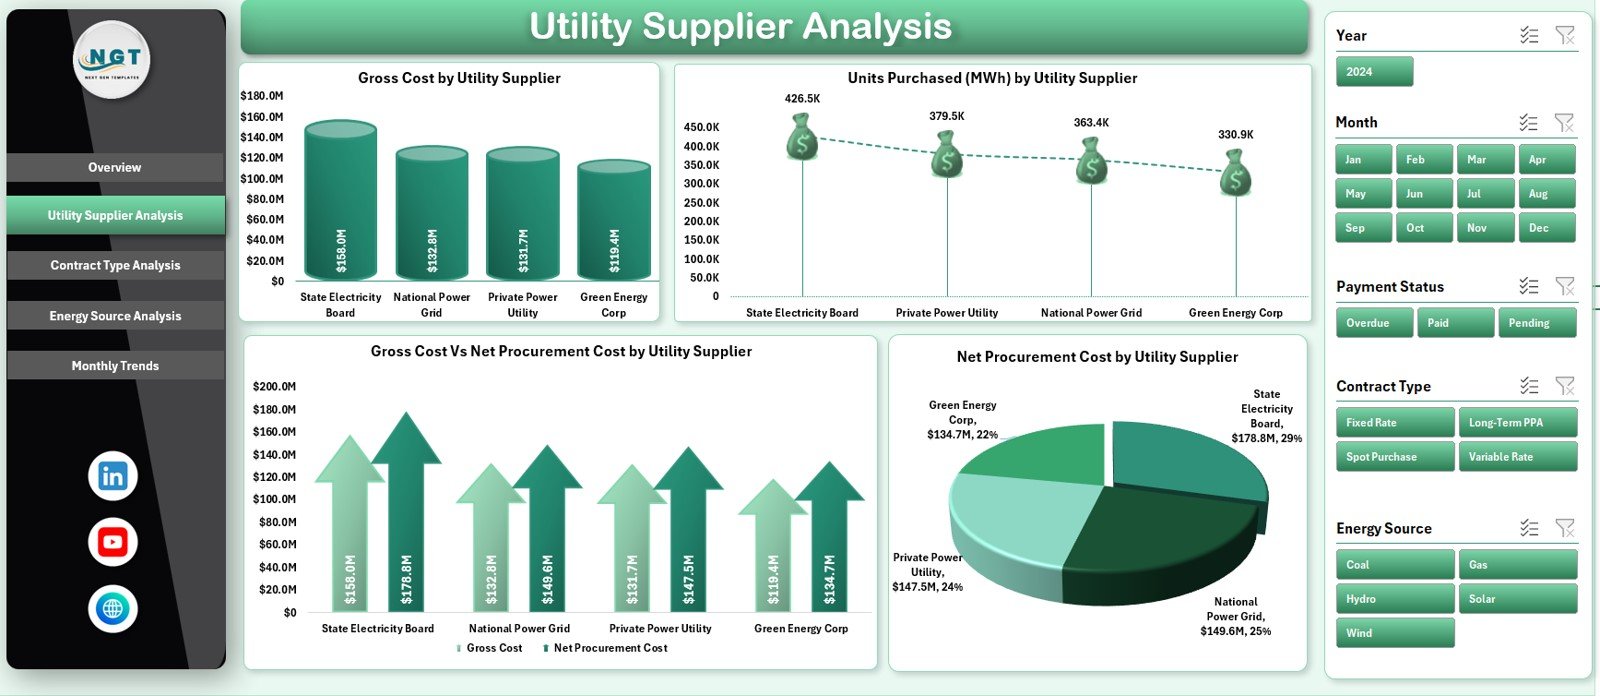
The Utility Supplier Analysis Page focuses on comparing electricity procurement performance across different utility suppliers.
Key Charts on Utility Supplier Analysis Page
This page includes four powerful charts:
-
Gross Cost by Utility Supplier – Identifies suppliers with the highest procurement cost
-
Units Purchased (MWh) by Utility Supplier – Shows electricity volume by supplier
-
Gross Cost vs Net Procurement Cost by Utility Supplier – Highlights tax and cost differences
-
Net Procurement Cost by Utility Supplier – Compares actual spend across suppliers
As a result, procurement teams can evaluate supplier efficiency and negotiate better pricing.
3. Contract Type Analysis – How Do Contracts Affect Procurement Cost?
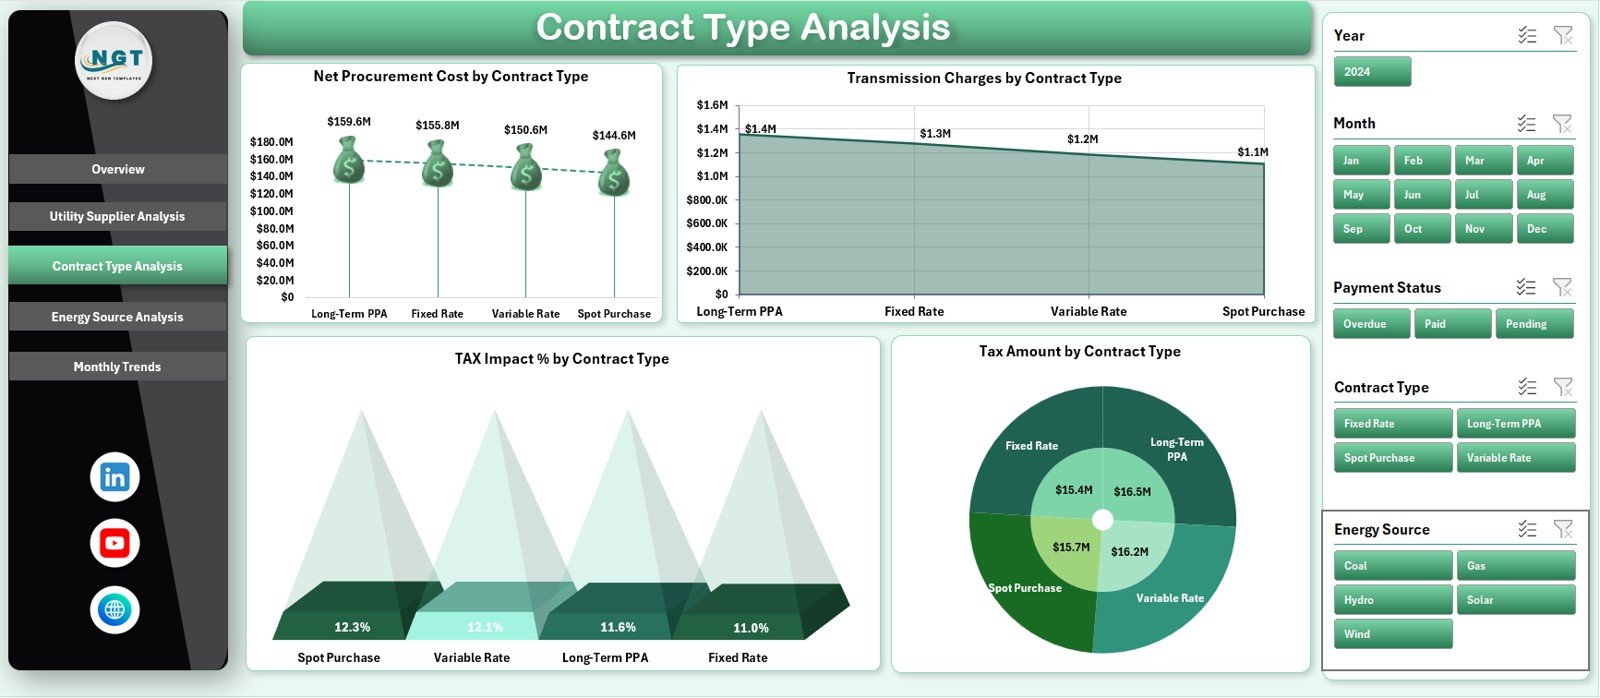
Electricity procurement often involves multiple contract types such as fixed-rate, variable-rate, long-term, and short-term agreements. Therefore, understanding contract performance becomes essential.
Key Charts on Contract Type Analysis Page
This page includes four detailed charts:
-
Net Procurement Cost by Contract Type – Compares actual cost across contracts
-
Transmission Charges by Contract Type – Highlights additional cost impact
-
Tax Impact % by Contract Type – Shows tax burden variation
-
Tax Amount by Contract Type – Identifies high-tax contracts
Because of this analysis, organizations can redesign procurement strategies and optimize contract selection.
Click to Purchases Electricity Procurement Dashboard in Excel
4. Energy Source Analysis – How Does Energy Mix Impact Procurement Cost?
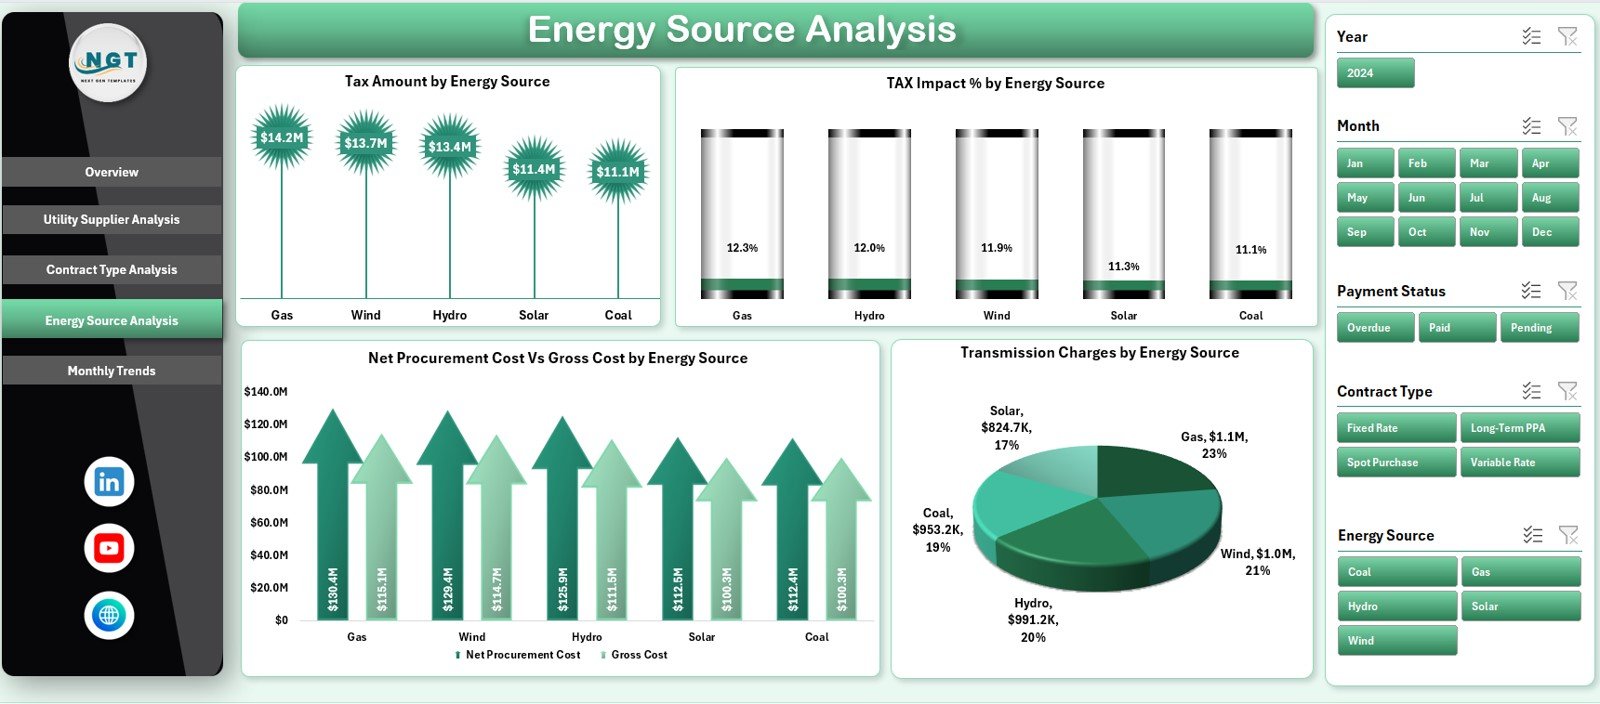
The Energy Source Analysis Page helps organizations understand the cost impact of different energy sources such as coal, gas, hydro, solar, or wind.
Key Charts on Energy Source Analysis Page
This page includes four insightful charts:
-
Tax Amount by Energy Source – Compares tax levels across energy types
-
Tax Impact % by Energy Source – Highlights tax burden differences
-
Net Procurement Cost vs Gross Cost by Energy Source – Shows cost structure clearly
-
Transmission Charges by Energy Source – Identifies transmission-heavy energy types
As sustainability becomes a priority, this page supports energy mix optimization and renewable planning.
5. Monthly Trends – How Does Electricity Procurement Change Over Time?
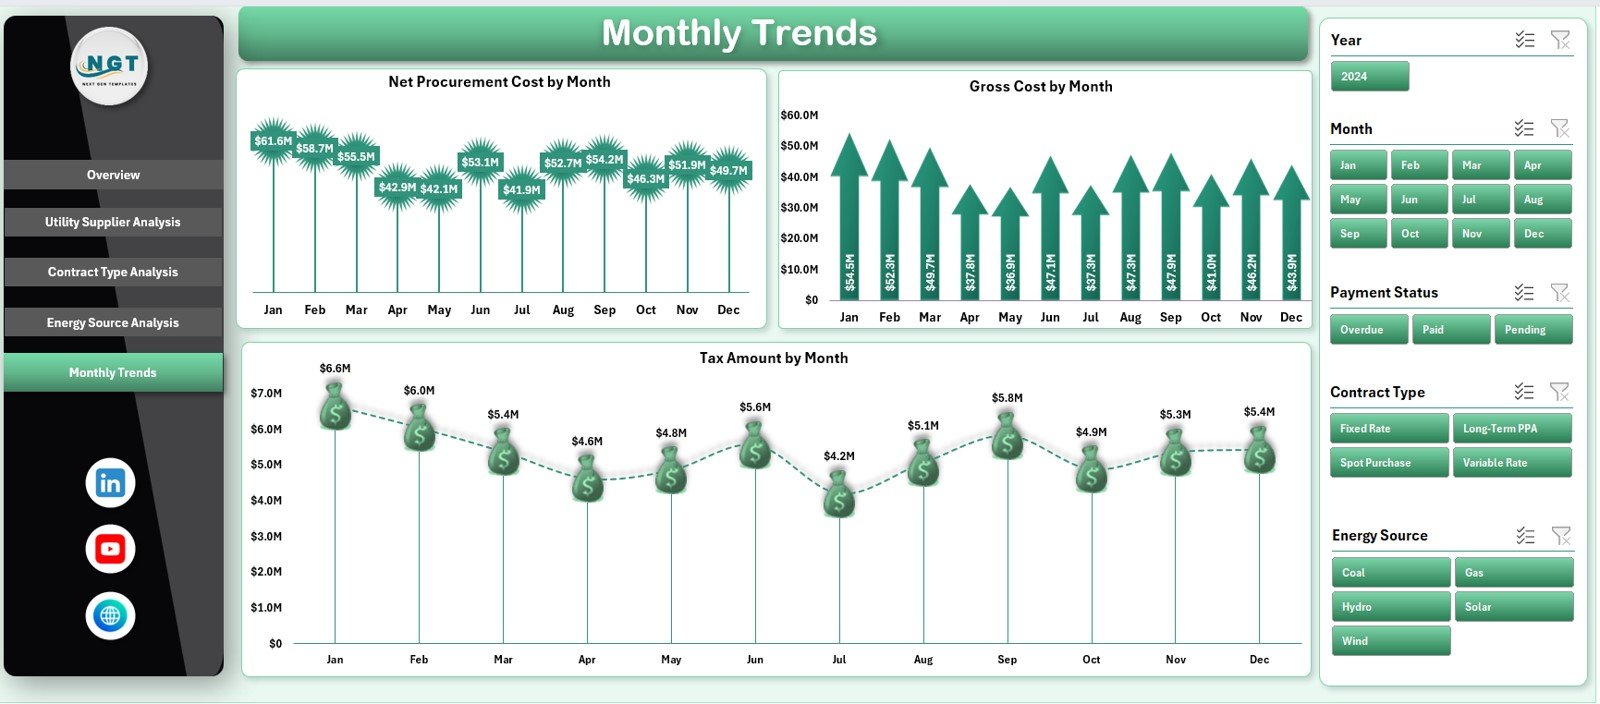
The Monthly Trends Page focuses on time-based analysis of electricity procurement.
Key Charts on Monthly Trends Page
This page includes three trend charts:
-
Net Procurement Cost by Month – Tracks monthly spending patterns
-
Gross Cost by Month – Shows overall procurement trends
-
Tax Amount by Month – Highlights tax fluctuations over time
These trends support budgeting, forecasting, and seasonal planning.
Support Sheet and Data Sheet – The Backbone of the Dashboard
Behind the visual dashboard lies a structured data foundation.
-
Data Sheet stores raw electricity procurement data such as supplier, contract type, energy source, region, units, tax, and cost.
-
Support Sheet contains calculations, helper columns, and formulas that drive KPIs and charts.
Because of this design, the dashboard remains scalable and easy to maintain.
Click to Purchases Electricity Procurement Dashboard in Excel
Advantages of Electricity Procurement Dashboard in Excel
1. Centralized Procurement Visibility
The dashboard consolidates all electricity procurement data into one place. Therefore, teams avoid confusion and duplication.
2. Improved Cost Transparency
Users clearly see gross cost, net cost, and tax impact. As a result, hidden costs become visible.
3. Better Supplier Evaluation
Supplier-wise analysis helps identify high-cost utilities and supports negotiations.
4. Smarter Contract Decisions
Contract-type insights enable organizations to choose cost-effective agreements.
5. Energy Source Optimization
Energy source analysis supports renewable planning and sustainability goals.
6. Time-Saving and User-Friendly
Because the dashboard runs in Excel, users work in a familiar environment.
7. Data-Driven Decision Making
Visual insights support faster and more confident procurement decisions.
Best Practices for the Electricity Procurement Dashboard in Excel
1. Keep Data Accurate and Updated
Always maintain clean and validated procurement data. Accurate data ensures reliable insights.
2. Update the Dashboard Regularly
Update data monthly or as new procurement records become available.
3. Standardize Supplier and Contract Names
Consistent naming improves analysis accuracy and avoids duplication.
4. Monitor Tax Impact Closely
Track tax impact percentage to identify abnormal increases early.
5. Use Trends for Budgeting
Leverage monthly trends to support forecasting and budget planning.
6. Align with Sustainability Goals
Use energy source insights to increase renewable energy adoption.
7. Protect Dashboard Structure
Secure formulas and layouts to avoid accidental changes.
Click to Purchases Electricity Procurement Dashboard in Excel
ho Can Benefit from an Electricity Procurement Dashboard in Excel?
This dashboard supports multiple roles, including:
-
Electricity and energy managers
-
Procurement and sourcing teams
-
Finance and accounting professionals
-
Sustainability and ESG teams
-
Operations and plant managers
-
Senior management
Conclusion – Why the Electricity Procurement Dashboard in Excel Is a Must-Have Tool
Electricity procurement directly affects profitability, sustainability, and operational stability. Therefore, organizations must move away from manual tracking and adopt structured analysis.
The Electricity Procurement Dashboard in Excel delivers complete visibility, cost control, and actionable insights. It centralizes procurement data, highlights cost drivers, and supports better supplier and contract decisions.
If your organization wants transparency, efficiency, and smarter electricity procurement, this dashboard becomes an essential solution.
Frequently Asked Questions (FAQs)
What is an Electricity Procurement Dashboard in Excel?
It is a ready-to-use Excel template that tracks and analyzes electricity procurement cost, tax impact, suppliers, contracts, and energy sources.
Who should use this dashboard?
Energy managers, procurement teams, finance professionals, and operations leaders benefit the most.
Can I customize the dashboard?
Yes, because it is built in Excel, you can customize KPIs, charts, and layouts easily.
Does the dashboard support supplier analysis?
Yes, the Utility Supplier Analysis page compares cost and volume across suppliers.
Can it help with budgeting and forecasting?
Yes, the Monthly Trends page supports cost forecasting and budget planning.
Do I need advanced Excel skills to use it?
No, basic Excel knowledge is sufficient to use and update the dashboard.
Is this dashboard suitable for renewable energy analysis?
Yes, the Energy Source Analysis page supports energy mix and sustainability tracking.
Click to Purchases Electricity Procurement Dashboard in Excel
Visit our YouTube channel to learn step-by-step video tutorials