Managing electricity procurement without a structured performance system often leads to rising costs, missed savings opportunities, and unclear reporting. However, when organizations use a well-designed Electricity Procurement KPI Dashboard in Excel, they gain clarity, control, and confidence in decision-making. Therefore, businesses across manufacturing, utilities, facilities management, and infrastructure increasingly rely on Excel-based KPI dashboards to monitor procurement performance effectively.
In this in-depth article, you will learn everything about the Electricity Procurement KPI Dashboard in Excel. Moreover, you will understand its purpose, structure, worksheets, advantages, best practices, and real-world use cases. Additionally, this guide explains how Excel transforms complex electricity procurement data into clear, actionable insights without expensive BI tools.
Click to buy Electricity Procurement KPI Dashboard in Excel
What Is an Electricity Procurement KPI Dashboard in Excel?
An Electricity Procurement KPI Dashboard in Excel is a structured and interactive reporting tool designed to track, analyze, and monitor key performance indicators related to electricity purchasing and procurement activities.
Instead of managing scattered spreadsheets and manual calculations, this dashboard consolidates all procurement KPIs into one centralized Excel file. As a result, procurement teams gain instant visibility into costs, targets, trends, and performance gaps.
Because Excel supports formulas, pivot tables, charts, slicers, and conditional formatting, this dashboard delivers powerful insights while remaining easy to use. Furthermore, almost every organization already uses Excel, which makes this solution both practical and cost-effective.
Why Do Organizations Need an Electricity Procurement KPI Dashboard?
Electricity procurement involves complex decisions related to pricing, contracts, consumption, and supplier performance. Therefore, organizations need a clear system to measure performance consistently.
Here are the key reasons why organizations use an Electricity Procurement KPI Dashboard in Excel:
- It centralizes procurement data in one place
- It improves visibility into costs and consumption
- It supports data-driven decision-making
- It reduces manual reporting efforts
- It highlights savings opportunities quickly
Moreover, when procurement teams track KPIs regularly, they improve efficiency and reduce financial risks.
What Are the Key KPIs in Electricity Procurement?
Before building a dashboard, organizations must define the right KPIs. While KPIs vary by organization, most electricity procurement dashboards include the following indicators:
- Electricity Cost per Unit
- Total Electricity Procurement Cost
- Contracted vs Spot Purchase Ratio
- Budget vs Actual Electricity Spend
- Year-over-Year Cost Change
- Supplier Price Variance
- Consumption Variance
- Cost Savings Achieved
By tracking these KPIs, procurement teams can identify inefficiencies and improve negotiation strategies.
How Is the Electricity Procurement KPI Dashboard in Excel Structured?
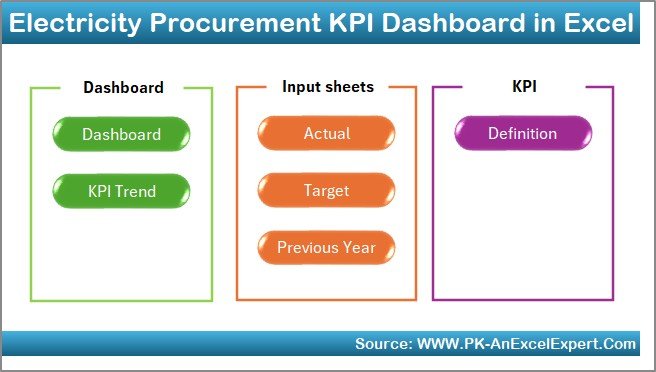
A well-designed dashboard follows a clear and logical structure. In this Electricity Procurement KPI Dashboard in Excel, we have created 7 structured worksheets. Each sheet plays a specific role and works together seamlessly.
Let us explore each worksheet in detail.
What Is the Purpose of the Summary Page?
Summary Page (Index Sheet)
The Summary Page acts as the navigation hub of the dashboard. It improves usability and saves time for users.
Key highlights of the Summary Page:
- It works as an index sheet
- It contains 6 navigation buttons
- Each button links directly to a specific worksheet
- It allows users to move across the dashboard quickly
As a result, even non-technical users can navigate the dashboard confidently.
Click to buy Electricity Procurement KPI Dashboard in Excel
How Does the Main Dashboard Sheet Work?
Dashboard Sheet Tab
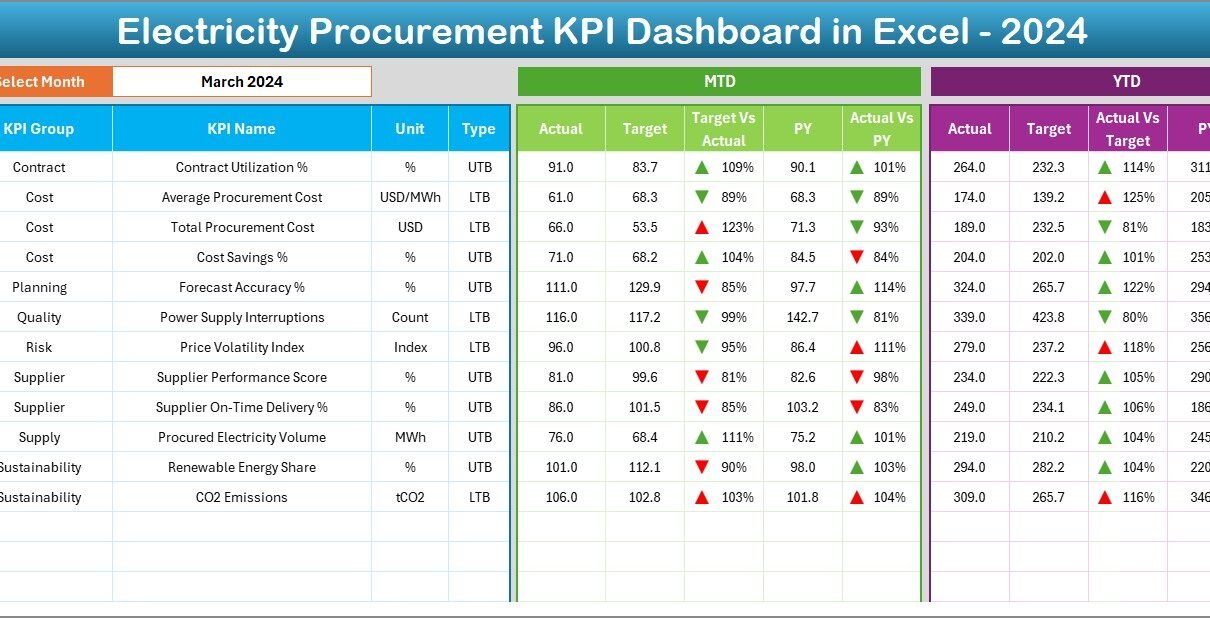
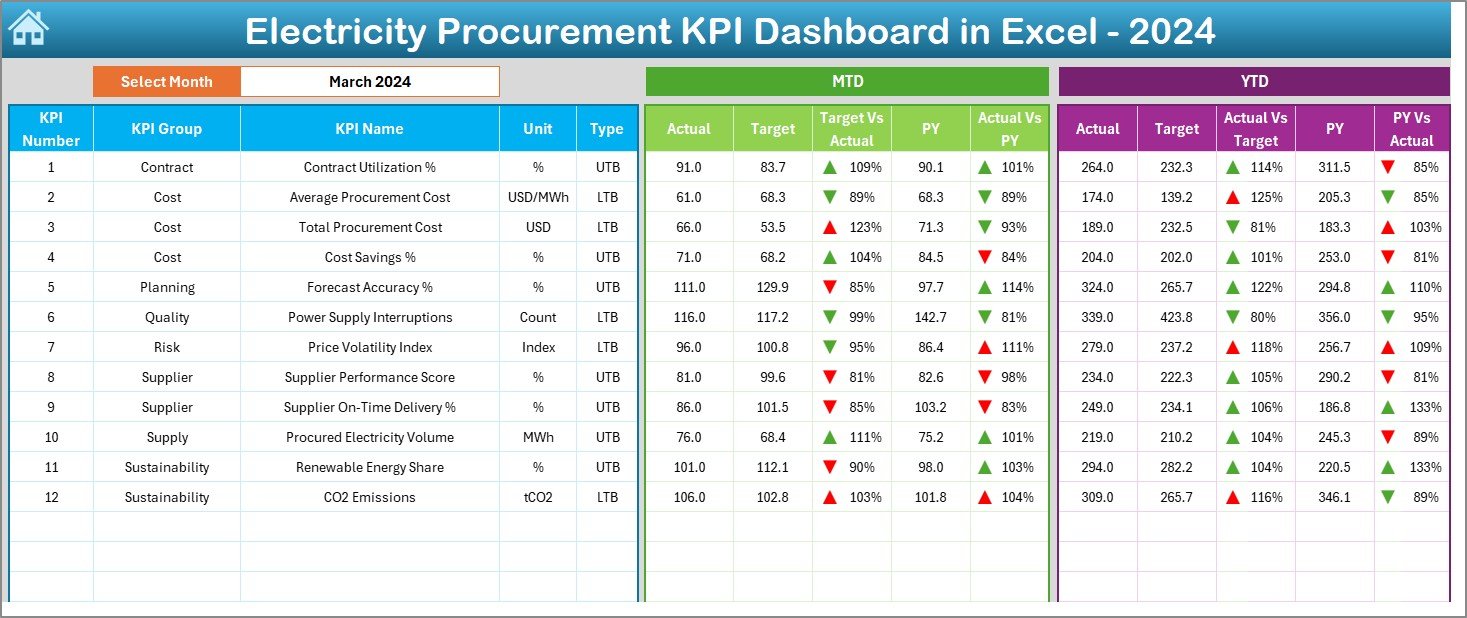
The Dashboard Sheet serves as the core of the Electricity Procurement KPI Dashboard in Excel. It displays all key KPIs in a visual and interactive format.
Key features of the Dashboard Sheet:
- Month selection dropdown at cell D3
- Dynamic KPI values based on selected month
- Clear comparison between Actual, Target, and Previous Year data
KPIs displayed on the Dashboard:
- MTD Actual
- MTD Target
- MTD Previous Year
- Target vs Actual variance
- Previous Year vs Actual variance
Moreover, the dashboard also shows YTD performance using the same structure.
Click to buy Electricity Procurement KPI Dashboard in Excel
Why Is Conditional Formatting Important Here?
Conditional formatting plays a vital role in the dashboard. Upward and downward arrows instantly indicate performance direction. Therefore, users can identify positive or negative trends at a glance.
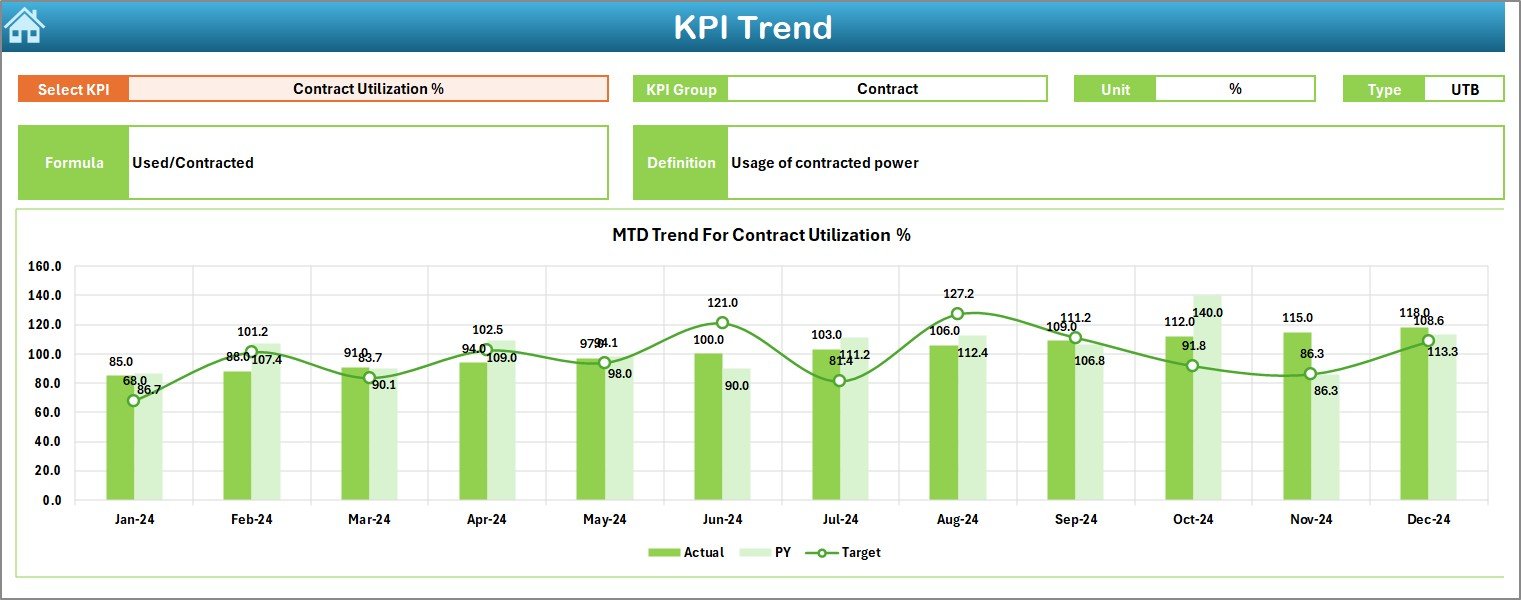
How Does the Trend Sheet Help in Analysis?
Trend Sheet Tab
The Trend Sheet focuses on detailed KPI-level analysis. It helps users understand how performance changes over time.
Key elements of the Trend Sheet:
- KPI selection dropdown at cell C3
- Display of KPI Group
- Unit of measurement
- KPI type (Upper the Better or Lower the Better)
- KPI formula
- KPI definition
Additionally, this sheet includes MTD and YTD trend charts for:
- Actual values
- Target values
- Previous Year values
Because of this structure, users can analyze trends visually and identify recurring issues or improvements.
Click to buy Electricity Procurement KPI Dashboard in Excel
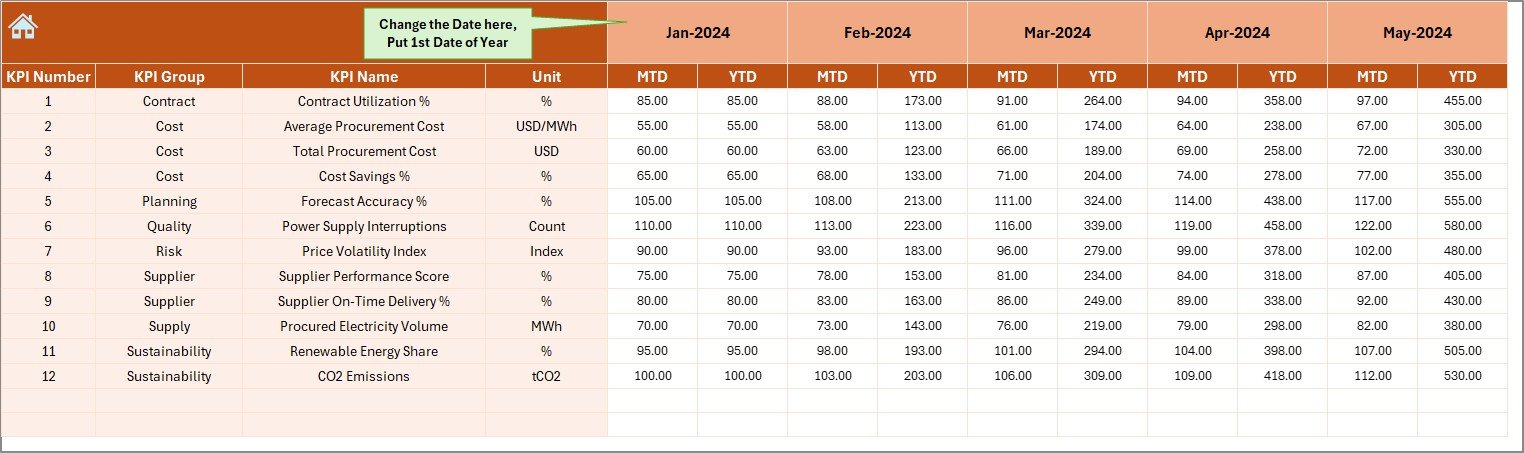
Where Do Users Enter Actual Procurement Data?
Actual Numbers Input Sheet
The Actual Numbers Input Sheet stores real procurement performance data. It ensures data consistency and accuracy.
How this sheet works:
- Users enter MTD and YTD actual numbers
- Month selection available at cell E1
- Users input the first month of the year in cell E1
- The dashboard updates automatically based on inputs
Therefore, data entry remains simple and structured.
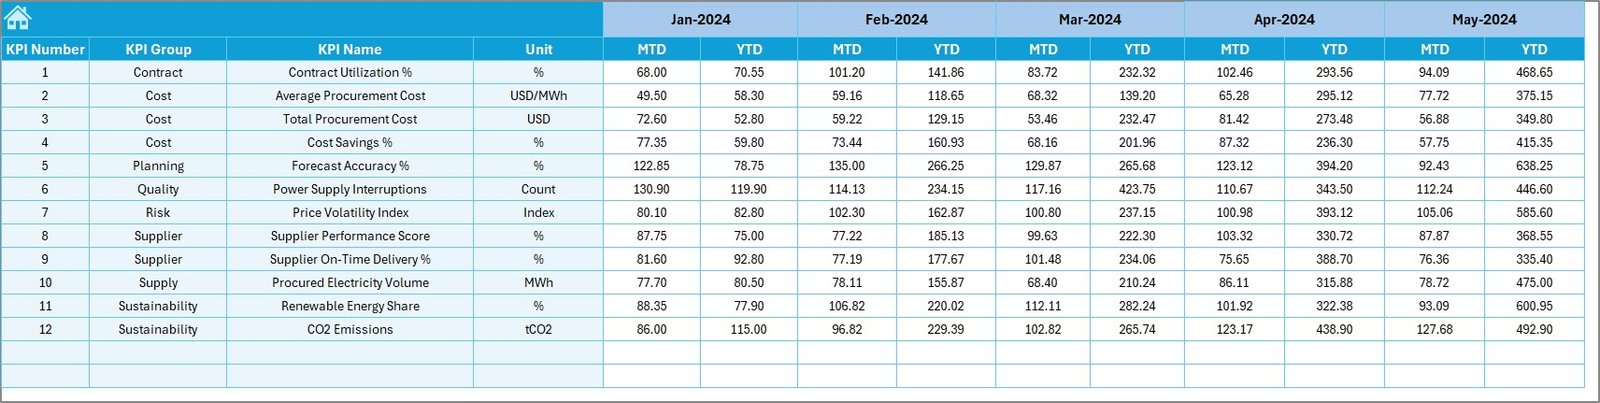
How Are Targets Managed in the Dashboard?
Click to buy Electricity Procurement KPI Dashboard in Excel
Target Sheet Tab
The Target Sheet defines performance expectations for each KPI.
Key functions of the Target Sheet:
- Users enter monthly MTD targets
- Users also enter cumulative YTD targets
- Targets remain consistent across the dashboard
By comparing actual values with targets, procurement teams can identify gaps and take corrective actions early.
Click to buy Electricity Procurement KPI Dashboard in Excel
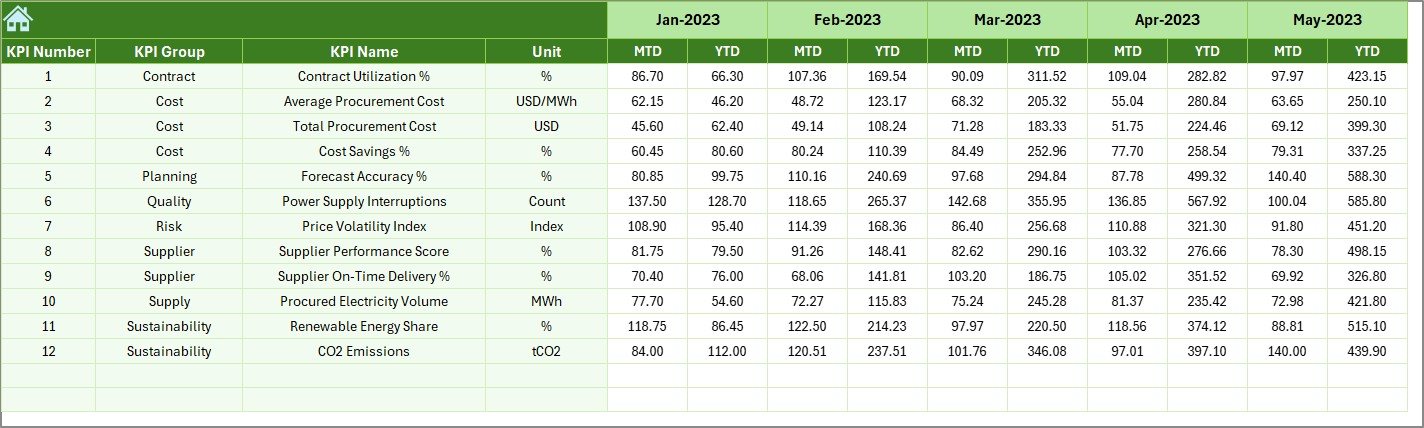
Why Is the Previous Year Sheet Important?
Previous Year Number Sheet Tab
The Previous Year Sheet enables historical comparison. It strengthens analysis by adding context.
Benefits of this sheet:
- Users enter previous year MTD and YTD values
- The dashboard automatically compares current performance with past performance
- Trends become more meaningful
As a result, organizations can understand long-term cost patterns and supplier behavior.
Click to buy Electricity Procurement KPI Dashboard in Excel
What Is the Role of the KPI Definition Sheet?
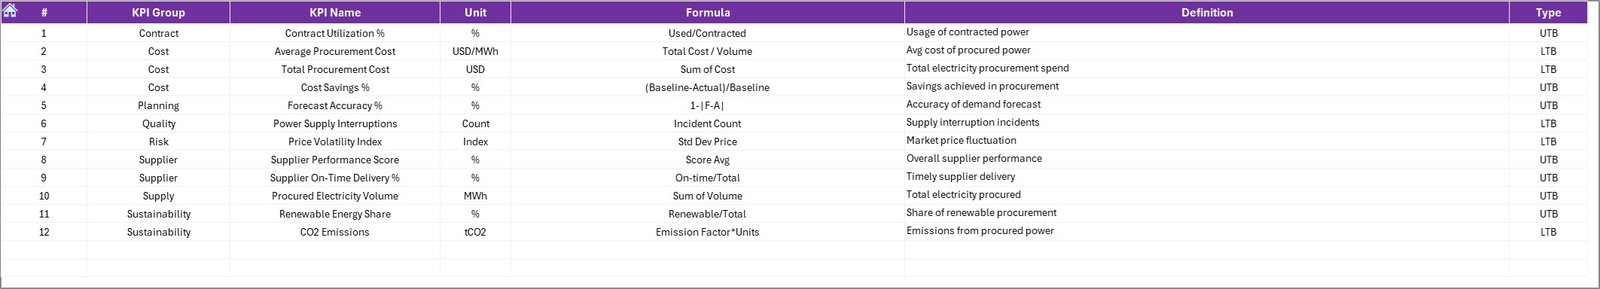
KPI Definition Sheet Tab
The KPI Definition Sheet acts as the knowledge base of the dashboard.
Information stored in this sheet:
- KPI Name
- KPI Group
- Unit of measurement
- KPI Formula
- KPI Definition
This sheet ensures clarity and consistency. Moreover, it helps new users understand KPIs without confusion.
Click to buy Electricity Procurement KPI Dashboard in Excel
Advantages of Electricity Procurement KPI Dashboard in Excel
Using an Electricity Procurement KPI Dashboard in Excel offers several practical benefits.
Key Advantages:
- Centralized Reporting – All KPIs remain in one Excel file
- Improved Cost Control – Teams track overspending instantly
- Better Decision-Making – Data-driven insights replace assumptions
- Time Savings – Automated calculations reduce manual work
- User-Friendly Design – Non-technical users adopt it easily
- No Additional Cost – No need for expensive BI tools
Because of these advantages, Excel dashboards remain a preferred choice for many organizations.
How Does This Dashboard Improve Procurement Efficiency?
The dashboard improves procurement efficiency by creating transparency. Moreover, it aligns procurement teams with financial goals.
Efficiency improvements include:
- Faster monthly and yearly reviews
- Early identification of cost overruns
- Clear supplier performance tracking
- Better contract negotiation support
Therefore, procurement teams move from reactive to proactive management.
Best Practices for the Electricity Procurement KPI Dashboard in Excel
To get maximum value, organizations should follow proven best practices.
Best Practices:
- Define KPIs clearly before building the dashboard
- Keep KPI formulas simple and transparent
- Update actual data regularly
- Review targets at least quarterly
- Use consistent units across all KPIs
- Avoid overloading the dashboard with too many KPIs
- Train users on how to interpret KPI trends
When teams follow these practices, the dashboard remains reliable and effective.
How Often Should You Update the Dashboard?
Most organizations update electricity procurement dashboards monthly. However, some high-energy-consuming industries prefer weekly updates.
Recommended update frequency:
- Monthly for strategic review
- Weekly for operational control
- Quarterly for target revisions
Consistency matters more than frequency. Therefore, choose a schedule and stick to it.
Who Can Use an Electricity Procurement KPI Dashboard?
This dashboard supports multiple stakeholders across the organization.
Key Users:
- Procurement managers
- Energy managers
- Finance teams
- Plant managers
- Senior leadership
Because Excel is widely used, collaboration becomes easier.
Real-World Use Cases of Electricity Procurement KPI Dashboards
Manufacturing Plants
Manufacturing units use dashboards to track electricity cost per unit and reduce production expenses.
Commercial Buildings
Facility managers monitor consumption trends and optimize contracts.
Utilities and Infrastructure Projects
Large projects use dashboards to control procurement budgets and improve supplier negotiations.
How Does Excel Compare with BI Tools for Procurement Dashboards?
Excel offers simplicity and flexibility. While BI tools provide advanced analytics, Excel remains ideal for small to mid-sized organizations.
Excel Strengths:
- Low cost
- Faster implementation
- Easy customization
- Familiar interface
Therefore, Excel dashboards remain highly relevant.
Conclusion: Why You Should Use an Electricity Procurement KPI Dashboard in Excel
An Electricity Procurement KPI Dashboard in Excel transforms complex procurement data into clear, actionable insights. It centralizes KPIs, improves cost control, and supports smarter decisions.
Moreover, its structured worksheets, visual trends, and automated comparisons make it a powerful yet simple solution. When organizations implement this dashboard with best practices, they improve procurement efficiency and reduce electricity costs consistently.
Frequently Asked Questions (FAQs)
What is an Electricity Procurement KPI Dashboard in Excel?
It is an Excel-based tool that tracks and analyzes key electricity procurement performance indicators in a structured and visual format.
Can small organizations use this dashboard?
Yes, small and mid-sized organizations benefit the most because Excel is affordable and easy to use.
How many KPIs should I include?
Ideally, include 10 to 15 well-defined KPIs to avoid clutter and confusion.
Does this dashboard require advanced Excel skills?
No, basic Excel knowledge is sufficient to use and maintain the dashboard.
How does this dashboard help in cost reduction?
It highlights cost overruns, inefficiencies, and savings opportunities early.
Can I customize KPIs in this dashboard?
Yes, the KPI Definition Sheet allows full customization based on business needs.
Is this dashboard suitable for monthly reporting?
Yes, it is ideal for MTD and YTD reporting and performance reviews.
Visit our YouTube channel to learn step-by-step video tutorials
Watch the step-by-step video tutorial: