Managing electricity purchasing activities without clear performance visibility often leads to cost overruns, missed savings opportunities, and weak supplier accountability. Because electricity procurement involves high-value contracts, volatile prices, regulatory pressure, and long-term commitments, organizations must track performance continuously and accurately.
Therefore, an Electricity Purchasing KPI Dashboard in Power BI becomes an essential analytical solution. This dashboard converts raw purchasing data into clear KPIs, visual indicators, and actionable insights. Instead of depending on scattered Excel sheets and manual reports, procurement teams gain a single, centralized performance view.
In this in-depth, SEO-friendly guide, you will learn what an Electricity Purchasing KPI Dashboard in Power BI is, how it works, its detailed page structure, KPI logic, Excel data design, advantages, best practices, and frequently asked questions. By the end, you will clearly understand how this dashboard strengthens control, transparency, and decision-making in electricity purchasing.
Click to buy Electricity Purchasing KPI Dashboard in Power BI
What Is an Electricity Purchasing KPI Dashboard in Power BI?
An Electricity Purchasing KPI Dashboard in Power BI is a ready-to-use analytical dashboard designed to monitor, analyze, and evaluate key performance indicators related to electricity procurement activities.
Instead of working with disconnected spreadsheets, this dashboard consolidates all purchasing KPIs into a single Power BI report. As a result, procurement managers can instantly evaluate whether purchasing targets meet expectations or miss benchmarks.
Moreover, this dashboard focuses on Month-to-Date (MTD) and Year-to-Date (YTD) performance, which ensures timely tracking and early corrective action. Because electricity prices fluctuate frequently, this structured KPI tracking becomes critical for cost control.
Why Do Organizations Need an Electricity Purchasing KPI Dashboard?
Electricity purchasing decisions directly impact operational costs, profitability, and compliance. However, without real-time performance monitoring, procurement teams struggle to identify issues early.
An Electricity Purchasing KPI Dashboard in Power BI helps because it:
- Centralizes all purchasing KPIs in one place
- Improves visibility into cost, efficiency, and supplier performance
- Enables quick comparison between actuals and targets
- Supports strategic and operational decision-making
Therefore, organizations that rely on electricity procurement—utilities, manufacturing plants, data centers, EPC companies, and infrastructure projects—benefit significantly from this dashboard.
How Does the Electricity Purchasing KPI Dashboard in Power BI Work?
This dashboard uses Excel as the data source and Power BI as the analytics and visualization layer. Because Excel remains familiar to most users, data entry stays simple. Meanwhile, Power BI handles calculations, comparisons, and visuals automatically.
The workflow follows a clear structure:
- Users update actual and target values in Excel
- Power BI refreshes the data
- KPIs update automatically
- Visual indicators highlight performance status
As a result, the dashboard remains dynamic, scalable, and easy to maintain.
Page Structure of Electricity Purchasing KPI Dashboard in Power BI
This dashboard includes three well-structured pages, each designed for a specific analytical purpose.
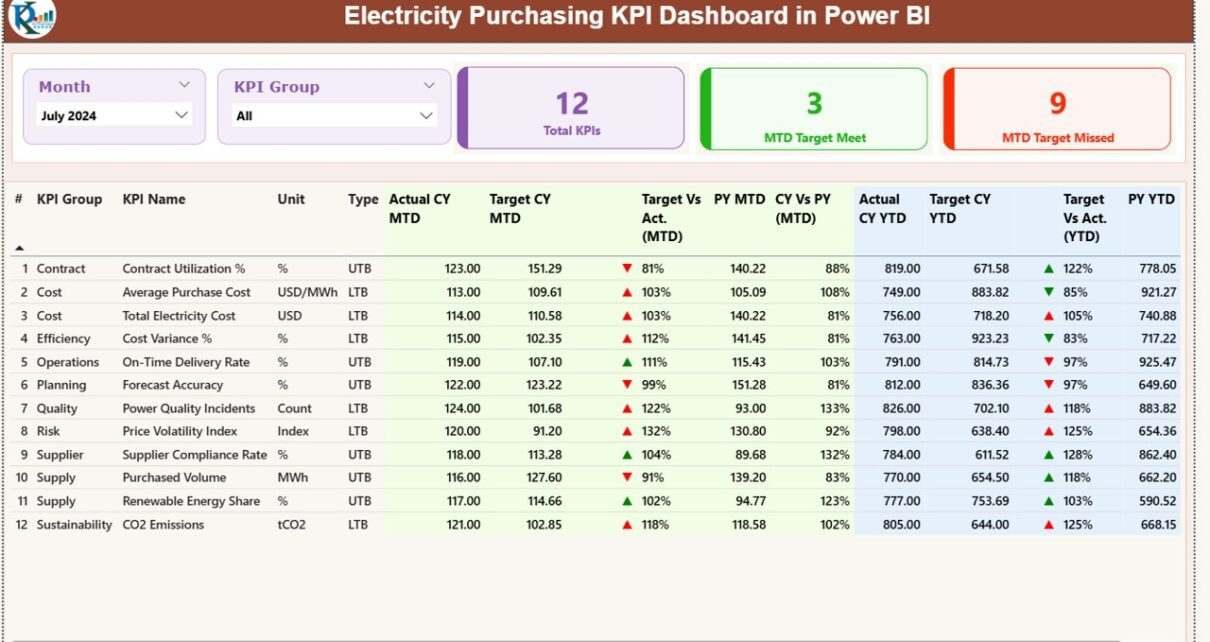
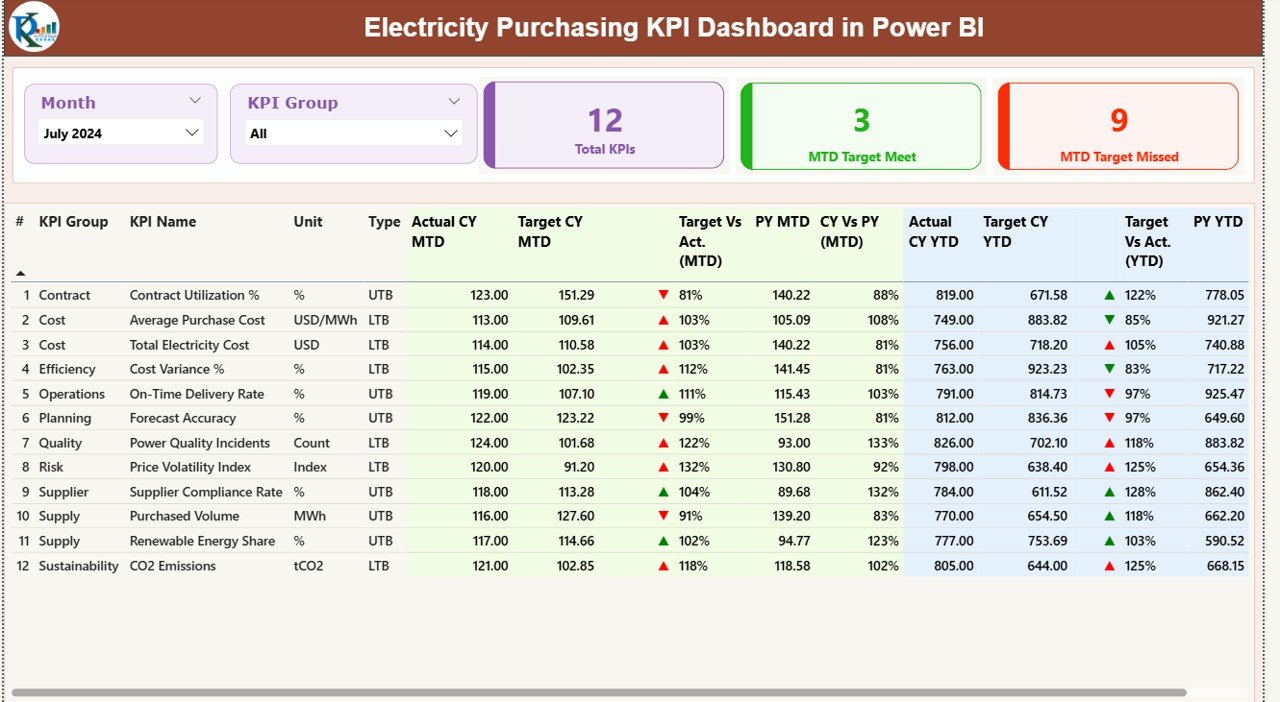
Summary Page
The Summary Page acts as the main control center of the dashboard. It provides a consolidated overview of all electricity purchasing KPIs.
Key Elements of the Summary Page
Slicers for Quick Filtering
At the top of the page, you will find:
- Month slicer – to analyze performance by reporting month
- KPI Group slicer – to focus on specific KPI categories
These slicers ensure fast, focused analysis without clutter.
KPI Cards for Instant Status
The Summary Page displays three KPI cards:
- Total KPIs Count
- MTD Target Meet Count
- MTD Target Missed Count
These cards immediately communicate overall performance health.
Detailed KPI Performance Table
Below the cards, a detailed table presents complete KPI metrics:
- KPI Number – Unique sequence number
- KPI Group – Category of the KPI
- KPI Name – Name of the purchasing KPI
- Unit – Unit of measurement
- Type – LTB (Lower the Better) or UTB (Upper the Better)
How Are MTD KPIs Displayed?
The dashboard highlights Month-to-Date performance using clear indicators:
- Actual CY MTD – Actual current year MTD value
- Target CY MTD – Target current year MTD value
- MTD Icon –
▲ Green arrow for target met
▼ Red arrow for target missed
Target vs Actual (MTD)
- Calculated using:
Actual MTD ÷ Target MTD
PY MTD
- Previous year MTD value for the same period
CY vs PY (MTD)
- Calculated using:
Current Year MTD ÷ Previous Year MTD
Because of these metrics, users can instantly detect improvement or decline.
How Are YTD KPIs Displayed?
Year-to-Date performance follows the same clear logic:
- Actual CY YTD – Actual current year YTD value
- Target CY YTD – Target current year YTD value
- YTD Icon – Green or red arrows for quick status
Target vs Actual (YTD)
- Formula:
Actual YTD ÷ Target YTD
PY YTD
- Previous year YTD value
CY vs PY (YTD)
- Formula:
Current Year YTD ÷ Previous Year YTD
Thus, procurement teams can evaluate long-term performance alongside short-term results.
Click to buy Electricity Purchasing KPI Dashboard in Power BI
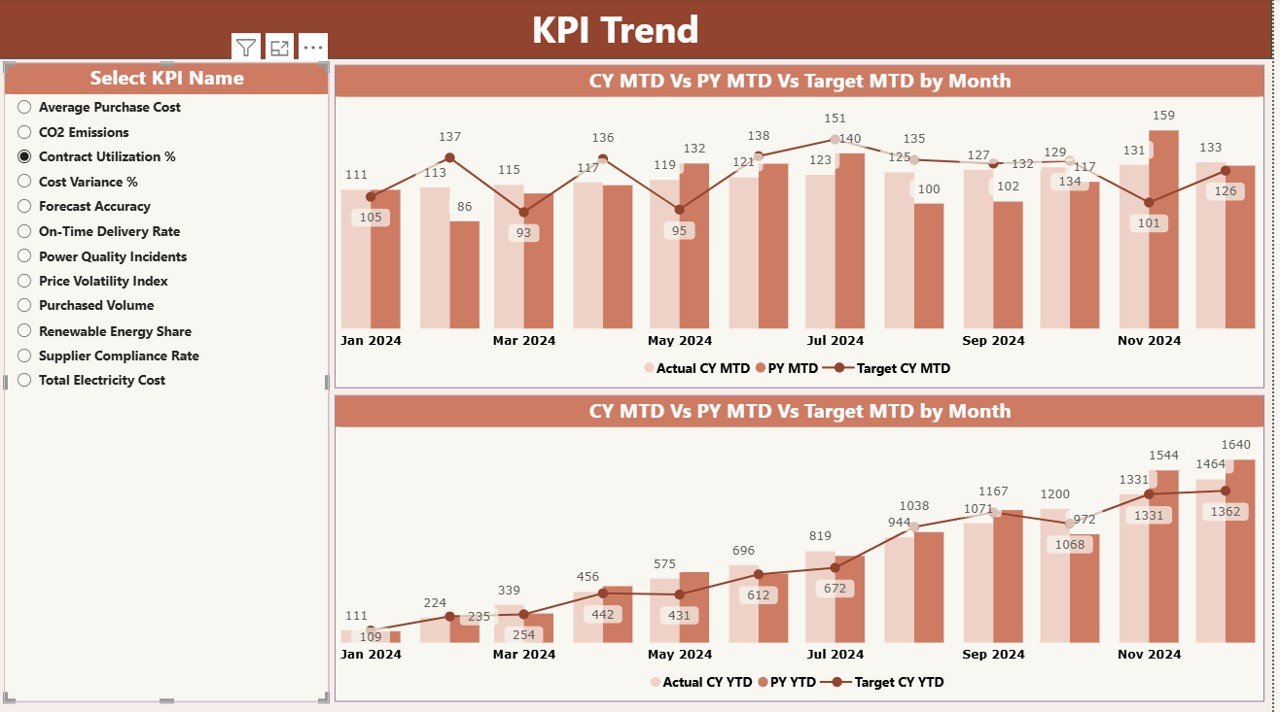
KPI Trend Page
The KPI Trend Page focuses on performance patterns over time.
- Key Features of the KPI Trend Page
Two combo charts:
One for MTD trends
One for YTD trends
Each chart compares:
Current Year Actual
Previous Year Actual
Target values
A KPI Name slicer on the left allows users to select a specific KPI. As a result, trends update instantly.
Because trend analysis reveals patterns, this page helps teams identify seasonality, inefficiencies, and improvement opportunities.
Click to buy Electricity Purchasing KPI Dashboard in Power BI
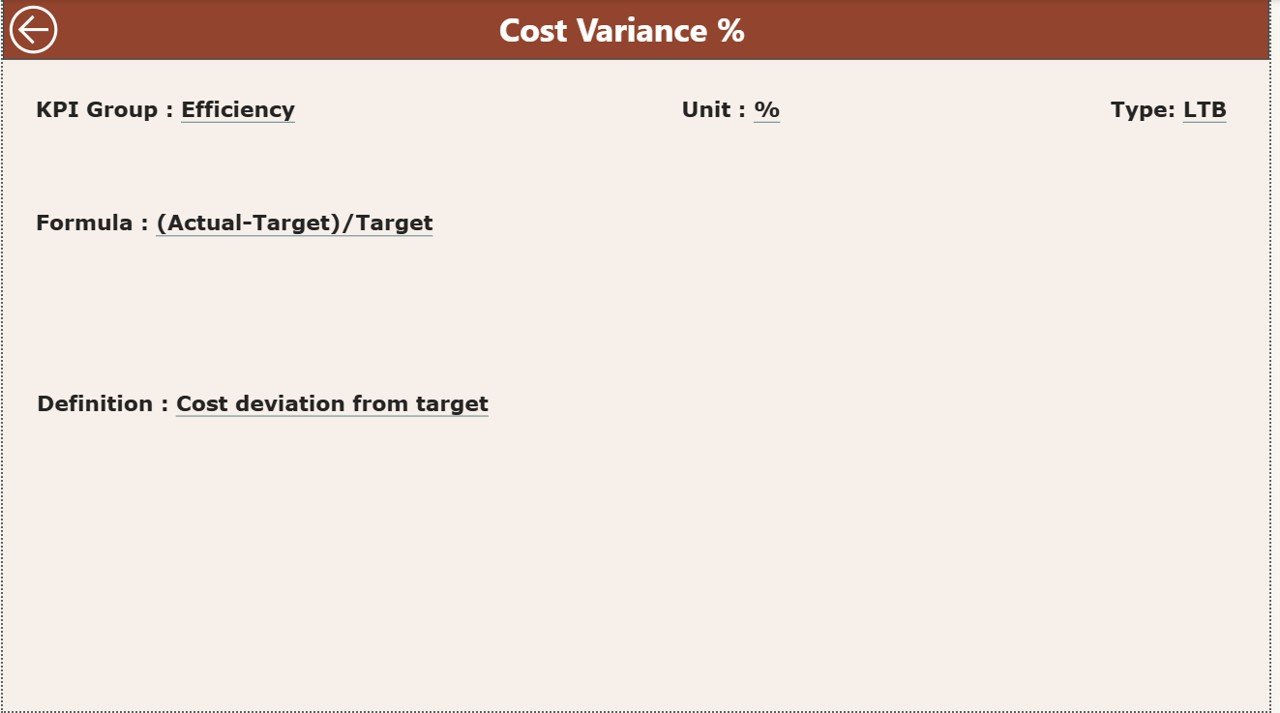
KPI Definition Page
The KPI Definition Page is a hidden drill-through page designed for detailed understanding.
What Does the KPI Definition Page Show?
- KPI Formula
- KPI Definition
- KPI Purpose
- KPI Type (LTB or UTB)
Users can drill through from the Summary Page to view this information. After reviewing, they can return to the main page using the Back button at the top left corner.
This feature ensures clarity, consistency, and transparency across teams.
Click to buy Electricity Purchasing KPI Dashboard in Power BI
Excel Data Structure Used in the Dashboard
The dashboard relies on a structured Excel file with three worksheets.
Input_Actual Sheet
This sheet captures actual electricity purchasing performance.
You need to enter:
- KPI Name
- Month (first date of the month)
- MTD Actual Value
- YTD Actual Value
Because Power BI reads this data directly, accuracy matters.
Input_Target Sheet
This sheet stores target benchmarks.
You need to enter:
- KPI Name
- Month (first date of the month)
- MTD Target Value
- YTD Target Value
Targets drive performance evaluation, so consistency remains essential.
KPI Definition Sheet
This sheet defines KPI metadata:
- KPI Number
- KPI Group
- KPI Name
- Unit
- Formula
- Definition
- Type (LTB or UTB)
This structured definition ensures everyone measures KPIs the same way.
Advantages of Electricity Purchasing KPI Dashboard in Power BI
Implementing this dashboard delivers multiple operational and strategic benefits.
- Centralized Performance Visibility
Instead of tracking multiple files, teams access one dashboard. Therefore, confusion and duplication disappear.
- Faster Decision-Making
Because KPIs update automatically, decision-makers act quickly and confidently.
- Clear Target Accountability
Visual indicators highlight misses instantly. As a result, teams take corrective action sooner.
- Improved Cost Control
By monitoring purchasing efficiency closely, organizations reduce unnecessary spending.
- Historical Performance Comparison
CY vs PY analysis helps measure progress and long-term improvement.
- Easy Scalability
Because Excel feeds the dashboard, adding new KPIs or months stays simple.
Best Practices for the Electricity Purchasing KPI Dashboard in Power BI
To maximize dashboard value, follow these proven best practices.
- Maintain Clean Excel Data
Always validate Excel inputs. Clean data ensures accurate KPIs.
- Standardize KPI Definitions
Keep KPI definitions consistent across departments. This avoids confusion.
- Review KPIs Monthly
Schedule monthly reviews to catch issues early.
- Use LTB and UTB Correctly
Define KPI direction clearly to avoid misleading indicators.
- Train Users on Drill-Through Features
Encourage users to explore KPI definitions for better understanding.
- Refresh Data Regularly
Refresh Power BI data after every Excel update to maintain accuracy.
Who Can Use an Electricity Purchasing KPI Dashboard in Power BI?
This dashboard suits multiple roles and industries:
- Electricity procurement teams
- Utility companies
- Manufacturing plants
- EPC contractors
- Energy managers
- Finance and cost control teams
Because the dashboard uses simple visuals, both technical and non-technical users can benefit.
Conclusion: Why the Electricity Purchasing KPI Dashboard in Power BI Matters
Electricity purchasing demands precision, visibility, and proactive control. Without structured KPI tracking, organizations risk overspending and inefficiency. However, an Electricity Purchasing KPI Dashboard in Power BI transforms raw procurement data into actionable insights.
By combining Excel data entry with Power BI analytics, this dashboard delivers clarity, accountability, and confidence. Moreover, its structured pages, visual indicators, and trend analysis empower teams to make smarter purchasing decisions every month.
Frequently Asked Questions About Electricity Purchasing KPI Dashboard in Power BI
What is the main purpose of an Electricity Purchasing KPI Dashboard in Power BI?
The main purpose is to track, analyze, and improve electricity purchasing performance using structured KPIs.
Can non-technical users operate this dashboard?
Yes. Because the dashboard uses Excel for data input and simple visuals, non-technical users can easily use it.
How often should data be updated?
You should update data monthly or whenever new purchasing data becomes available.
Can new KPIs be added later?
Yes. You can add new KPIs by updating the Excel sheets and refreshing Power BI.
Does this dashboard support historical comparison?
Yes. It supports both MTD and YTD comparisons, including Current Year vs Previous Year analysis.
Is this dashboard suitable for large organizations?
Yes. Because Power BI scales easily, both small teams and large enterprises can use it effectively.
Visit our YouTube channel to learn step-by-step video tutorials
Watch the step-by-step video tutorial:
Click to buy Electricity Purchasing KPI Dashboard in Power BI