Managing employee leaves efficiently is one of the most important tasks for any HR department. A well-structured Employee Leave Report in Excel helps organizations track attendance, manage payroll, and ensure transparency across all departments. It also empowers managers to make informed decisions about staffing and productivity.
This article explains how to use and customize the Employee Leave Report in Excel, highlights its key features, shows how to analyze leave trends, and offers best practices to keep your HR reporting consistent and insightful.
Click to Purchases Employee Leave Report in Excel
What Is an Employee Leave Report in Excel?
An Employee Leave Report in Excel is a structured and automated spreadsheet designed to record, track, and analyze employee leaves across an organization. It allows HR professionals to monitor leave patterns, balance leave requests, and ensure compliance with company policies.
Instead of managing attendance manually or using expensive software, Excel offers a cost-effective, flexible, and easy-to-update solution. It provides everything HR teams need — from data entry forms to visual analytics — without requiring coding or technical expertise.
Key Components of the Employee Leave Report Template
The Employee Leave Report in Excel template consists of three core sheets and one support sheet. Each sheet has a specific purpose and works together to give you a full view of your leave management system.
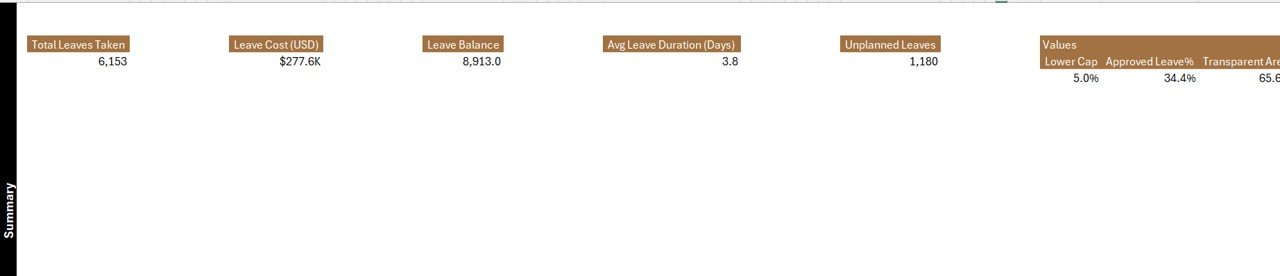
Summary Page
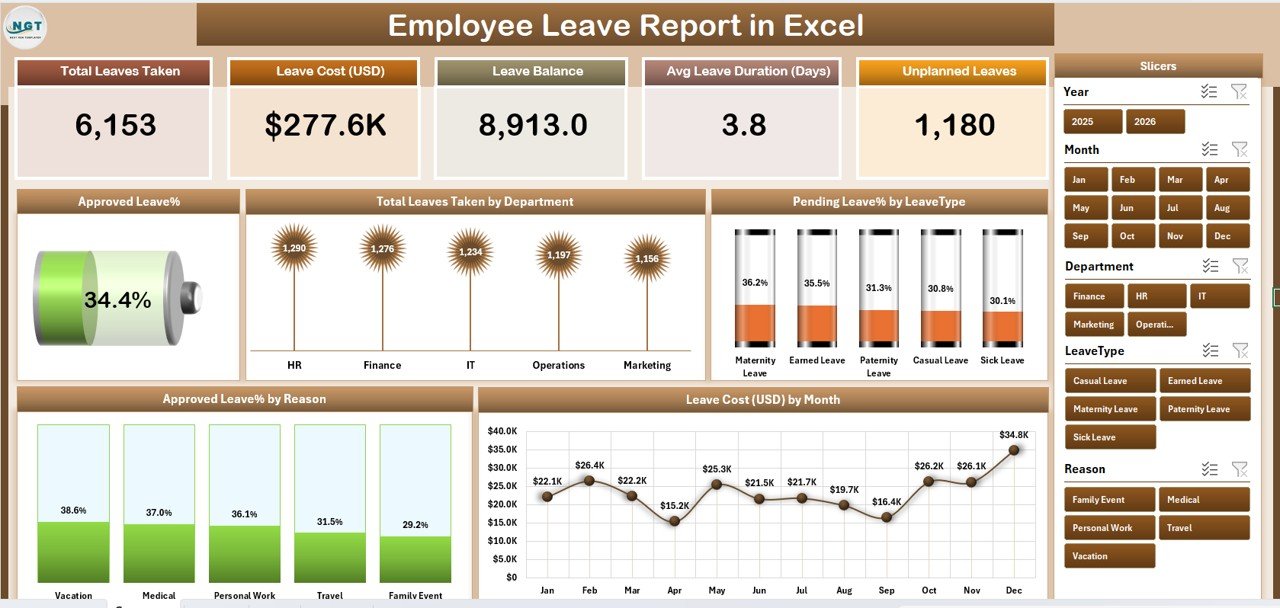
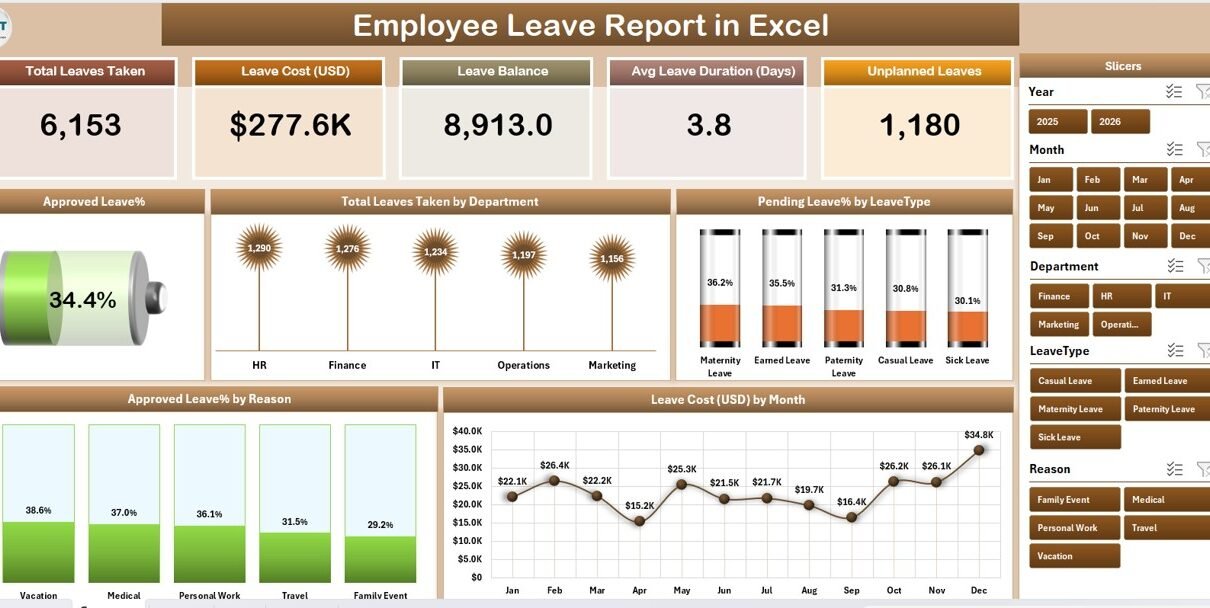
This is the main dashboard of the report. It presents an overall view of leave statistics and trends in a clear, visual format.
Key elements on this page include:
Five KPI Cards:
- Total Employees
- Total Leaves Taken
- Approved Leave %
- Pending Leave %
- Leave Cost (USD)
-
Slicers for Dynamic Filtering:
Located on the right-hand side, these slicers allow users to filter data by Month, Department, or Leave Type instantly.
Interactive Charts:
The dashboard displays five major charts:
Click to Purchases Employee Leave Report in Excel
- Approved Leave % – Shows the ratio of approved leaves compared to total requests.
- Total Leaves Taken by Department – Highlights which departments have higher leave usage.
- Pending Leave % by Leave Type – Tracks approval status by leave category.
- Approved Leave % by Reason – Analyzes leave distribution across different reasons (sick, vacation, personal, etc.).
- Leave Cost (USD) by Month – Displays the financial impact of employee leaves over time.
This page allows HR leaders and management to analyze patterns at a glance and identify problem areas like frequent absenteeism or high-cost periods.
Report Page
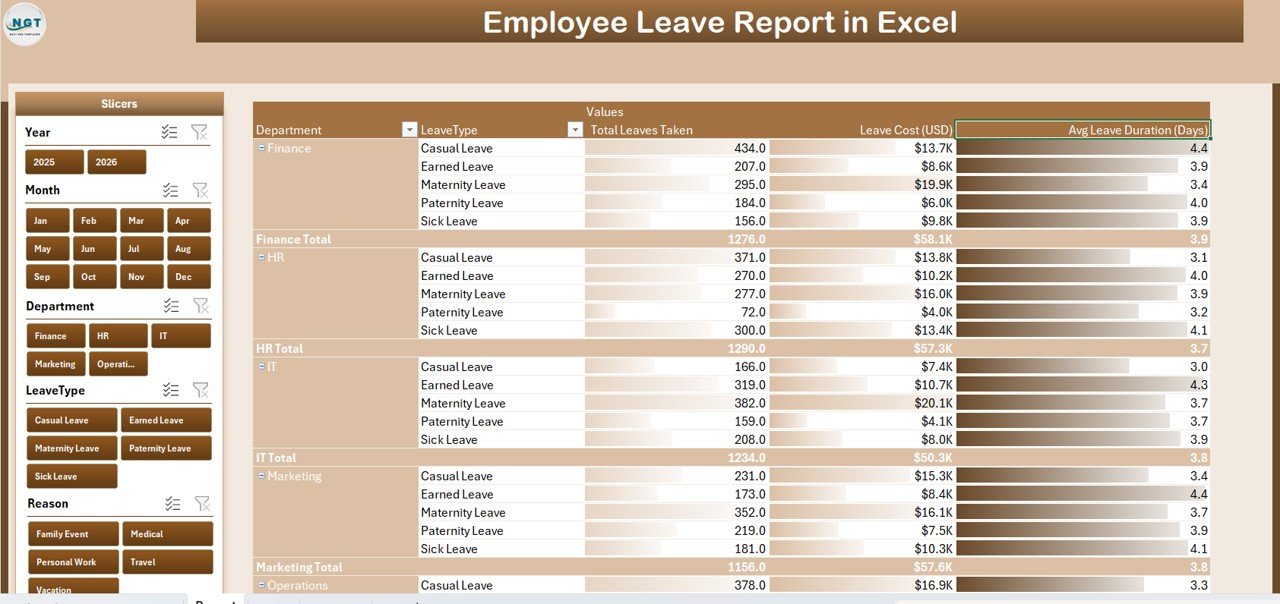
The Report page is where detailed data visualization and filtering happen.
-
Left-side Slicers:
These slicers help users select parameters such as Employee Name, Department, Leave Type, or Status.
Once the filters are applied, the report table dynamically updates to show only relevant records.
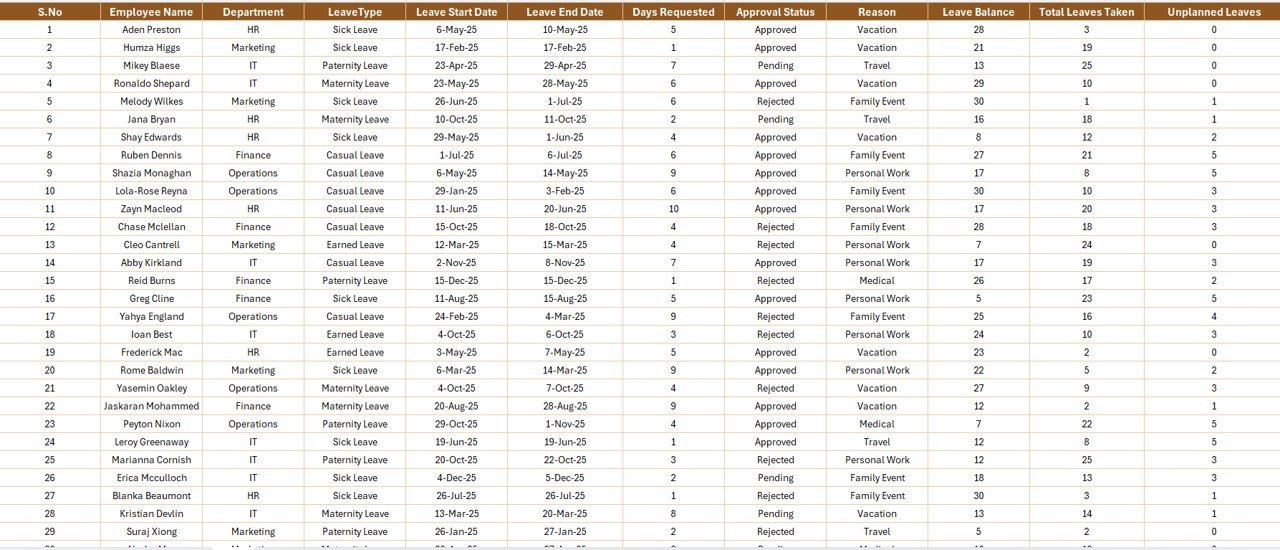
Comprehensive Information Table:
The table presents critical information like:
- Employee Name
- Department
- Leave Type
- Start Date
- End Date
- Duration (in Days)
- Leave Status (Approved/Pending/Rejected)
- Reason for Leave
- Leave Cost (if applicable)
This structured view gives HR professionals an instant snapshot of leave distribution and approval stages, supporting better decision-making.
Data Sheet
The Data Sheet is the foundation of the entire report. It stores all raw data used to feed charts, KPIs, and reports.
Columns typically include:
| Employee ID | Name | Department | Leave Type | Start Date | End Date | Total Days | Status | Reason | Leave Cost (USD) |
Users can manually update this data or connect it to an automated attendance system or HR database.
Maintaining this sheet regularly ensures that all visual dashboards and calculations stay accurate and up to date.
Support Sheet
The Support Sheet contains the predefined lists used in dropdowns and slicers — such as departments, leave types, and status options.
For example:
-
Departments: HR, Finance, Marketing, IT, Operations, Sales
-
Leave Types: Sick Leave, Annual Leave, Casual Leave, Maternity Leave, Paternity Leave
-
Statuses: Approved, Pending, Rejected
This structured setup reduces data-entry errors and ensures consistency throughout the workbook.
How to Use the Employee Leave Report in Excel
Here’s a simple step-by-step guide to start using the Employee Leave Report template effectively:
-
Download and Open the Template:
Start with a pre-designed Excel template. -
Go to the Data Sheet:
Enter or import your employee leave details. Make sure date formats and departments are consistent. -
Navigate to the Report Page:
Use the slicers to analyze specific departments, leave types, or approval statuses. -
View the Summary Dashboard:
Check real-time metrics and trends with the prebuilt KPI cards and charts. -
Update Data Regularly:
Keep your data sheet current for the dashboard visuals to stay accurate.
With these steps, any HR manager can manage employee leave information effortlessly without relying on complex systems.
Click to Purchases Employee Leave Report in Excel
Why Use Excel for Leave Reporting?
Excel is one of the most powerful and flexible tools available for HR and workforce analysis. When used properly, it can deliver the same level of insight as many paid HR software tools.
Here’s why Excel stands out:
✅ User-Friendly Interface: No advanced training required.
✅ Customizable Dashboards: Add, remove, or modify charts easily.
✅ Cost-Effective Solution: No subscription or software costs.
✅ Seamless Integration: Import/export data from other HR tools or databases.
✅ Visual Insights: Turn data into meaningful charts and comparisons instantly.
Benefits of Using an Employee Leave Report in Excel
Implementing a structured leave report offers multiple benefits across departments.
1. Improved Leave Tracking
The template helps you track every leave request, approval, and rejection in one place.
2. Enhanced Decision-Making
Visual analytics make it easier to identify high absenteeism periods or overworked departments.
3. Streamlined Payroll Management
Leave cost calculations ensure accurate salary deductions or compensations.
4. Compliance and Transparency
Maintaining proper leave records ensures compliance with labor laws and builds employee trust.
5. Time Savings
Automated calculations and filters minimize manual work and reduce errors.
Advantages of Employee Leave Report in Excel
The Employee Leave Report in Excel offers several strategic advantages that make HR management simpler and more efficient.
-
Centralized Data Management: Keep all employee leave records in one file.
-
Instant Filtering: Use slicers to find any employee’s leave history in seconds.
-
Clear Visualization: Charts make leave patterns easy to understand.
-
Flexible Reporting: Add new KPIs or modify existing charts as needed.
-
Actionable Insights: Identify frequent absences, peak leave months, or cost-heavy departments instantly.
-
Ease of Sharing: Excel files can be shared via email, cloud, or Teams easily.
These advantages make Excel an ideal solution for small to medium-sized organizations that need clarity without the cost of enterprise software.
Customization Tips for Better HR Insights
Every organization has unique leave policies and structures. Excel’s flexibility allows you to tailor this report to meet your company’s specific requirements.
Some customization ideas:
-
Add a “Leave Balance” column to track remaining days per employee.
-
Include a “Manager Approval Date” for process tracking.
-
Use conditional formatting to highlight overdue or pending approvals.
-
Add Department-wise filters for faster review.
-
Incorporate Year and Month drop-downs for time-based analysis.
Example Use Cases
Let’s see how different teams benefit from using the Employee Leave Report in Excel:
-
HR Department: Tracks attendance trends, pending approvals, and policy violations.
-
Finance Department: Monitors leave-related cost implications.
-
Department Heads: Analyze team availability during critical projects.
-
Management: Identify workforce utilization and plan resource allocation.
By consolidating all this information, Excel turns raw leave data into actionable business intelligence.
Best Practices for the Employee Leave Report in Excel
To get the most out of your Employee Leave Report, follow these practical tips:
-
Keep Data Updated:
Refresh the Data Sheet weekly or monthly to maintain report accuracy. -
Use Consistent Naming Conventions:
Ensure department names, employee IDs, and leave types are standardized. -
Apply Data Validation:
Use dropdown lists in the Data Sheet to prevent incorrect entries. -
Secure Sensitive Data:
Protect sheets containing salary or employee details with passwords. -
Leverage Conditional Formatting:
Use color indicators for pending or high-frequency leave cases. -
Review Trends Monthly:
Analyze charts regularly to detect unusual patterns or compliance risks. -
Backup Regularly:
Save copies or store them in a shared cloud environment to avoid data loss. -
Automate Repetitive Tasks:
Use Excel formulas and pivot tables to calculate leave days or costs automatically.
Tips for Analysis and Reporting
Once your leave data is complete, you can gain deep insights by using Excel’s analytical tools.
-
Pivot Tables: Summarize data by department, leave type, or month.
-
Slicers: Create interactive filters for dynamic analysis.
-
Conditional Formatting: Highlight frequent absentees.
-
Line Charts: Track leave trends month by month.
-
Pie Charts: Show distribution by reason or leave type.
With these tools, HR teams can easily interpret data and present insights to management.
Conclusion
The Employee Leave Report in Excel is a must-have HR tool for organizations aiming to manage workforce attendance efficiently. It provides clarity, consistency, and insight — all within a simple Excel file.
From real-time dashboards to in-depth analytics, this template helps HR professionals monitor leaves, manage costs, and maintain compliance without investing in expensive software.
By following best practices and keeping data up to date, your organization can transform leave tracking into a strategic advantage that boosts productivity and transparency.
Frequently Asked Questions (FAQs)
1. What is the purpose of an Employee Leave Report in Excel?
It helps HR professionals track, analyze, and report employee leaves effectively using simple Excel tools.
2. Can this template be customized for different leave types?
Yes. You can easily modify dropdown lists and formulas to include various leave types such as sick, casual, or maternity leaves.
3. Does this report calculate leave costs automatically?
If you input the cost per leave day in the Data Sheet, the report automatically calculates total leave cost using Excel formulas.
4. How often should the report be updated?
It’s best to update it weekly or monthly to ensure accurate data and real-time insights.
5. Can I connect this Excel report to other HR systems?
Yes. You can link it to attendance trackers, payroll files, or databases using Power Query or data import functions.
6. Is this template suitable for small businesses?
Absolutely! It’s designed to be scalable — small companies can use it for basic reporting, while larger teams can expand it with additional data.
7. How can I share this report with management?
You can export it as a PDF or share it via cloud platforms like OneDrive, Google Drive, or Microsoft Teams.
Visit our YouTube channel to learn step-by-step video tutorials