Monitoring employee training effectiveness is crucial for organizations to ensure skill development, knowledge retention, and organizational growth. The Employee Training Effectiveness Dashboard in Power BI provides a ready-to-use solution to track training performance, evaluate learning impact, and measure trainer effectiveness.
In this article, we will explain the features, advantages, and best practices of using this dashboard for organizational training programs.
What Is an Employee Training Effectiveness Dashboard?
An Employee Training Effectiveness Dashboard is a data visualization tool that consolidates training metrics in one interactive platform. It allows HR teams, L&D managers, and executives to monitor:
-
Total trainings conducted
-
Pre- and post-training performance
-
Feedback and satisfaction scores
-
Certification completion
-
Departmental and trainer performance
Power BI makes it easy to analyze training data with interactive charts, cards, slicers, and decomposition views to improve learning outcomes and ROI.
Key Features of the Dashboard
Click to Buy Employee Training Effectiveness Dashboard in Power BI
The Employee Training Effectiveness Dashboard in Power BI includes multiple pages and visualizations for a comprehensive overview:
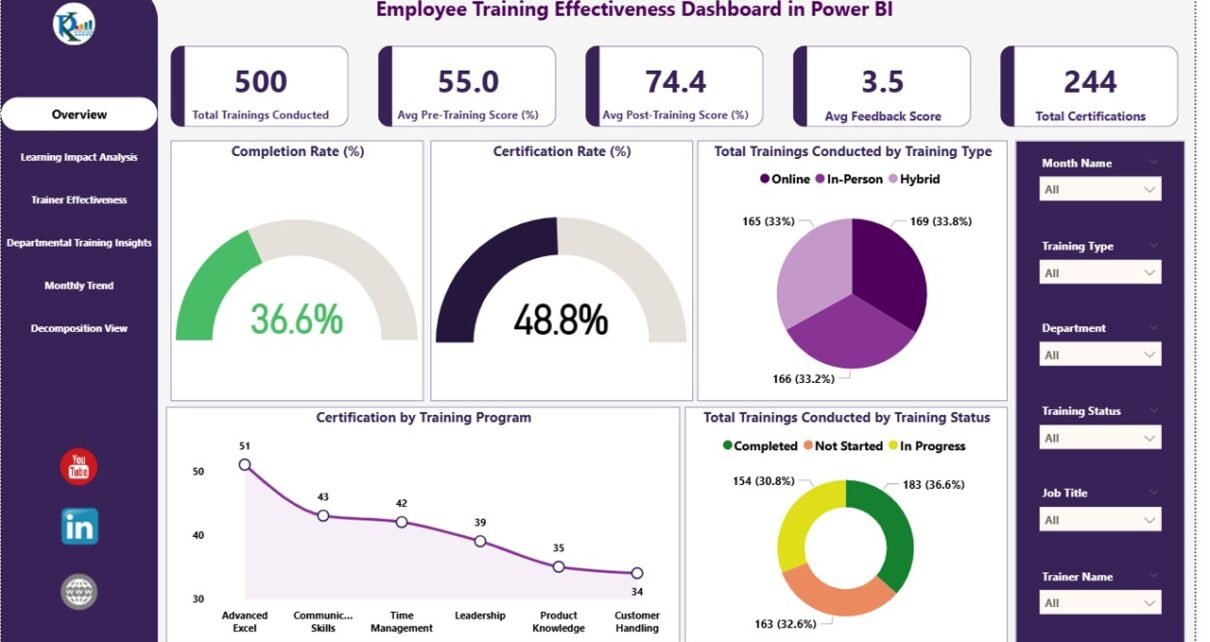
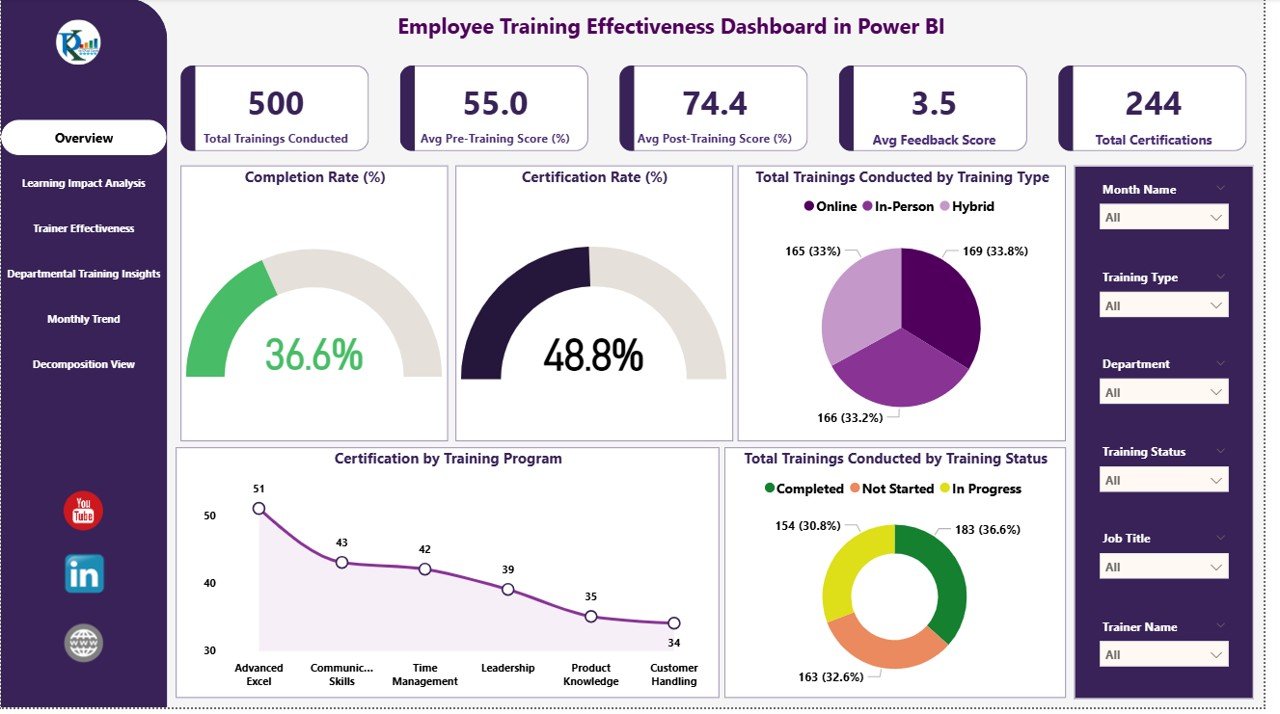
1. Dashboard Overview Page
Cards:
-
Total Trainings Conducted – Number of trainings completed
-
Avg. Feedback Score – Average rating from participants
-
Avg. Post-Training Score (%) – Knowledge gained after training
-
Avg. Pre-Training Score (%) – Baseline performance before training
-
Total Certifications – Total certifications awarded
Charts:
-
Completion Rate (%) – Percentage of employees completing the training
-
Certification Rate (%) – Success rate of certifications
-
Total Trainings by Training Type – Categorization of training programs
-
Total Trainings by Status – In-progress vs completed trainings
-
Certification by Training Program – Visualize certifications per program
Click to Buy Employee Training Effectiveness Dashboard in Power BI
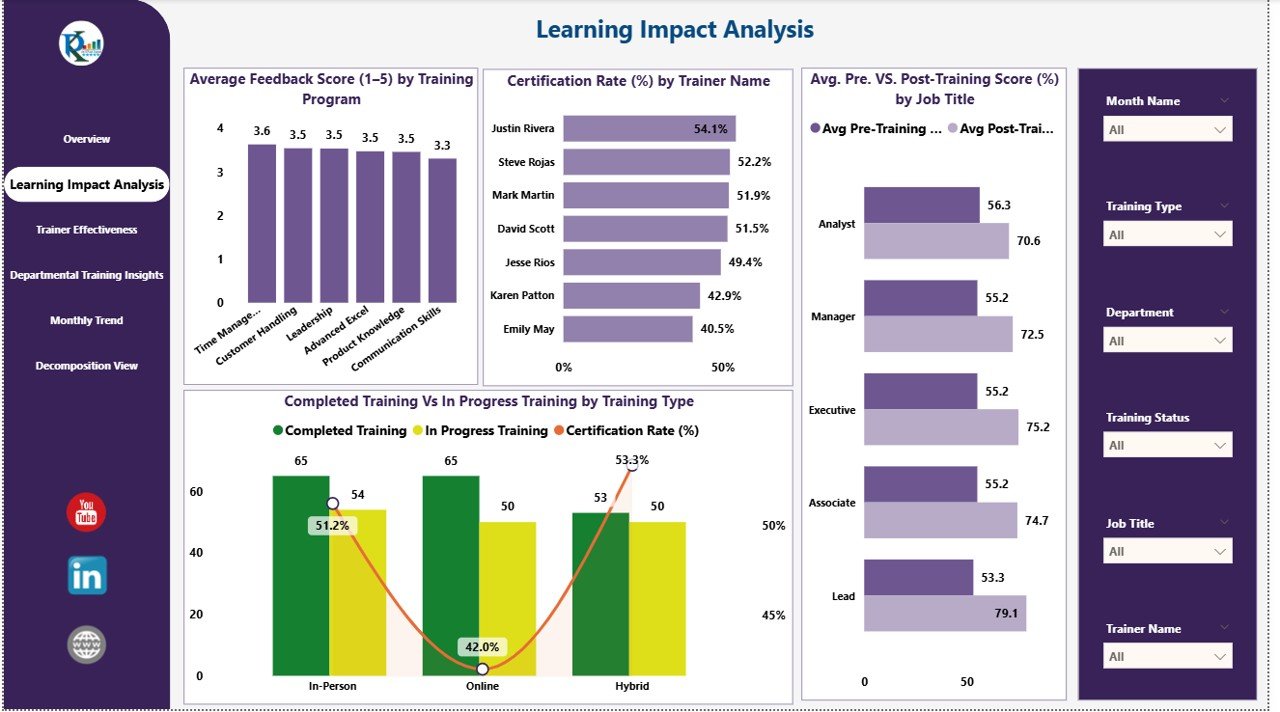
2. Learning Impact Analysis Page
Focuses on the outcomes and effectiveness of training programs.
Charts:
-
Average Feedback Score (1–5) by Training Program – Shows participant satisfaction
-
Certification Rate (%) by Trainer Name – Evaluates trainer success
-
Avg. Pre vs Post-Training Score (%) by Job Title – Measures learning improvement
-
Completed Training vs In Progress by Training Type – Tracks ongoing and finished programs
Click to Buy Employee Training Effectiveness Dashboard in Power BI
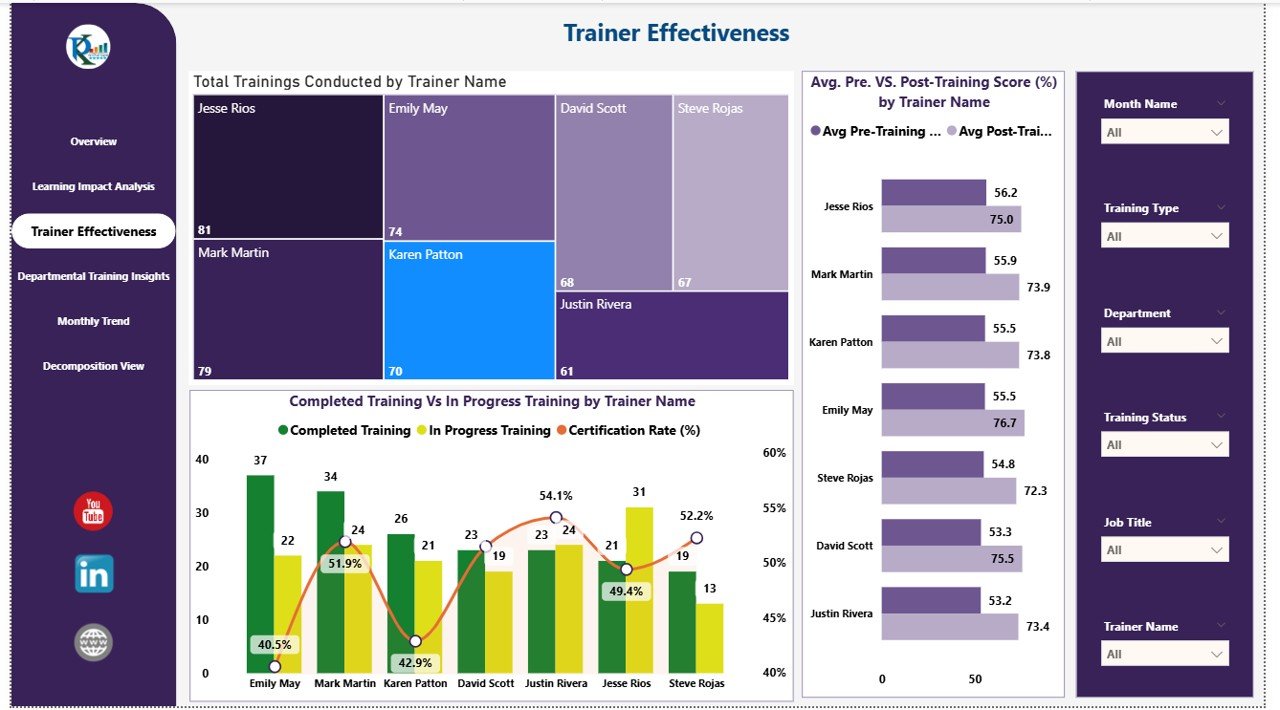
3. Trainer Effectiveness Page
Analyzes the performance of trainers across programs.
Charts:
-
Total Trainings Conducted by Trainer Name – Number of sessions per trainer
-
Avg. Pre vs Post-Training Score (%) by Trainer Name – Effectiveness of training delivery
-
Completed Training vs In Progress by Trainer Name – Monitors workload and completion
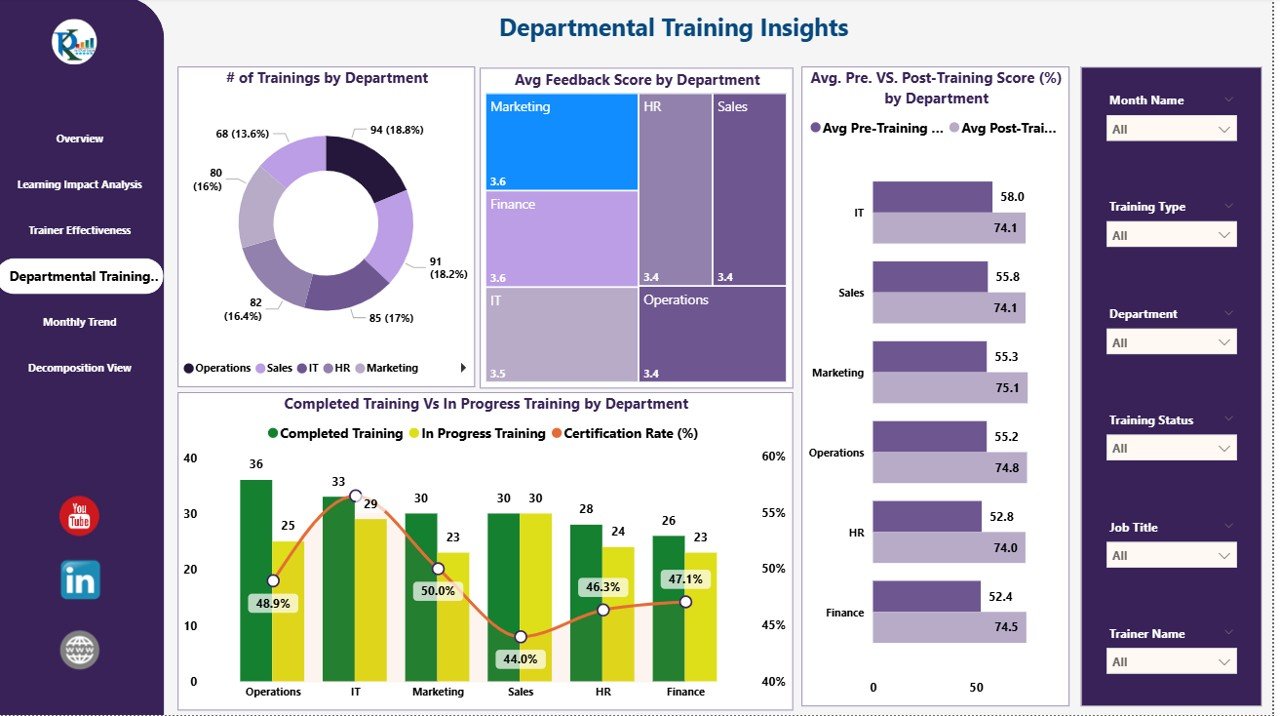
4. Departmental Training Insights Page
Provides insights on training performance across departments.
Charts:
-
# of Trainings by Department – Tracks the number of sessions per department
-
Avg. Feedback Score by Department – Measures satisfaction and engagement
-
Avg. Pre vs Post-Training Score (%) by Department – Shows learning outcomes
-
Completed Training vs In Progress by Department – Tracks departmental participation
Click to Buy Employee Training Effectiveness Dashboard in Power BI
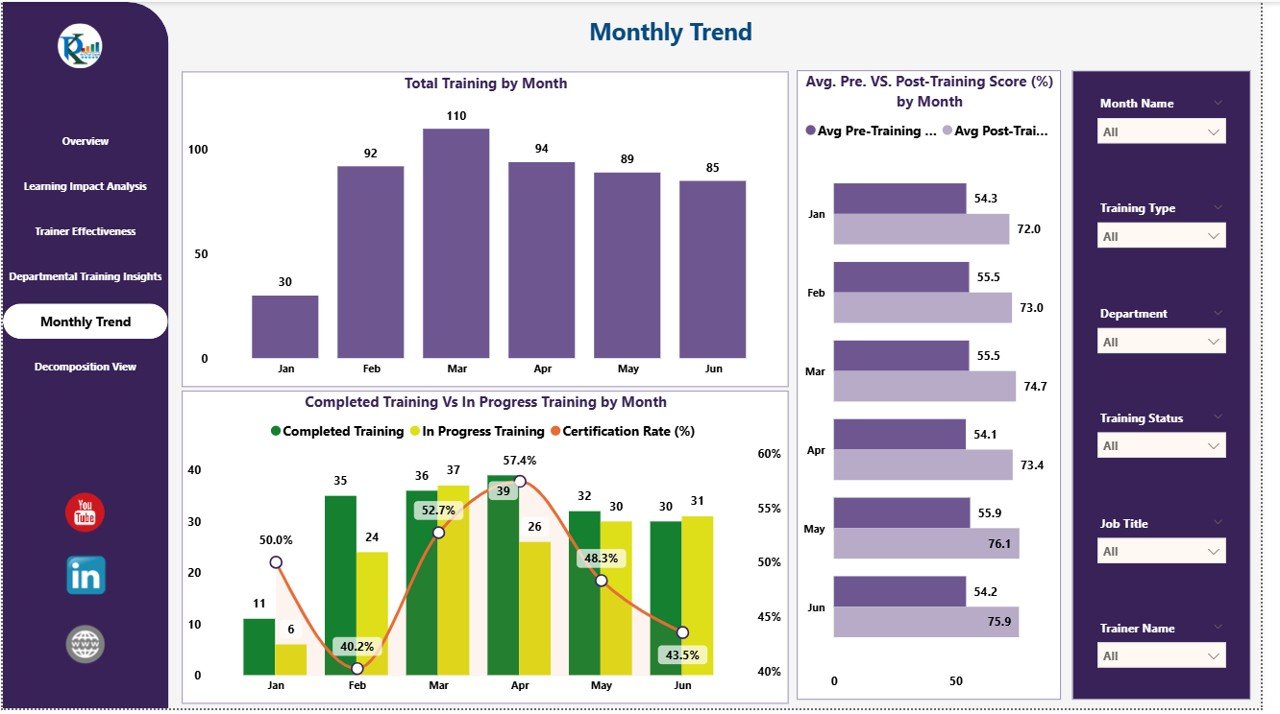
5. Monthly Trend PageMonitors trends in training performance over time.
Charts:
-
Total Trainings by Month – Track monthly training volume
-
Avg. Pre vs Post-Training Score (%) by Month – Measures learning improvement month-over-month
-
Completed Training vs In Progress by Month – Monitor workflow and schedule adherence
Click to Buy Employee Training Effectiveness Dashboard in Power BI
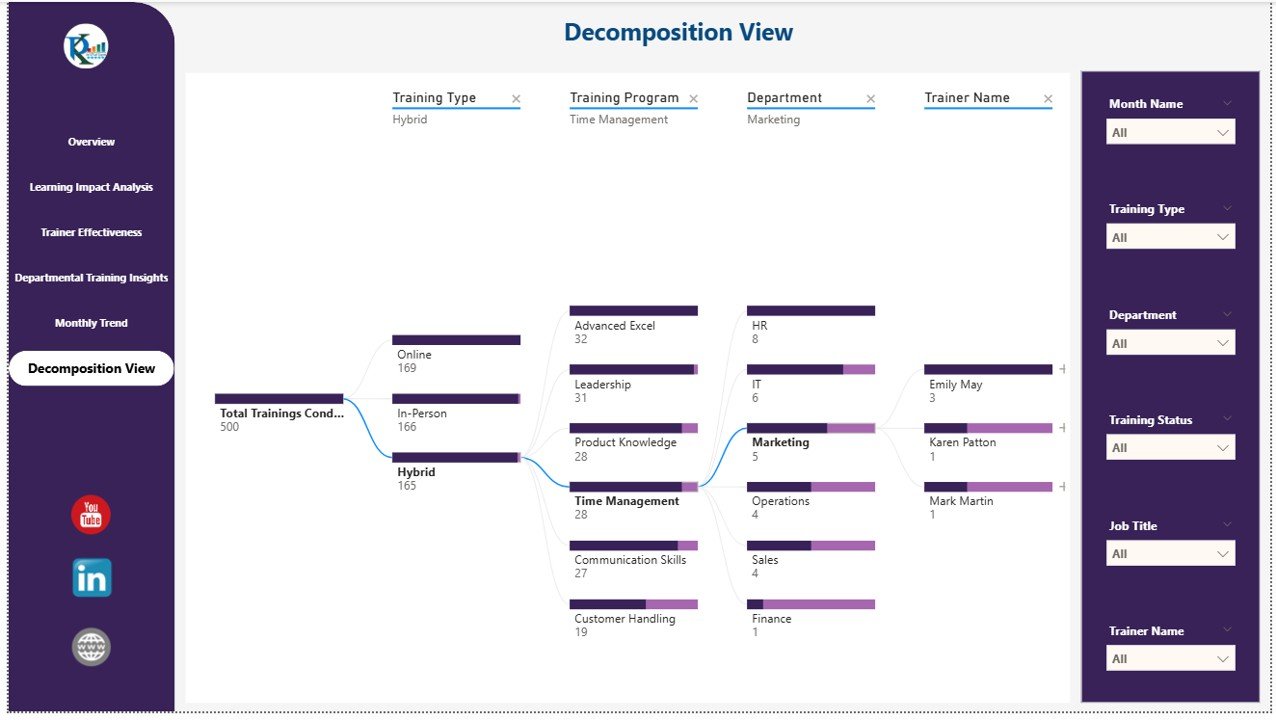
6. Decomposition View Page
Enables drill-down analysis for granular insights.
Chart:
-
Breaks down key metrics by department, trainer, training type, or location to identify trends, bottlenecks, and opportunities for improvement.
Advantages of Using the Employee Training Effectiveness Dashboard
-
Centralized Data: All training metrics in one interactive dashboard
-
Measure Learning Impact: Evaluate improvement through pre- and post-training scores
-
Track Certification Progress: Monitor completion and success rates
-
Identify Departmental Needs: Assess which departments require additional training
-
Evaluate Trainers: Compare effectiveness of trainers across programs
-
Trend Analysis: Monthly and yearly trends for planning future training initiatives
Best Practices for Using the Dashboard
Click to Buy Employee Training Effectiveness Dashboard in Power BI
-
Regularly Update Data: Keep pre-training, post-training, and feedback scores current
-
Monitor Completion Rates: Ensure employees complete mandatory trainings
-
Analyze by Department and Job Role: Customize training programs based on performance gaps
-
Track Trainer Performance: Use trainer insights to improve learning delivery
-
Use Trend Analysis for Planning: Identify peak training periods and schedule accordingly
-
Drill Down with Decomposition Views: Investigate root causes of low performance or engagement
Frequently Asked Questions (FAQs)
Q1: Can I customize the dashboard for different training programs?
Yes, you can add or modify KPIs, training types, and departments according to your organization’s needs.
Q2: How often should the data be updated?
Update data after each training session or monthly to maintain accurate insights.
Q3: Can I track both certifications and training completion?
Yes, the dashboard includes separate metrics for certifications, completion rates, and feedback scores.
Q4: Can the dashboard measure learning improvement?
Absolutely. Pre- and post-training scores allow you to evaluate knowledge and skill improvement.
Q5: Is this dashboard suitable for large organizations?
Yes, Power BI supports large datasets and allows drill-down analysis for multiple departments and trainers.
Conclusion
Click to Buy Employee Training Effectiveness Dashboard in Power BI
The Employee Training Effectiveness Dashboard in Power BI provides a comprehensive, interactive, and visual way to monitor training programs. By tracking pre- and post-training scores, feedback, certification rates, and departmental participation, organizations can improve learning outcomes, evaluate trainer performance, and ensure effective skill development across the workforce.
Visit our YouTube channel to learn step-by-step video tutorials
Click to Buy Employee Training Effectiveness Dashboard in Power BI