ERP SaaS Startups Dashboard in Power BI gives founders, RevOps teams, SaaS finance analysts, product leaders, and customer success managers a structured way to review seats, MRR, CAC, ARR, total accounts, customer mix, product module performance, and growth health from one PBIX report. ERP SaaS startups often track revenue, acquisition cost, onboarding status, account ownership, and churn indicators across separate systems. When those records stay fragmented, monthly reporting becomes slow and inconsistent. This Power BI dashboard brings the core startup metrics into one reporting layer with KPI cards, slicers, and five focused pages.
The template is designed for teams that already have structured SaaS data and want a ready Power BI reporting view instead of building every page manually. You can open the file in Power BI Desktop, replace or connect your own data source, refresh the model, and use the pages for leadership reviews, investor updates, revenue planning, product analysis, and customer success discussions. If you are new to the platform, Microsoft provides official guidance for getting started with Power BI Desktop.
Key Features of ERP SaaS Startups Dashboard in Power BI
- 5 report pages: Overview, Revenue Trends, Customer Mix, Product Insights, and Growth Health.
- Executive KPI cards: Total Seats, Total MRR, Total CAC, Total ARR, and Total Accounts.
- Revenue analysis: ARR by year, ARR by product module, MRR by month, and MRR by startup.
- Acquisition cost reporting: CAC by customer segment, month, and product module.
- Customer mix views: Seats by region and MRR by industry for clearer segmentation.
- Product and sales insights: Accounts by implementation stage, ARR by startup, and MRR by account executive.
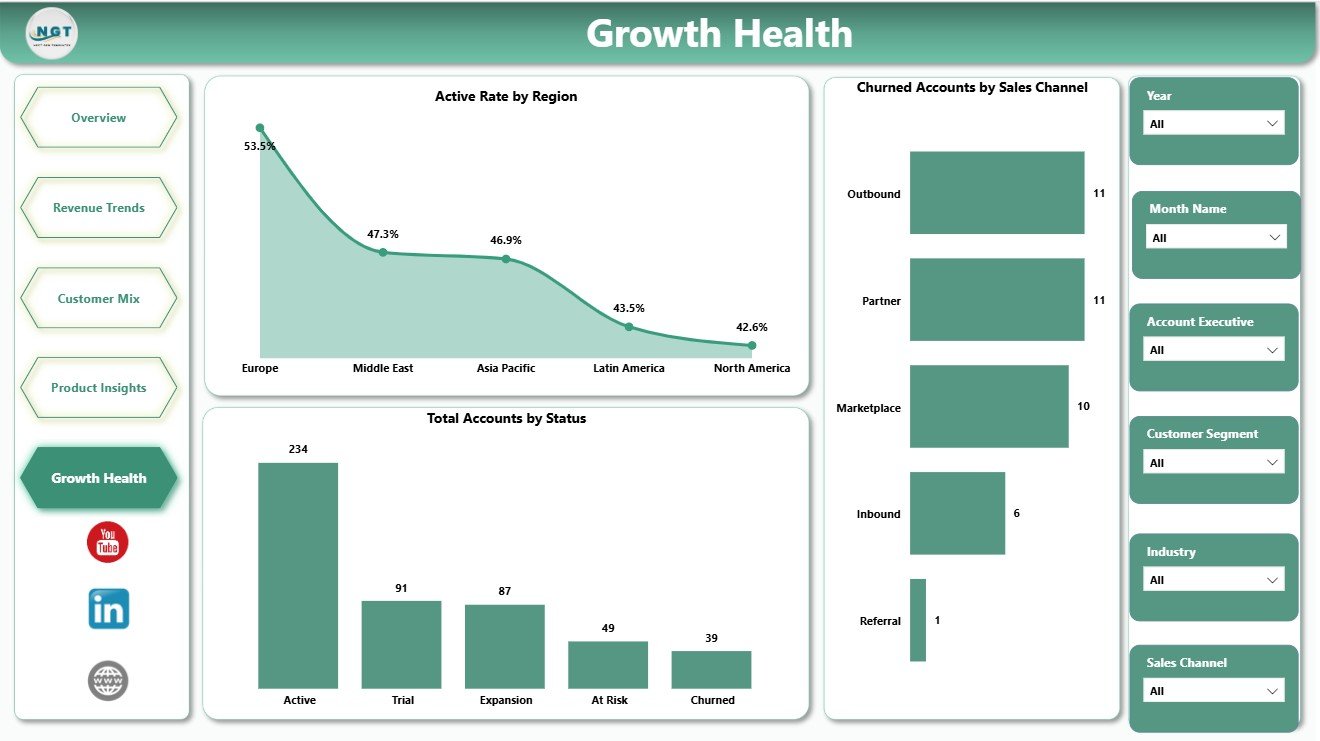
- Growth health tracking: Active rate by region, accounts by status, and churned accounts by sales channel.
- Editable PBIX file: Change visuals, fields, relationships, colors, measures, and pages in Power BI Desktop.
Dashboard Pages Explanation
1. Overview Page
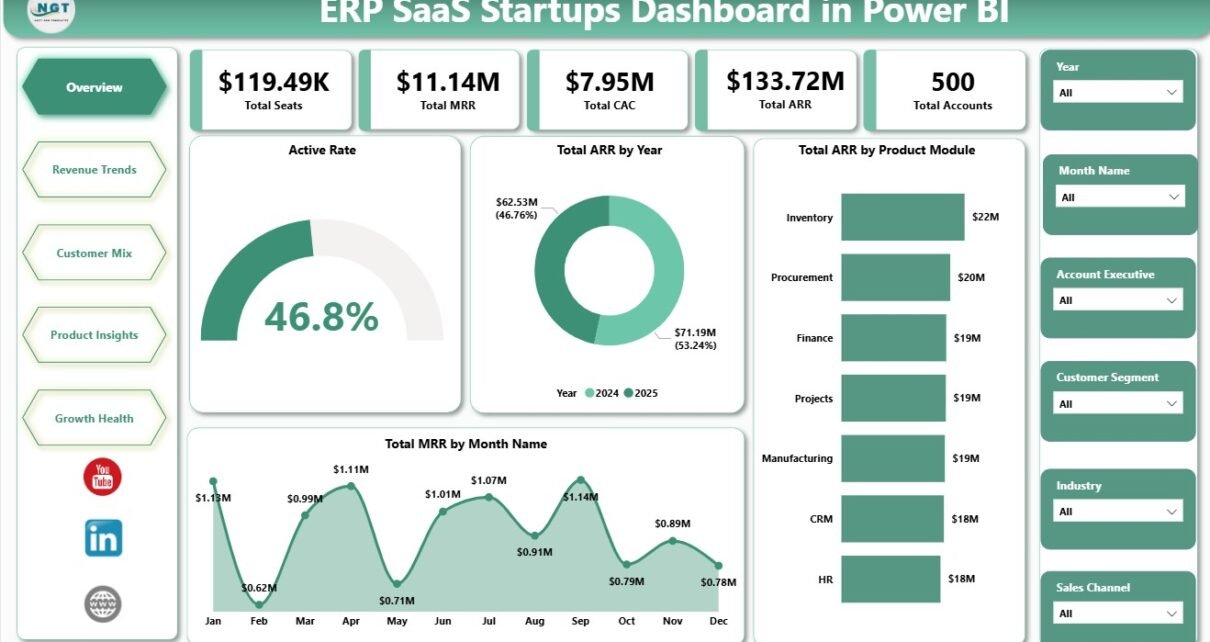
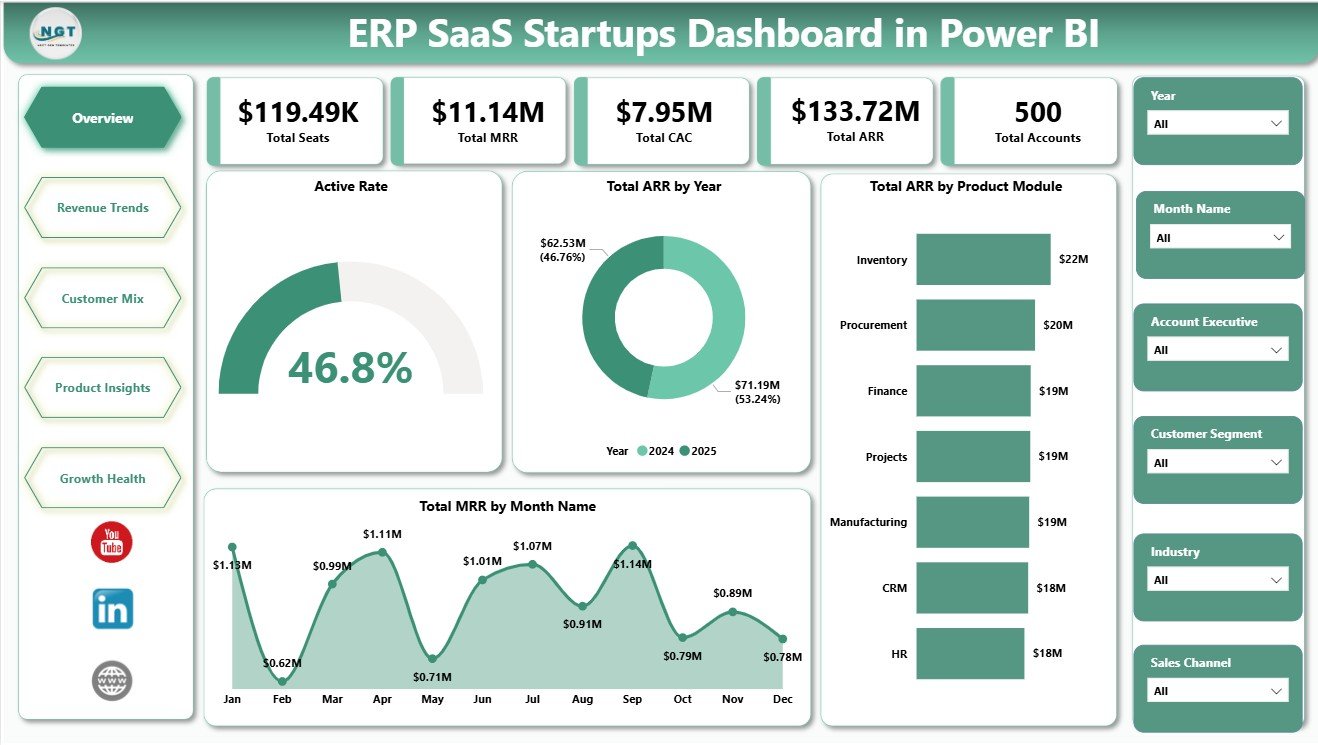
The Overview Page is the executive landing page for the report. The top KPI cards show Total Seats, Total MRR, Total CAC, Total ARR, and Total Accounts, giving leadership a fast snapshot of subscription scale, acquisition investment, recurring revenue, and customer base size.
Active Rate shows the share of accounts that are currently active. This helps leadership and customer success teams understand whether account health is improving or weakening across selected filters.
Total ARR by Year tracks annual recurring revenue across years. It is useful for board decks, investor updates, year-over-year reviews, and long-term planning.
Total ARR by Product Module compares recurring revenue contribution by module. This helps product, sales, and finance teams understand which modules carry the strongest commercial weight.
Total MRR by Month Name reviews monthly recurring revenue by month. It helps teams identify seasonality, growth movement, and months that need deeper analysis.
2. Revenue Trends
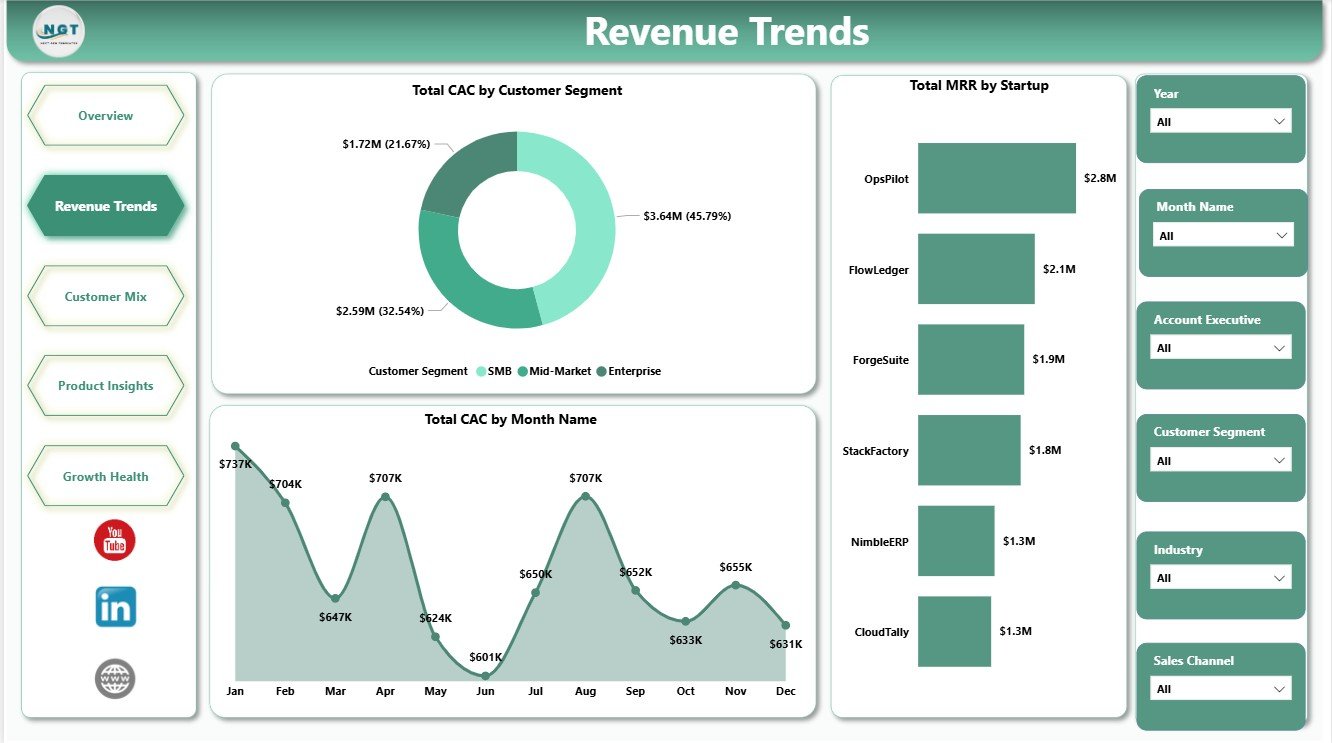
The Revenue Trends page focuses on acquisition cost and recurring revenue movement. It includes Total CAC by Customer Segment, Total CAC by Month Name, and Total MRR by Startup.
This page helps teams compare acquisition spend across segments, watch how CAC changes month by month, and identify which startups or accounts create the strongest MRR contribution. It is especially useful for monthly finance reviews and founder-level revenue discussions.
3. Customer Mix
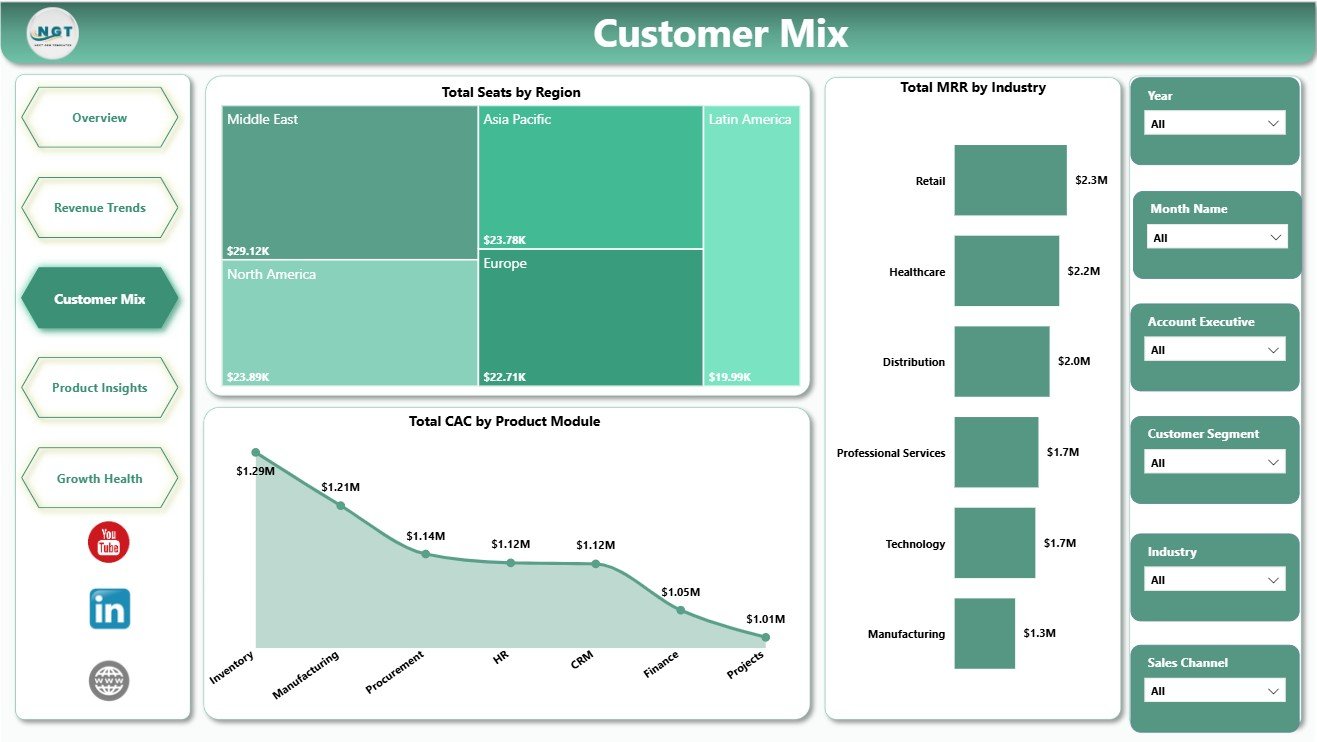
The Customer Mix page explains how seats, revenue, and acquisition cost are distributed across customer dimensions. It includes Total Seats by Region, Total MRR by Industry, and Total CAC by Product Module.
Use this page to review regional adoption, industry-level revenue concentration, and module-level acquisition cost. It helps go-to-market teams decide where to focus expansion, which industries deserve more attention, and which modules may need pricing or positioning review.
4. Product Insights
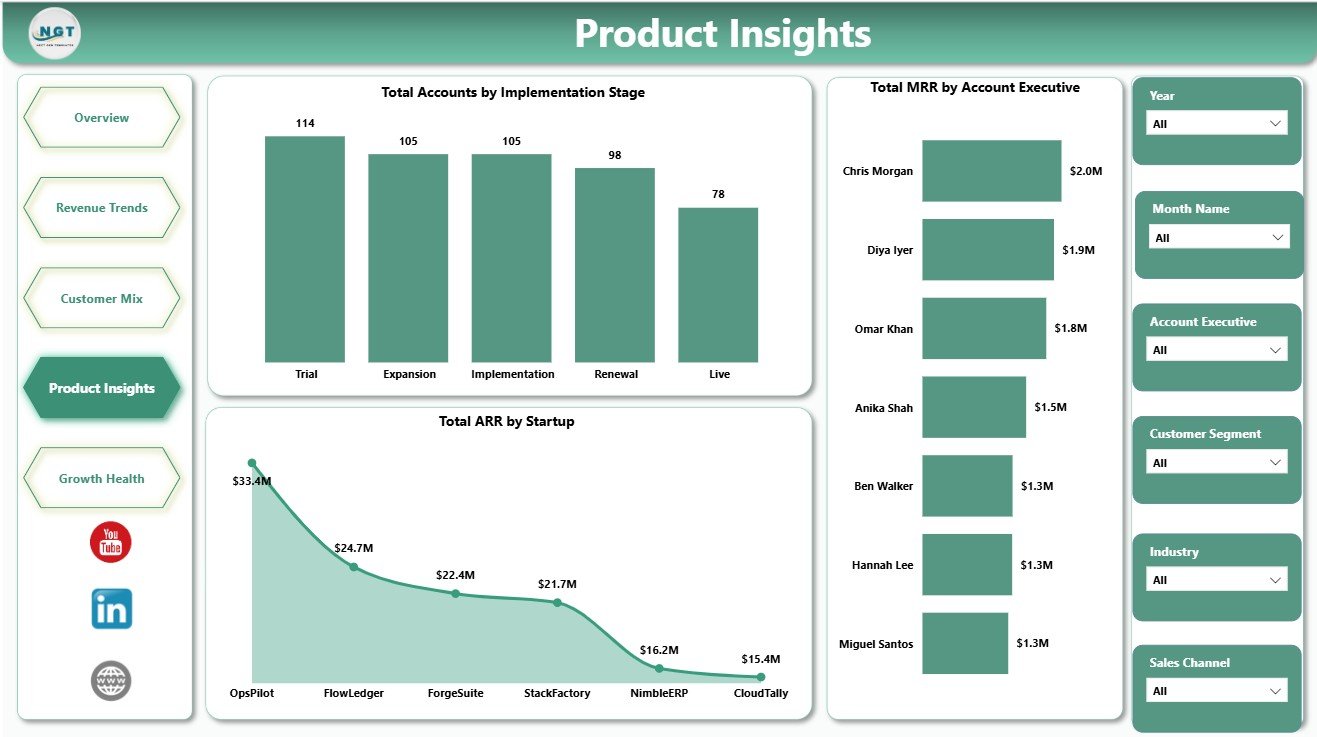
The Product Insights page connects implementation status, startup-level ARR, and account ownership. It includes Total Accounts by Implementation Stage, Total ARR by Startup, and Total MRR by Account Executive.
This page helps product and customer-facing teams see whether implementation progress is aligned with revenue outcomes. It also helps sales leaders compare account executive MRR contribution and identify whether revenue is concentrated in a few startups.
5. Growth Health
The Growth Health page focuses on account quality and churn visibility. It includes Active Rate by Region, Total Accounts by Status, and Churned Accounts by Sales Channel.
This page helps teams understand where active rate is strongest, how accounts are distributed by status, and which sales channels are associated with churned accounts. It is useful for renewal planning, customer success prioritization, and channel review.
ERP SaaS Startups Dashboard in Power BI vs. Tableau vs. Paid CRM/SaaS – Feature Comparison
| Feature | This Power BI Dashboard | Tableau Alternative | Paid CRM/SaaS |
|---|---|---|---|
| Cost | $17.99 one-time | Requires Tableau license or custom build | Monthly or annual subscription |
| Platform | Power BI Desktop / Power BI Service | Tableau Desktop / Cloud | Vendor cloud platform |
| Setup time | Open PBIX, connect or replace data, refresh | Build model and dashboards manually | Implementation and onboarding |
| Real-time team collaboration | Available through Power BI Service with licensing | Available through Tableau Cloud with licensing | Usually included |
| Mobile access | Power BI mobile app when published | Tableau mobile when published | Vendor app or browser |
| Customizable fields | Editable pages, visuals, relationships, and measures | Editable with Tableau skills | Limited by vendor settings |
| Share with link | Possible through Power BI Service permissions | Possible through Tableau Cloud permissions | Usually login controlled |
| Year-1 cost at 5 users | $17.99 plus Microsoft licensing if needed | Usually much higher | Often hundreds or thousands |
| ERP SaaS metrics | ARR, MRR, CAC, seats, accounts, modules, active rate, churn | Requires custom design | Depends on plan and integrations |
Who Should Use This Template
This template is useful for ERP SaaS founders, revenue operations managers, SaaS finance analysts, customer success teams, product leaders, account executives, startup portfolio analysts, and consultants who need a Power BI view of revenue, acquisition cost, account health, product modules, implementation progress, and churn indicators.
It is not meant to replace a full ERP, CRM, billing platform, product analytics system, data warehouse, or governed enterprise BI environment. It works best when your team already has clean structured data and wants a reporting layer that is easy to review and customize.
Real-World Use Cases
Nina, seed-stage founder: Nina uses the Overview page before investor calls to explain ARR, MRR, CAC, seats, total accounts, and active rate without preparing separate slides from scratch.
Omar, RevOps manager: Omar reviews Customer Mix and Revenue Trends every month to compare industry MRR, regional seats, segment CAC, and module-level acquisition cost.
Leah, customer success lead: Leah uses Product Insights and Growth Health to monitor implementation stage, account status, active rate by region, and churned accounts by sales channel.
Advantages of ERP SaaS Startups Dashboard in Power BI
- It turns recurring revenue, customer, acquisition, product, and growth health metrics into one reporting view.
- It gives executives a fast Overview page while still offering deeper Revenue Trends, Customer Mix, Product Insights, and Growth Health pages.
- It is editable in Power BI Desktop, so teams can adapt visuals, fields, measures, colors, and relationships.
- It supports better monthly reporting without a high-cost analytics implementation.
- It uses familiar SaaS operating metrics such as ARR, MRR, CAC, accounts, seats, active rate, and churned accounts.
Opportunities for Improvement
For larger SaaS teams, the next step may be connecting the PBIX file to a governed database, Power Query pipeline, billing export, CRM table, or data warehouse. Teams may also add expansion ARR, contraction ARR, net revenue retention, gross revenue retention, cohort retention, pipeline coverage, forecast accuracy, or customer health score measures as their reporting maturity grows.
Best Practices
- Keep field names and data types consistent when replacing sample records.
- Refresh the model after each data update and validate KPI cards before sharing.
- Review CAC and MRR together so growth is not judged by revenue alone.
- Use slicers during leadership reviews to answer follow-up questions quickly.
- Track churned accounts by sales channel and active rate by region together for better channel-quality discussions.
- Save a backup before changing relationships, Power Query steps, or DAX measures.
Explore Relevant Templates
You can download the product from ERP SaaS Startups Dashboard in Power BI. You may also want to compare it with the ERP SaaS Startups Dashboard in Excel, SaaS Product Usage Dashboard in Excel, and SaaS Metrics Dashboard in Excel. Browse more Power BI Dashboard Templates on NextGenTemplates.
Frequently Asked Questions
What KPI cards are included?
The Overview page includes KPI cards for Total Seats, Total MRR, Total CAC, Total ARR, and Total Accounts.
How many report pages are included?
The dashboard includes 5 Power BI pages: Overview, Revenue Trends, Customer Mix, Product Insights, and Growth Health.
Do I need Power BI Desktop?
Yes. You need Power BI Desktop to open and edit the PBIX file. Publishing and sharing through Power BI Service may require Microsoft licensing.
Can I use my own SaaS data?
Yes. Replace the sample data or connect the report to your own structured ERP SaaS data source, then refresh the model.
Does this replace a CRM, ERP, or billing platform?
No. It is a reporting dashboard for analysis, not an operational CRM, ERP, billing platform, customer success platform, or data warehouse.
Can I customize the dashboard?
Yes. You can edit visuals, slicers, pages, colors, fields, relationships, Power Query steps, and DAX measures in Power BI Desktop.
About the Author
Built by PK – Microsoft Certified Professional with 15+ years of Excel, Google Sheets, and Power BI experience. Founder of NextGenTemplates, reaching 300K+ subscribers across YouTube channels. Every template is hand-built and tested before release.
Conclusion
The ERP SaaS Startups Dashboard in Power BI is a practical reporting template for teams that want a clearer view of seats, MRR, CAC, ARR, accounts, customer mix, product modules, implementation progress, active rate, and churned accounts. It gives startup operators a ready structure for monthly review while still leaving the PBIX file open for customization.
Visit YouTube.com/@PKAnExcelExpert for more Power BI and Excel dashboard tutorials.