When it comes to understanding the financial well-being of your business, Key Performance Indicators (KPIs) play a major role. One of the most powerful tools you can use to monitor and manage financial performance is a Financial Health KPI Dashboard in Excel. Whether you’re a small business owner or a corporate finance professional, this dashboard can help you track essential financial metrics in one place, making data-driven decisions faster and easier.
In this comprehensive guide, we will walk you through everything you need to know about building and using a Finance and Accounting Financial Health KPI Dashboard in Excel. We’ll also explore best practices, advantages, and frequently asked questions to help you get the most out of it.
Click to Purchases Finance and Accounting Financial Health KPI Dashboard in Excel
What is a Financial Health KPI Dashboard in Excel?
A Financial Health KPI Dashboard is a centralized tool designed in Excel that displays key financial metrics of a business. It visualizes Month-to-Date (MTD) and Year-to-Date (YTD) performance, compares actuals with targets, and helps track performance trends over time.
By integrating your data into an Excel dashboard, you can simplify complex financial reports, create interactive visuals, and gain a clearer understanding of your organization’s financial status.
Key Features of the Financial Health KPI Dashboard
The dashboard template comes with 7 powerful and user-friendly worksheets:
Home Sheet
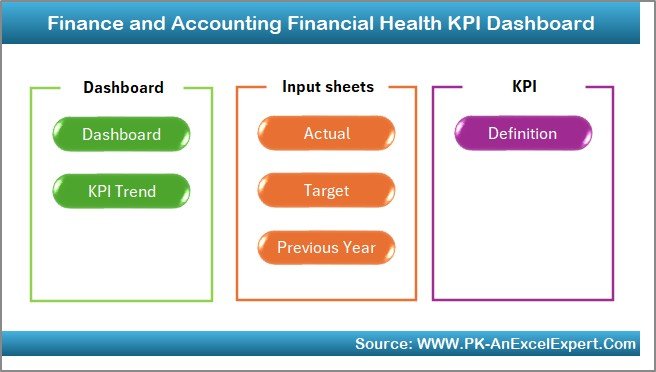
- Acts as a landing page.
- Provides navigation buttons to quickly access different parts of the dashboard.
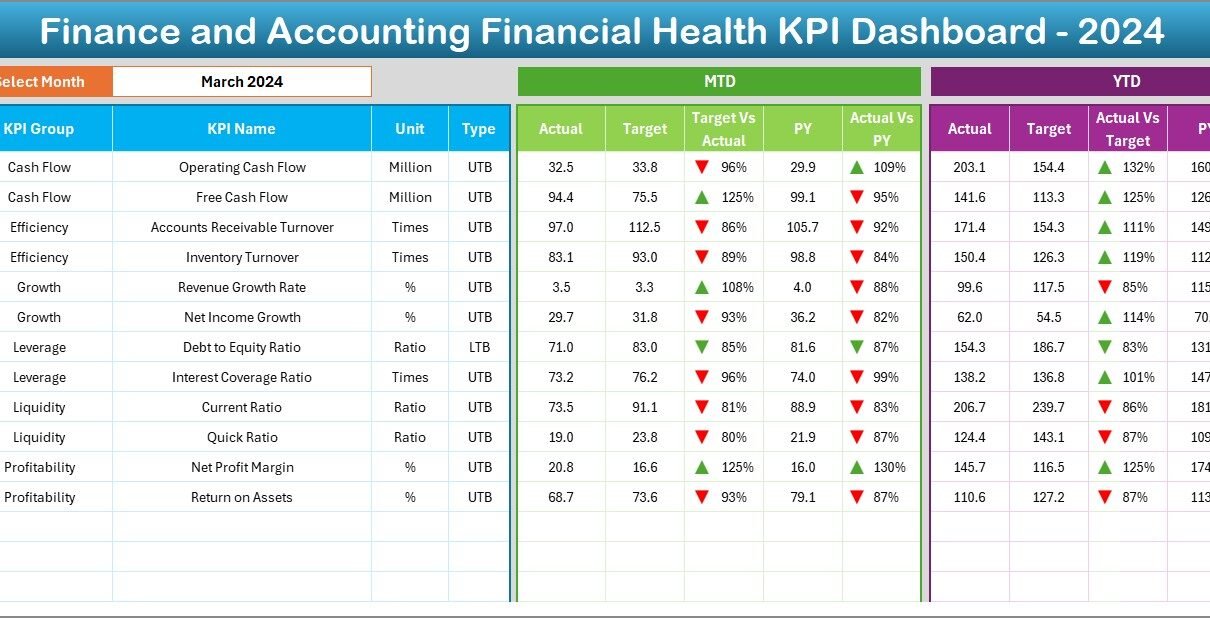
Dashboard Sheet Tab
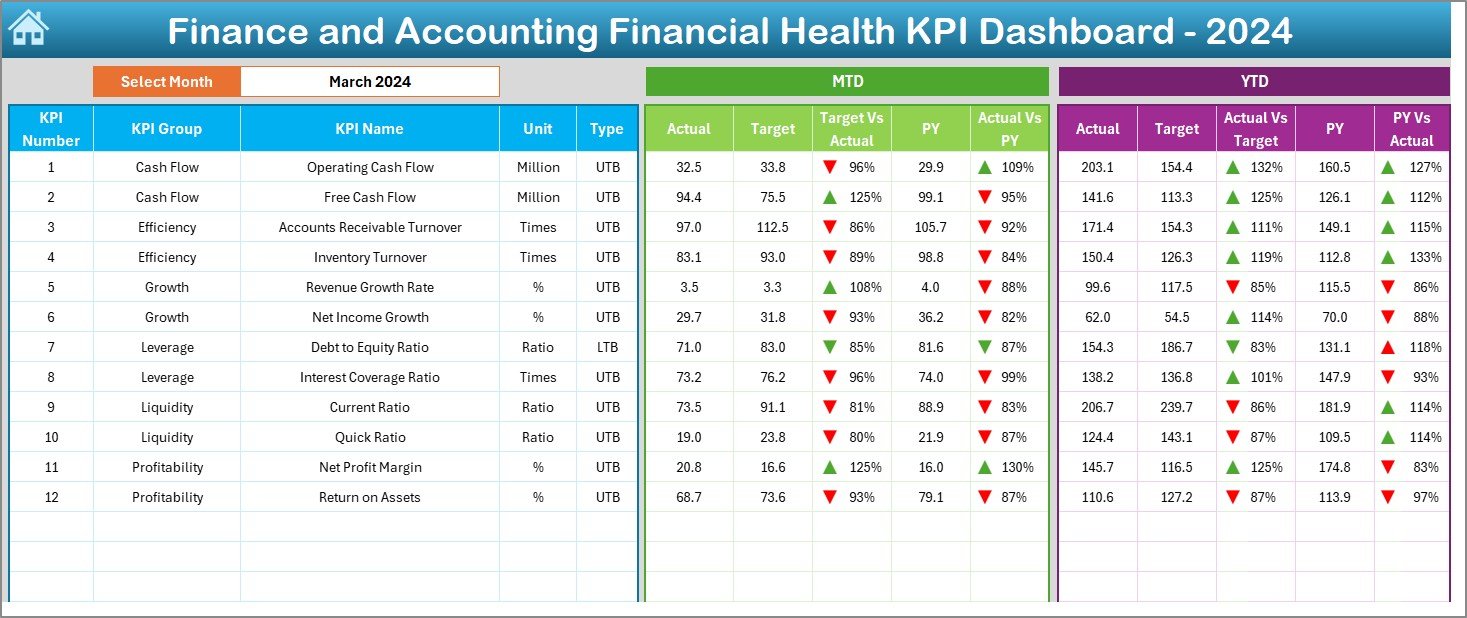
- The core sheet that displays financial KPIs.
- Select the month from a dropdown in cell D3.
- Automatically updates values for MTD and YTD.
- Displays actual, target, and previous year comparisons.
- Includes conditional formatting arrows to show performance trends.
KPI Trend Sheet Tab
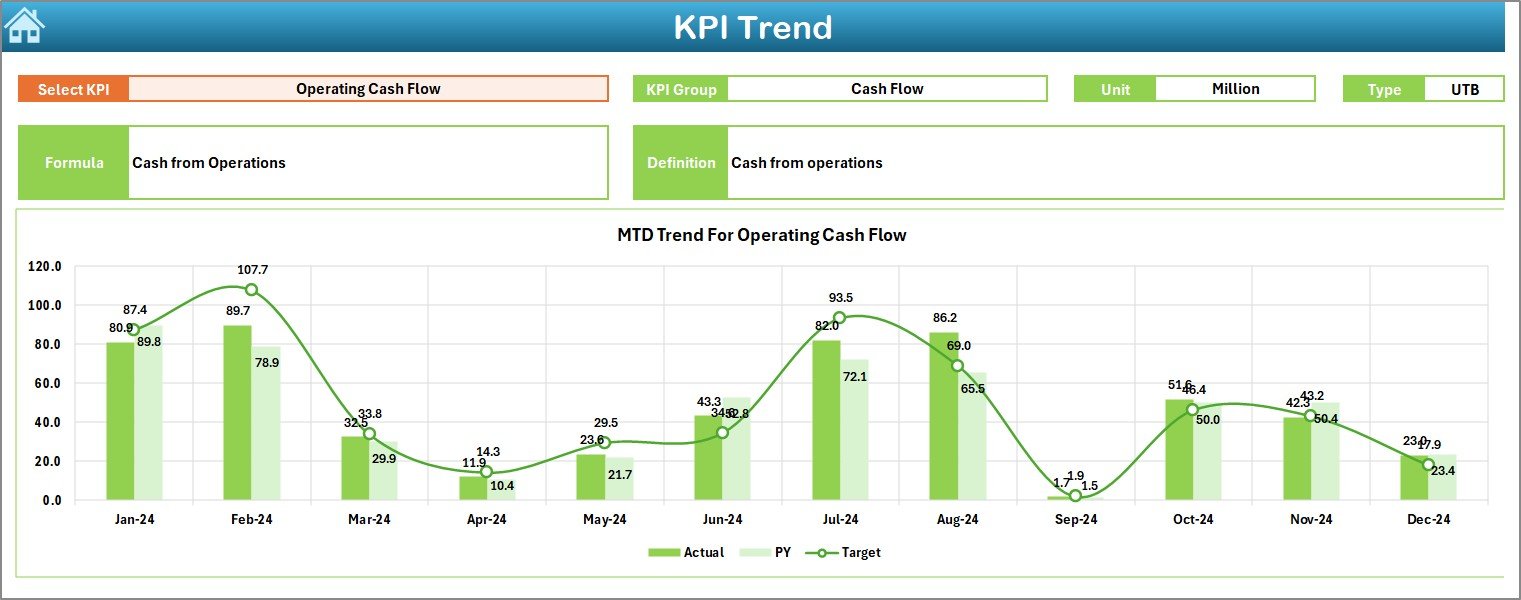
- Allows users to choose a KPI from a dropdown (cell C3).
- Displays detailed KPI information: group, unit, formula, and whether it’s “Lower the Better” or “Upper the Better.”
- Shows line charts for MTD and YTD trends comparing Actual, Target, and Previous Year.
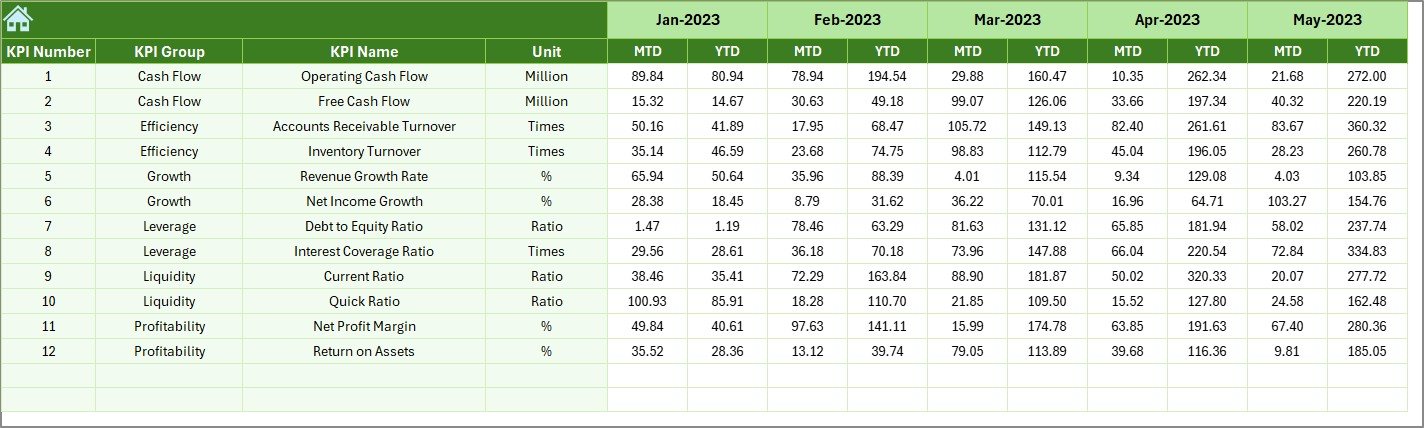
Actual Numbers Input Sheet
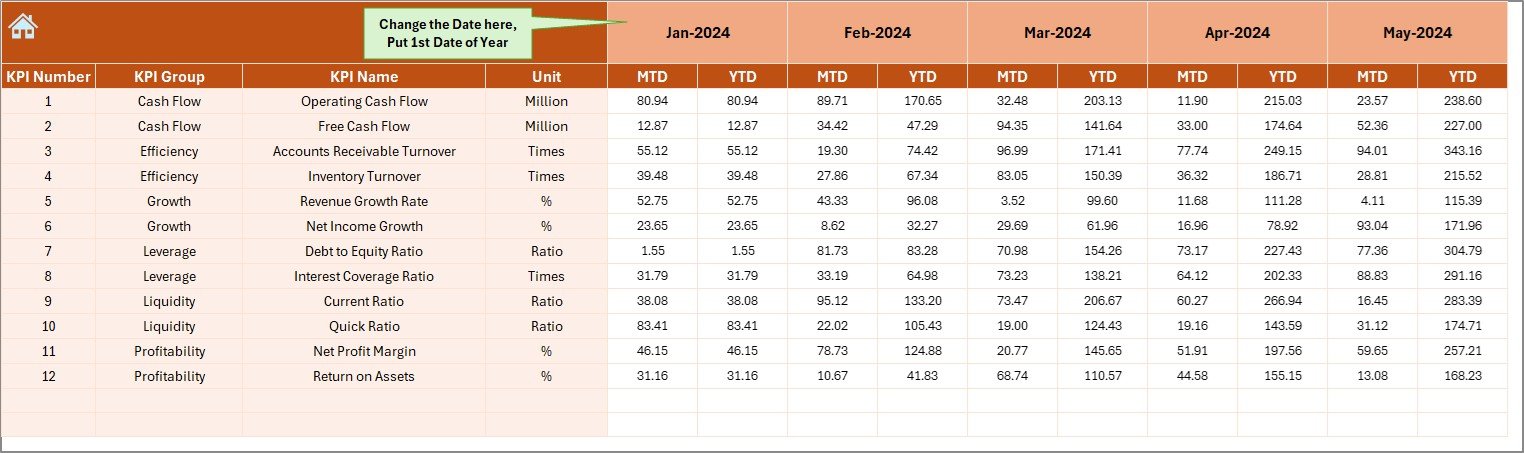
- Used for entering monthly MTD and YTD actual values.
- You can change the fiscal starting month in cell E1.
Target Sheet Tab
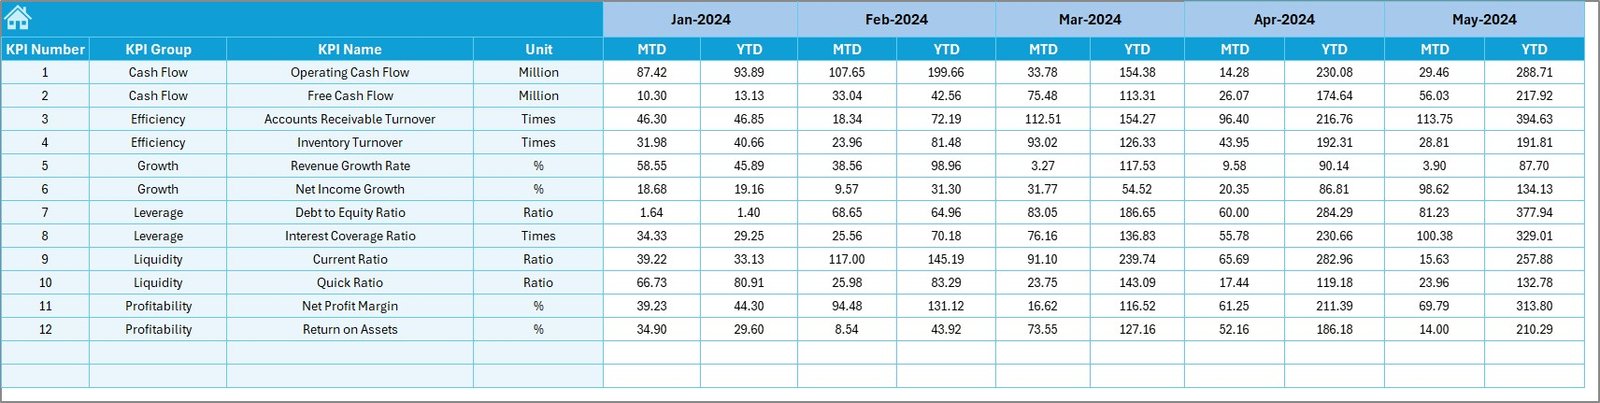
- Input your monthly MTD and YTD targets here.
- Keeps your dashboard aligned with your business goals.
Previous Year Number Sheet Tab
- Enter historical KPI data for the previous year.
- Useful for year-over-year performance analysis.
KPI Definition Sheet Tab
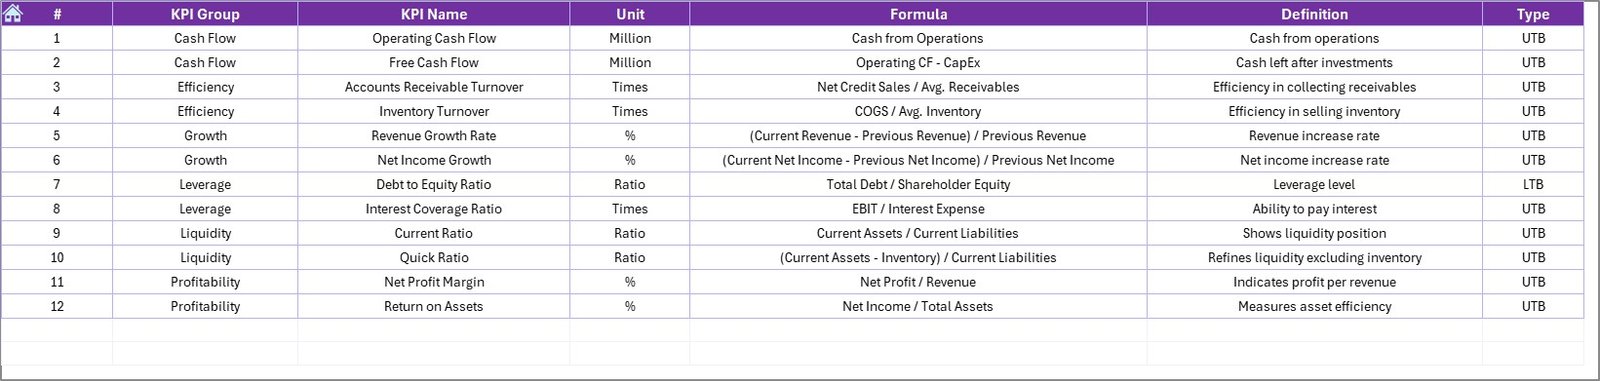
- Define each KPI clearly.
- Includes KPI name, group, unit, formula, and a simple definition.
Why Use Excel for a Financial Health KPI Dashboard?
- Familiar Interface: Most finance teams already use Excel, making the dashboard easy to adopt.
- Cost-effective: No need for costly BI tools.
- Customizable: You can tailor the dashboard to meet specific reporting needs.
- Flexible: Easily integrates with other spreadsheets or external data sources.
Advantages of Using a Financial Health KPI Dashboard
Click to Purchases Finance and Accounting Financial Health KPI Dashboard in Excel
✅ Real-Time Insights
Quickly access MTD and YTD performance data with a few clicks.
✅ Better Decision-Making
Compare actuals vs. targets and see trends to make informed financial decisions.
✅ Improved Team Alignment
Finance teams, managers, and executives can stay on the same page.
✅ Performance Monitoring
Identify problem areas and act on them before they become serious issues.
✅ Increased Accountability
Assign responsibility and deadlines to financial KPIs, improving ownership.
Best Practices for Using a Financial KPI Dashboard
Define Clear KPIs
Only include metrics that truly matter. Avoid cluttering the dashboard.
Update Regularly
Keep your Actual, Target, and Previous Year data up to date for accurate analysis.
Use Visual Cues
Incorporate arrows, charts, and color codes to highlight trends and variances.
Set Realistic Targets
Make sure your MTD and YTD goals are achievable and aligned with company objectives.
Validate Data
Double-check formulas and ensure data accuracy to maintain trust in the dashboard.
Train Your Team
Ensure all stakeholders know how to read and update the dashboard.
Which KPIs Should You Track in the Dashboard?
While KPIs vary depending on your business, here are essential financial KPIs that most organizations should monitor:
- Operating Cash Flow
- Gross Profit Margin
- Net Profit Margin
- Current Ratio
- Quick Ratio
- Debt to Equity Ratio
- Accounts Receivable Turnover
- Accounts Payable Turnover
- Budget Variance
- Return on Assets (ROA)
- Working Capital
- Revenue Growth Rate
Each of these indicators provides a piece of the puzzle in understanding your financial health.
How to Set Up the Dashboard Step-by-Step
Step 1: Create a Clear Layout
Use separate sheets for input, targets, definitions, and visuals.
Step 2: Build Your Data Tables
Prepare tables for MTD, YTD, and Previous Year values.
Step 3: Link Data to Dashboard
Use formulas like INDEX, MATCH, and VLOOKUP to pull relevant data.
Step 4: Add Dropdown Menus
Use Data Validation to create month or KPI selection dropdowns.
Step 5: Insert Charts and Indicators
Use line charts, bar graphs, and conditional formatting arrows to represent trends.
Step 6: Protect Input Sheets
Lock formula cells and protect data entry ranges to prevent errors.
How Often Should You Update the Dashboard?
For best results, update your dashboard monthly. This keeps the MTD and YTD insights fresh and helps teams act promptly. You can also update weekly if your finance team needs more agility.
Who Should Use This Dashboard?
This dashboard is perfect for:
- Finance Managers
- Accountants
- Financial Analysts
- Business Owners
- CFOs
It helps these stakeholders monitor key financial indicators and drive performance improvements.
Tips to Maximize the Value of Your Dashboard
- Use Named Ranges to simplify formulas.
- Create a summary sheet for quick snapshots.
- Enable cell comments or notes for explanations.
- Incorporate scenario analysis using Excel’s What-If tools.
- Use Power Query for data import automation.
Conclusion
A Finance and Accounting Financial Health KPI Dashboard in Excel is more than just a spreadsheet. It is your financial control center, giving you real-time visibility into the key indicators of business success. By using this dashboard, you can ensure your decisions are grounded in solid data, leading to improved performance, faster responses, and better outcomes.
Excel remains one of the most flexible and cost-effective platforms for dashboarding. So, why not take advantage of this powerful tool and bring your financial reporting to the next level?
Frequently Asked Questions (FAQs)
What is the purpose of a Financial Health KPI Dashboard?
The purpose is to track and visualize key financial metrics to assess a business’s financial performance and health.
Can I customize the KPI Dashboard in Excel?
Absolutely! You can add or remove KPIs, modify charts, and adjust layouts to suit your needs.
Is Excel the best tool for Financial Dashboards?
Excel is one of the best tools for financial dashboards due to its flexibility, widespread use, and powerful features.
How do I ensure the dashboard is error-free?
Validate formulas, use data validation, and protect critical cells from accidental changes.
Click to Purchases Finance and Accounting Financial Health KPI Dashboard in Excel
Visit our YouTube channel to learn step-by-step video tutorials