In today’s fast-changing business environment, organizations must maintain strong financial governance and transparency. Companies conduct audits regularly to ensure compliance, reduce risks, and improve operational efficiency. However, many audit teams still rely on static spreadsheets and manual reports. As a result, decision-makers struggle to track audit progress, identify risks quickly, and monitor compliance performance.
Therefore, businesses increasingly adopt data-driven dashboards to transform audit management. One of the most effective solutions is the Financial Auditing Dashboard in Power BI — a powerful, interactive reporting system that converts complex audit data into clear visual insights.
In this comprehensive guide, you will learn everything about the Financial Auditing Dashboard in Power BI, including its structure, features, benefits, implementation strategies, best practices, and frequently asked questions.
Click to Purchases Financial Auditing Dashboard in Power BI
What Is a Financial Auditing Dashboard in Power BI?
A Financial Auditing Dashboard in Power BI is an interactive analytics tool that helps organizations monitor audit activities, risk findings, compliance status, and audit performance metrics in real time.
Instead of reviewing multiple reports separately, audit managers can view all important KPIs on a single platform. Consequently, teams make faster decisions and improve audit effectiveness.
Power BI enables users to:
-
Visualize audit performance instantly
-
Track audit progress across departments and regions
-
Identify high-risk findings quickly
-
Monitor compliance trends over time
-
Improve accountability and transparency
Because Power BI connects directly with multiple data sources, organizations can update audit insights automatically.
Why Do Organizations Need a Financial Auditing Dashboard?
Many audit departments face similar challenges. For example, teams often manage audit records through emails, spreadsheets, or disconnected systems. As a result, tracking performance becomes difficult.
A Financial Auditing Dashboard solves these problems by providing centralized visibility.
Common Challenges Without a Dashboard
-
Delayed audit reporting
-
Limited visibility into audit risks
-
Manual data consolidation
-
Difficulty tracking corrective actions
-
Poor cross-department comparison
However, when organizations implement a Power BI dashboard, they gain structured insights immediately.
Click to Purchases Financial Auditing Dashboard in Power BI
Key Features of the Financial Auditing Dashboard in Power BI
This ready-to-use dashboard contains five interactive analytical pages designed for complete audit monitoring.
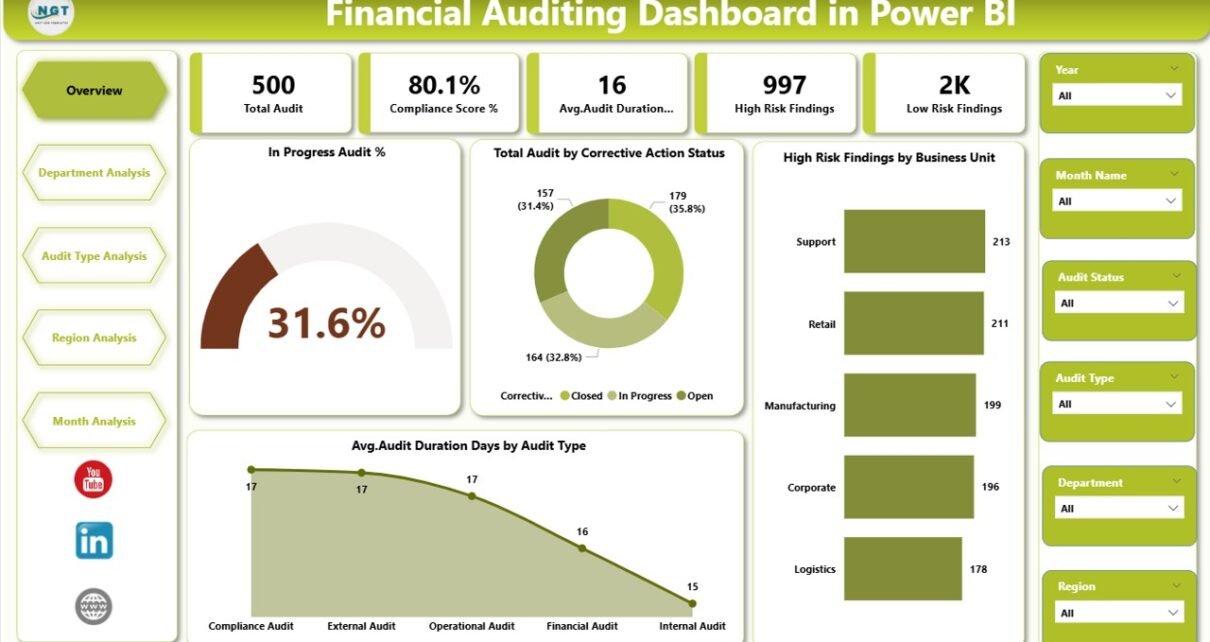
1️⃣ Overview Page – The Central Audit Control Panel
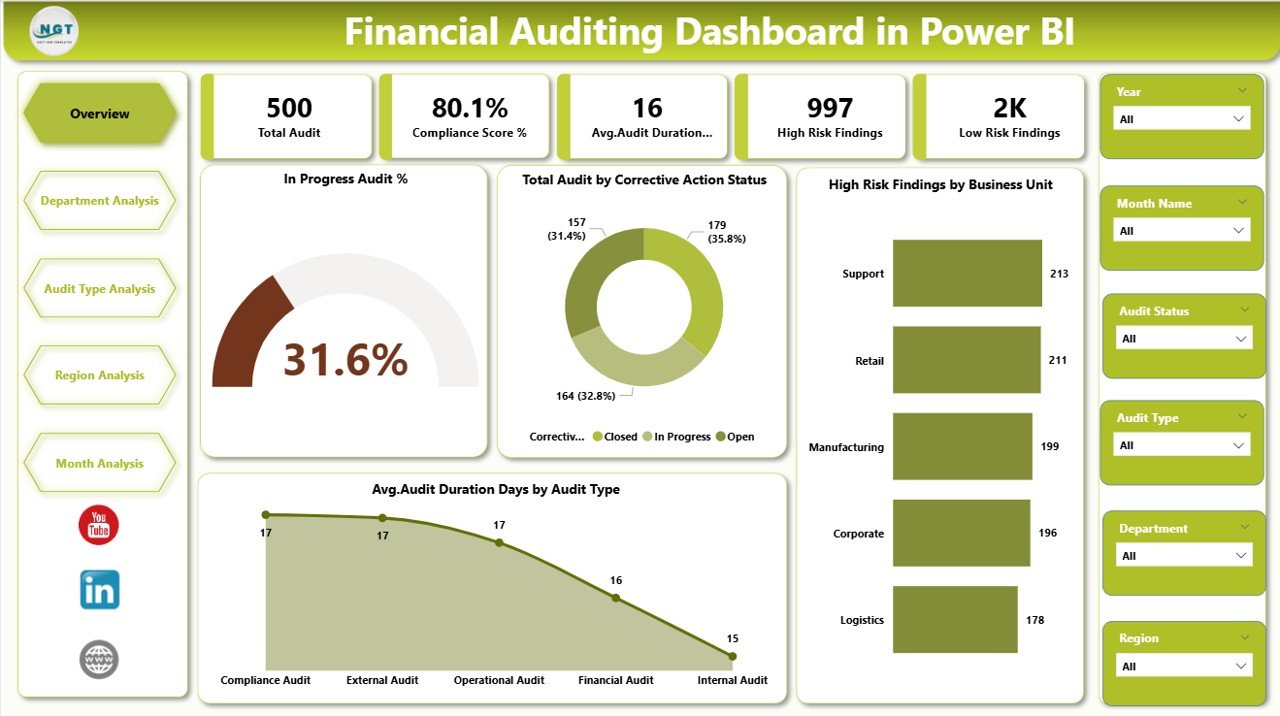
The Overview Page acts as the main monitoring screen. Users can quickly understand overall audit performance without navigating multiple reports.
Key Elements Included:
-
Interactive slicers (filters) for dynamic analysis
-
Five KPI cards displaying major audit indicators
-
High-level audit performance visualization
Main Metrics Displayed:
-
In Progress Audit %
-
Total Audit by Corrective Action Status
-
High Risk Findings by Business Unit
-
Average Audit Duration (Days) by Audit Type
Because this page summarizes critical metrics, executives can instantly assess audit health.
Why It Matters
-
Provides quick decision support
-
Highlights urgent risks immediately
-
Improves executive reporting
2️⃣ Department Analysis Page – Performance by Department
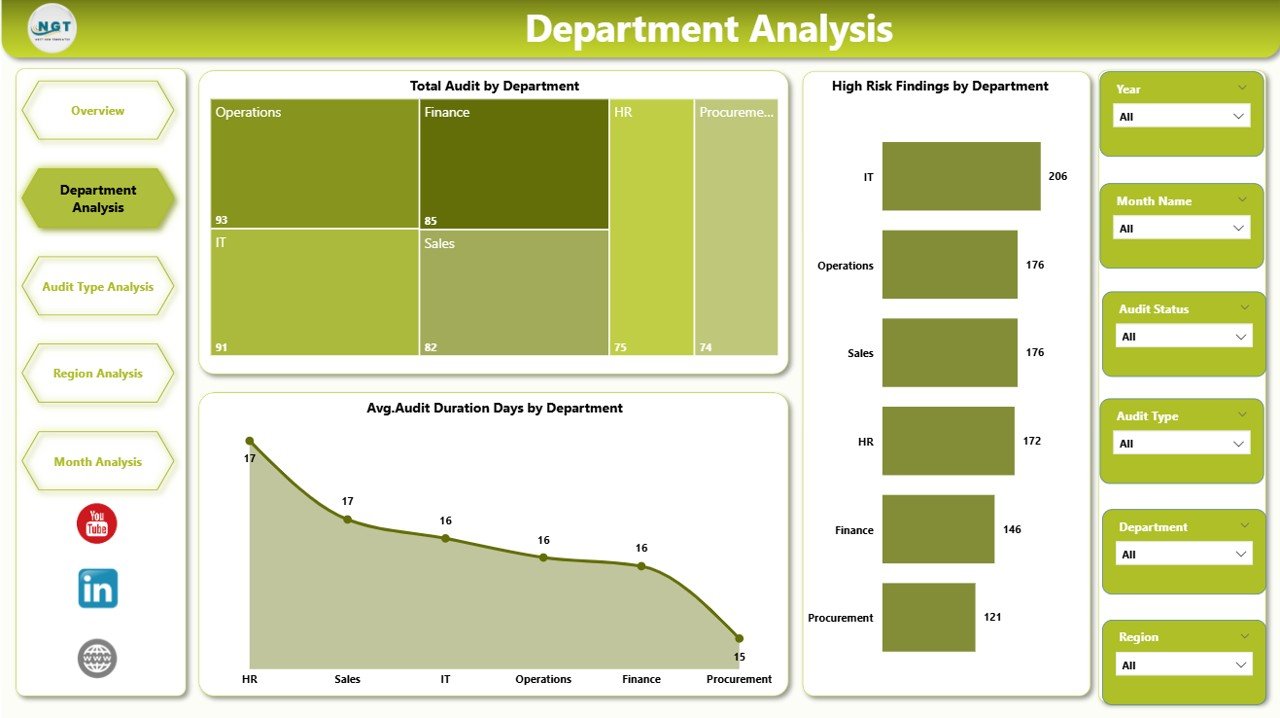
The Department Analysis page allows users to compare audit performance across departments.
Charts Included:
-
Total Audit by Department
-
High Risk Findings by Department
-
Average Audit Duration Days by Department
-
Click to Purchases Financial Auditing Dashboard in Power BI
As departments operate differently, audit results vary significantly. Therefore, this page helps leaders identify departments requiring attention.
Key Insights You Can Gain
-
Departments with frequent audit issues
-
Areas requiring compliance improvement
-
Departments with longer audit cycles
3️⃣ Audit Type Analysis – Understanding Audit Categories
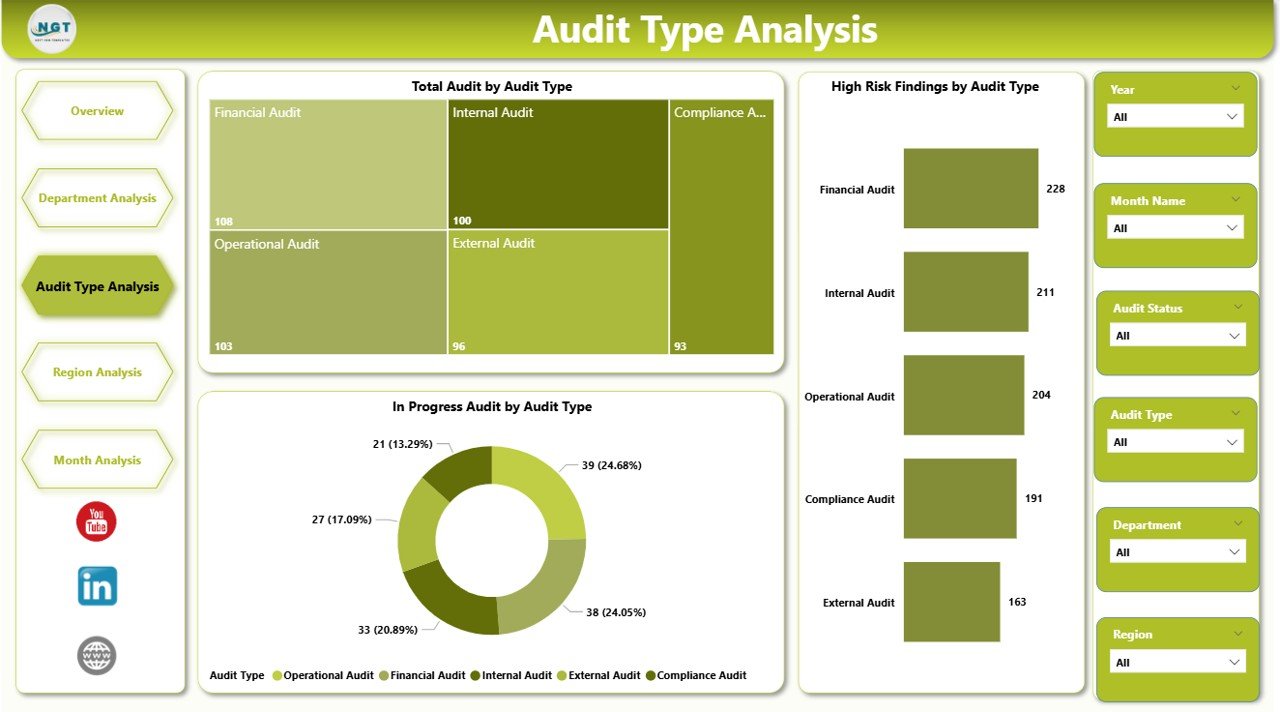
Organizations conduct various audit types such as internal audits, compliance audits, operational audits, and financial audits.
The Audit Type Analysis page helps users evaluate performance based on audit categories.
Charts Included:
-
Total Audit by Audit Type
-
High Risk Findings by Audit Type
-
Average Audit Duration Days by Audit Type
Because different audit types carry different complexities, analyzing them separately improves planning accuracy.
4️⃣ Region Analysis – Geographic Audit Visibility
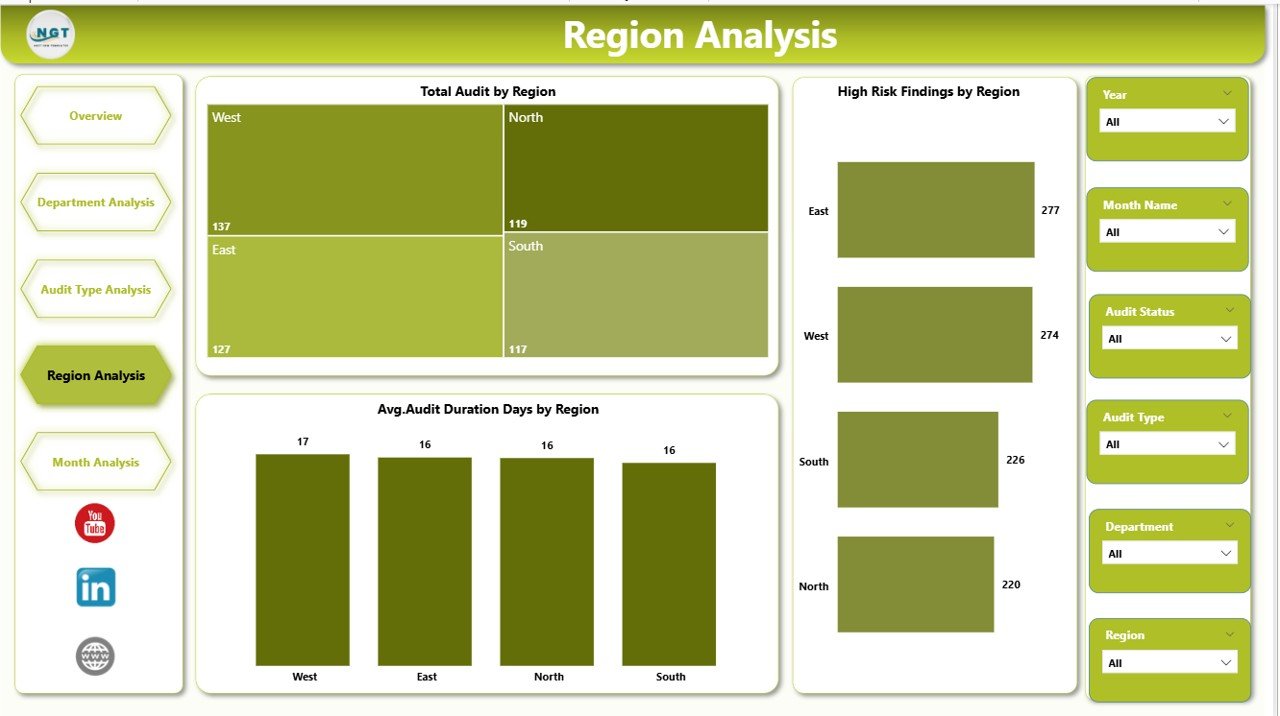
Large organizations operate across multiple regions. Therefore, regional performance tracking becomes essential.
The Region Analysis Dashboard provides geographic insights.
Charts Included:
-
Total Audit by Region
-
High Risk Findings by Region
-
Average Audit Duration Days by Region
This page helps leadership understand whether compliance challenges occur in specific locations.
Click to Purchases Financial Auditing Dashboard in Power BI
Benefits
-
Detect regional compliance gaps
-
Allocate audit resources effectively
-
Improve global governance strategy
5️⃣ Month Analysis – Trend Monitoring Over Time
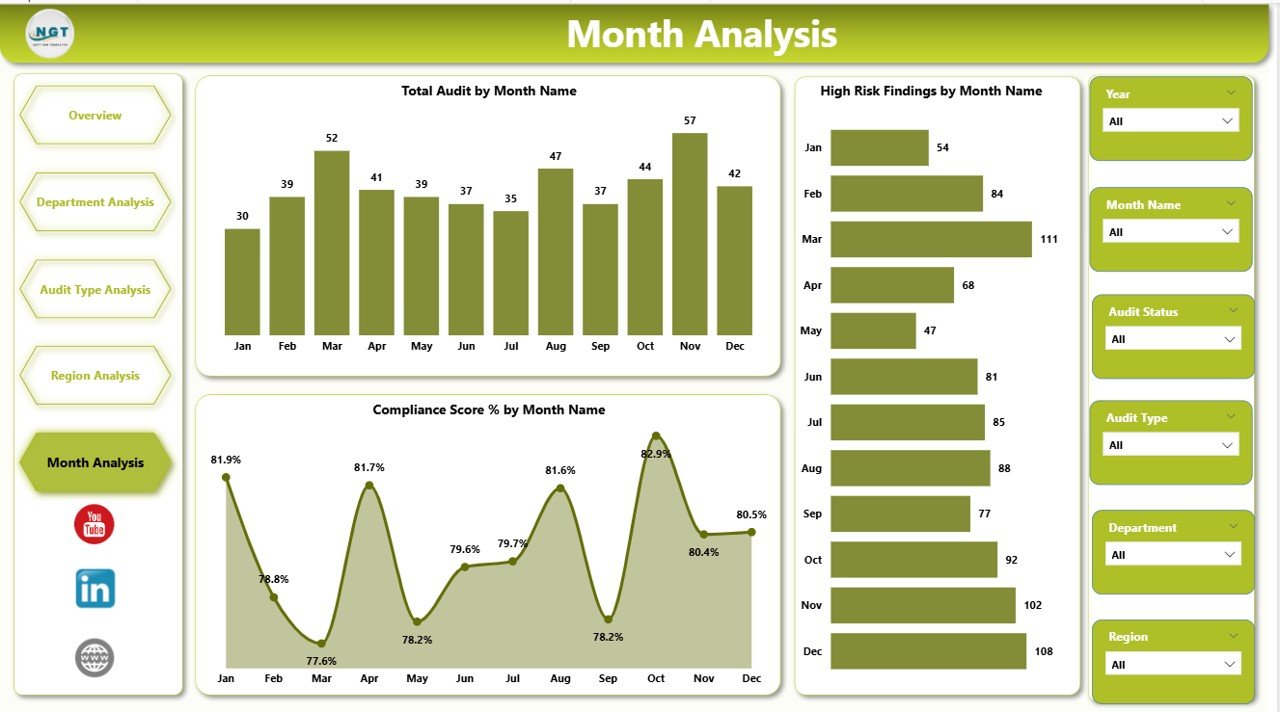
Trend analysis plays a critical role in auditing. Organizations must evaluate performance over time instead of relying on static snapshots.
The Month Analysis Page includes:
-
Total Audit by Month
-
High Risk Findings by Month
-
Compliance Score % by Month
Because trends reveal patterns, organizations can forecast risks and plan preventive actions.
How Does Power BI Improve Financial Auditing?
Power BI transforms auditing from reactive reporting into proactive management.
Key Improvements
-
Real-time analytics instead of manual reports
-
Automated data refresh
-
Interactive filtering and drill-down analysis
-
Visual storytelling using charts and KPIs
Moreover, auditors spend less time preparing reports and more time analyzing insights.
Advantages of Financial Auditing Dashboard in Power BI
Organizations experience significant improvements after adopting this dashboard.
✅ Better Decision Making
Managers access insights instantly, therefore they act faster.
✅ Increased Transparency
Stakeholders view audit status clearly across departments and regions.
✅ Improved Risk Management
High-risk findings appear visually, which enables quick corrective actions.
✅ Time Savings
Automation reduces manual reporting effort.
✅ Enhanced Compliance Monitoring
Teams track compliance performance continuously.
✅ Standardized Reporting
All departments follow consistent audit measurement criteria.
What KPIs Should a Financial Auditing Dashboard Track?
Click to Purchases Financial Auditing Dashboard in Power BI
A strong audit dashboard focuses on measurable performance indicators.
Common Audit KPIs
-
Audit Completion Rate
-
Audit Duration (Days)
-
High Risk Findings Count
-
Compliance Score %
-
Corrective Action Status
-
Audit Coverage Ratio
-
Issue Resolution Time
These KPIs help organizations measure audit efficiency objectively.
How to Implement a Financial Auditing Dashboard in Power BI?
Implementation becomes easier when organizations follow a structured approach.
Step 1: Define Audit Objectives
First, identify what you want to measure:
-
Risk monitoring
-
Compliance tracking
-
Audit efficiency
Step 2: Collect Data Sources
Gather data from:
-
Audit management systems
-
ERP software
-
Compliance tools
-
Excel audit logs
Step 3: Prepare Data
Clean and standardize audit fields such as:
-
Department
-
Region
-
Audit Type
-
Risk Level
Step 4: Build Data Model in Power BI
Create relationships between tables for accurate reporting.
Step 5: Design Dashboard Pages
Develop pages similar to:
-
Overview
-
Department Analysis
-
Audit Type Analysis
-
Region Analysis
-
Monthly Analysis
Step 6: Publish and Share
Finally, publish the dashboard to Power BI Service for organizational access.
How Does This Dashboard Help Audit Managers?
Audit managers require clarity and speed. This dashboard delivers both.
Managers Can:
-
Track ongoing audits instantly
-
Identify delayed audits
-
Compare performance across units
-
Monitor compliance trends
-
Reduce reporting workload
As a result, audit leaders focus more on strategy rather than administration.
Best Practices for the Financial Auditing Dashboard in Power BI
To achieve maximum value, organizations should follow proven practices.
✔ Use Standardized KPI Definitions
Maintain consistent calculation logic across reports.
✔ Keep Visuals Simple
Avoid overcrowded visuals. Clear dashboards improve understanding.
✔ Update Data Regularly
Schedule automatic refresh to maintain accuracy.
✔ Focus on Actionable Metrics
Track KPIs that drive decisions, not unnecessary data.
✔ Use Interactive Filters
Allow users to analyze by department, region, and audit type.
✔ Monitor Trends Continuously
Compare monthly performance to identify improvements.
How Does the Dashboard Support Compliance and Governance?
Compliance requires continuous monitoring rather than periodic reviews.
The dashboard supports governance by:
-
Highlighting unresolved audit findings
-
Monitoring corrective actions
-
Tracking compliance scores monthly
-
Providing audit evidence visually
Therefore, organizations strengthen internal controls effectively.
Who Can Benefit from This Dashboard?
Click to Purchases Financial Auditing Dashboard in Power BI
Many professionals gain value from the Financial Auditing Dashboard.
Ideal Users
-
Internal Audit Teams
-
Finance Managers
-
Compliance Officers
-
Risk Management Teams
-
CFOs and Executives
-
Corporate Governance Departments
Because the dashboard simplifies complex data, both technical and non-technical users can use it easily.
Future of Financial Auditing with Power BI
Financial auditing continues to evolve rapidly. Organizations increasingly adopt analytics-driven auditing methods.
Emerging Trends
-
Predictive risk analytics
-
AI-assisted auditing
-
Continuous auditing models
-
Automated compliance monitoring
Power BI integrates smoothly with modern analytics tools, therefore it supports future audit transformation.
Common Mistakes to Avoid When Creating Audit Dashboards
Even powerful tools require proper design.
Avoid These Errors
-
Using too many visuals on one page
-
Ignoring data validation
-
Tracking irrelevant KPIs
-
Lack of user training
-
Poor data structure
When teams avoid these mistakes, dashboard adoption improves significantly.
How Does Monthly Trend Analysis Improve Audit Strategy?
Monthly tracking provides deeper insights than static reports.
Organizations can:
-
Detect rising risk patterns early
-
Measure compliance improvement over time
-
Evaluate audit efficiency trends
-
Plan resource allocation better
Consequently, auditing becomes proactive rather than reactive.
Conclusion
The Financial Auditing Dashboard in Power BI transforms traditional audit management into a modern, data-driven process. Instead of reviewing disconnected reports, organizations gain a unified platform that delivers clarity, speed, and actionable insights.
Because the dashboard includes Overview, Department Analysis, Audit Type Analysis, Region Analysis, and Month Analysis pages, users receive a complete picture of audit performance. Moreover, interactive visuals help leaders identify risks quickly and improve compliance strategies.
As organizations continue to prioritize transparency and governance, adopting a Power BI audit dashboard becomes not only beneficial but essential. Therefore, companies that leverage analytics today will build stronger, more resilient audit systems tomorrow.
Frequently Asked Questions (FAQs)
1. What is a Financial Auditing Dashboard in Power BI used for?
It helps organizations monitor audit performance, track risks, analyze compliance, and visualize audit KPIs in an interactive format.
2. Can small businesses use this dashboard?
Yes. Small and medium businesses can use it to track audits efficiently without complex systems.
3. Does the dashboard update automatically?
Yes. Power BI allows scheduled data refresh for real-time reporting.
4. Which data sources can connect to Power BI?
You can connect Excel, SQL databases, ERP systems, cloud platforms, and many other sources.
5. How does the dashboard improve compliance?
It highlights risks, tracks corrective actions, and monitors compliance scores continuously.
6. Is technical knowledge required to use the dashboard?
No. Users can interact with slicers and visuals easily without advanced technical skills.
7. Can the dashboard be customized?
Yes. Organizations can modify KPIs, visuals, and filters according to audit requirements.
Visit our YouTube channel to learn step-by-step video tutorials