Managing fitness and wellness data becomes challenging when information stays scattered across multiple sheets and files. However, a Fitness and Wellness Dashboard in Excel brings everything together in one structured, visual, and easy-to-use format. As a result, fitness managers, gym owners, trainers, and wellness coordinators gain instant clarity on member participation, program effectiveness, trainer performance, and revenue trends.
In this detailed guide, you will learn what a Fitness and Wellness Dashboard in Excel is, why it matters, how it works, its page-wise structure, key features, advantages, opportunities for improvement, best practices, and frequently asked questions. Moreover, this article uses simple language, smooth transitions, and practical explanations so you can apply the ideas immediately.
Click to Purchases Fitness and Wellness Dashboard in Excel
What Is a Fitness and Wellness Dashboard in Excel?
A Fitness and Wellness Dashboard in Excel is a ready-to-use analytical tool designed to track, analyze, and visualize health and fitness-related data in one Excel file. Instead of reviewing raw rows of data, users view meaningful insights through charts, KPIs, and interactive slicers.
Moreover, this dashboard converts daily operational data into actionable insights. Therefore, decision-makers no longer rely on guesswork. Instead, they use real-time visuals to understand attendance trends, satisfaction levels, calories burned, workout hours, and membership revenue.
Why Do Fitness and Wellness Organizations Need a Dashboard in Excel?
Fitness centers and wellness programs generate large volumes of data every day. However, data alone does not help unless teams analyze it properly. That is exactly why a Fitness and Wellness Dashboard in Excel becomes essential.
Key reasons why this dashboard matters:
-
It centralizes all fitness and wellness data in one file
-
It reduces manual reporting time significantly
-
It improves decision-making with visual insights
-
It helps track performance across programs, trainers, locations, and months
-
It supports strategic planning and operational improvements
Furthermore, Excel-based dashboards remain cost-effective and flexible. Therefore, small gyms as well as large wellness organizations can use them without investing in expensive software.
How Does a Fitness and Wellness Dashboard in Excel Work?
The dashboard works by connecting structured data from a Data Sheet to pivot tables, charts, and slicers. Then, Excel updates all visuals automatically when users change filters.
Typical workflow:
-
Enter or update data in the Data Sheet
-
Refresh pivot tables (if required)
-
Use slicers to filter by month, gender, program, trainer, or location
-
Instantly view updated charts and KPIs
As a result, users spend less time preparing reports and more time analyzing performance.
What Are the Key Features of a Fitness and Wellness Dashboard in Excel?
This dashboard includes several thoughtfully designed features that improve usability and insight quality.
1. Page Navigator for Easy Navigation
The Page Navigator, located on the left side, allows users to move seamlessly between different analysis pages. Therefore, users do not waste time scrolling or searching for sheets.
2. Interactive Slicers on Every Page
Each analytical page includes right-side slicers. Consequently, users can filter data by month, program type, trainer, location, or gender without changing the layout.
3. KPI Cards for Instant Insights
The dashboard uses KPI cards on the Overview page to highlight key numbers at a glance. Thus, decision-makers quickly understand performance status.
What Pages Are Included in the Fitness and Wellness Dashboard in Excel?
This dashboard contains five analytical pages, each focusing on a specific performance area.
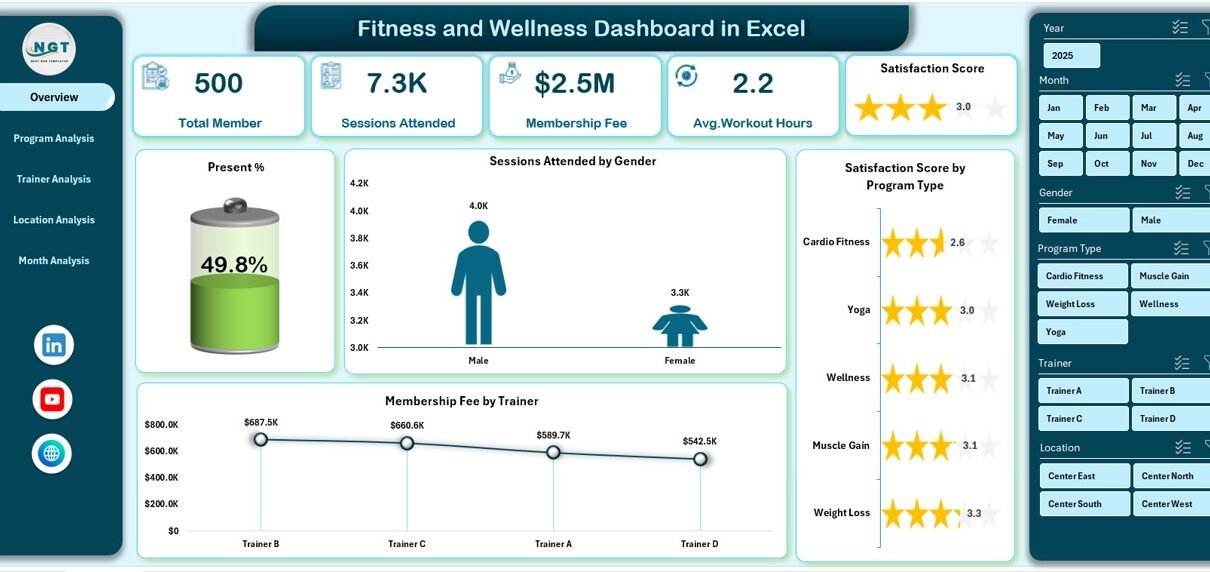
1. Overview Page: What Is Happening at a Glance?
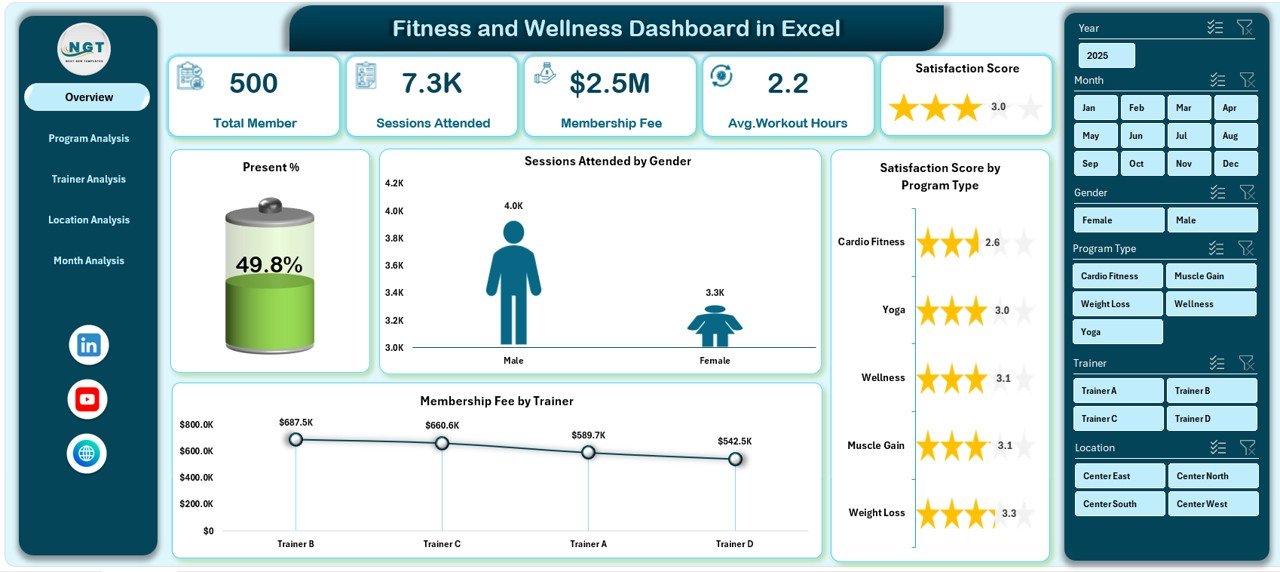
The Overview Page serves as the central summary of the entire dashboard. It provides a high-level snapshot of fitness and wellness performance.
Key elements of the Overview Page:
-
Right-side slicers for quick filtering
-
Four KPI cards for instant metrics
-
Four insightful charts
Charts included:
-
Present % – shows attendance rate
-
Session Attended by Gender – compares male and female participation
-
Satisfaction Score by Program Type – highlights member feedback
-
Membership Fee by Trainer – tracks revenue contribution
Because of this structure, users immediately understand overall engagement, satisfaction, and revenue trends.
Click to Purchases Fitness and Wellness Dashboard in Excel
2. Program Analysis Page: Which Programs Perform Best?
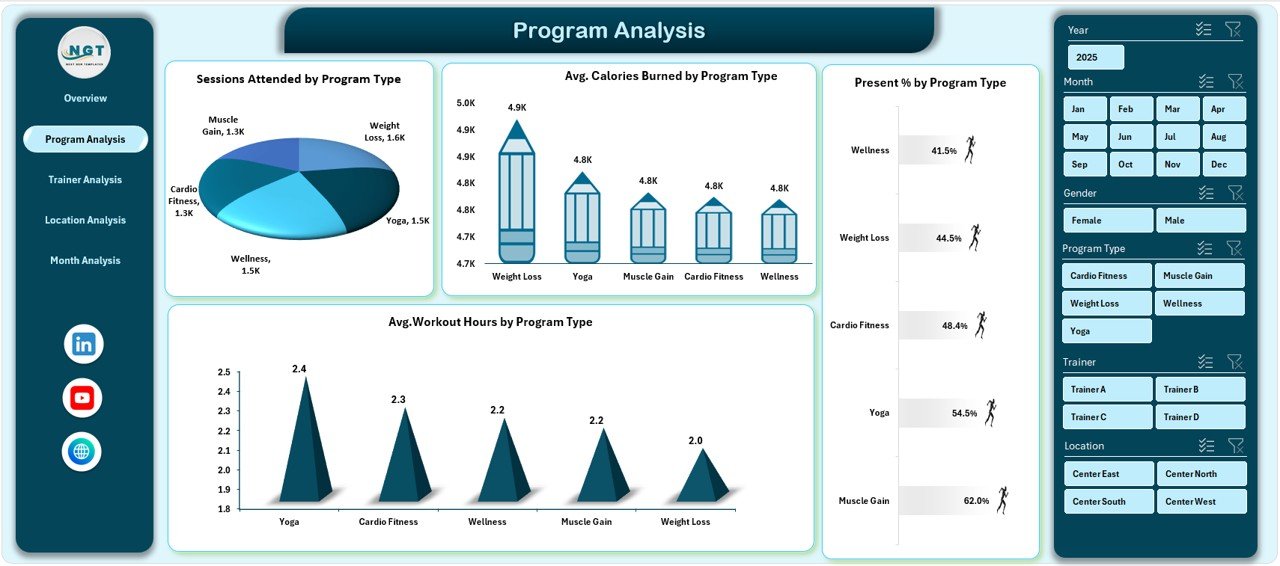
The Program Analysis Page focuses on evaluating fitness programs. Therefore, managers can identify high-performing and underperforming programs.
Charts included:
-
Operating Session Attended by Program Type
-
Average Calories Burned by Program Type
-
Present % by Program Type
-
Average Workout Hours by Program Type
With these insights, organizations can refine program offerings, adjust schedules, and allocate resources more effectively.
3. Trainer Analysis Page: How Do Trainers Impact Performance?
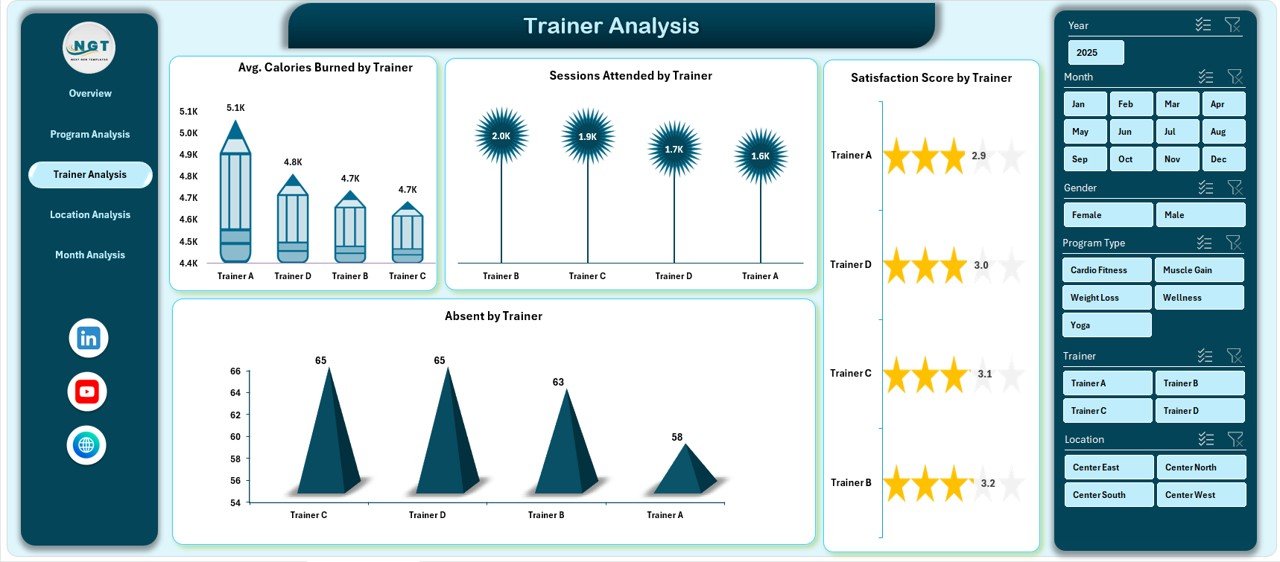
The Trainer Analysis Page evaluates trainer performance using attendance, satisfaction, and fitness outcomes.
Charts included:
-
Average Calories Burned by Trainer
-
Session Attendance by Trainer
-
Satisfaction Score by Trainer
-
Absent by Trainer
As a result, managers can reward top performers, identify training needs, and improve trainer allocation.
4. Location Analysis Page: Which Locations Deliver Better Results?
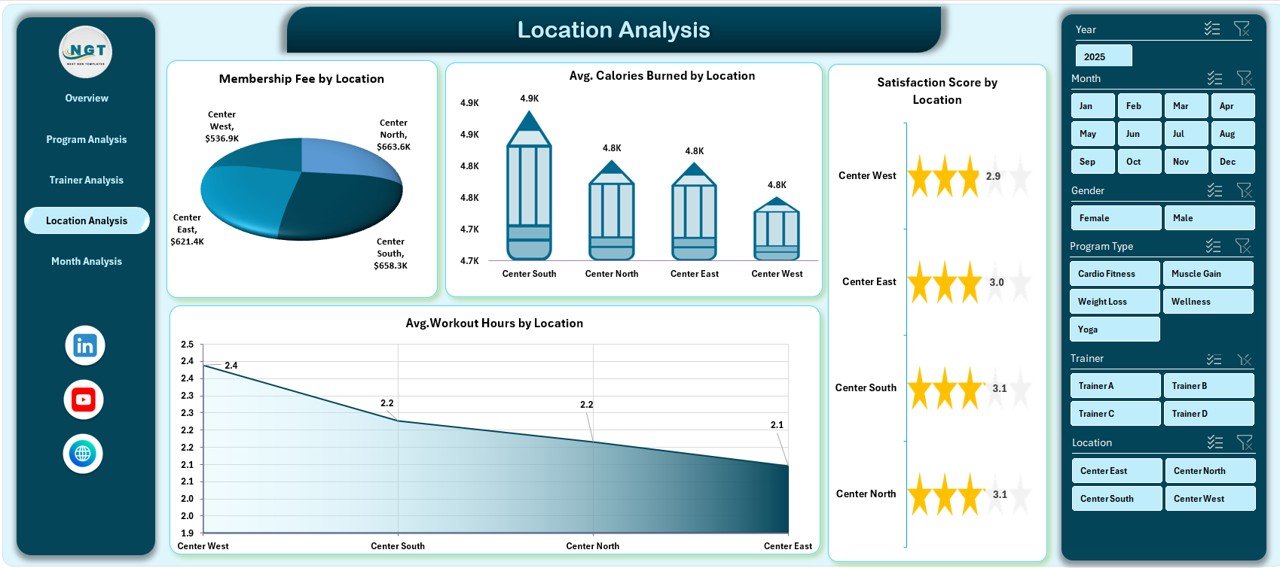
The Location Analysis Page compares performance across different gym or wellness locations.
Charts included:
-
Membership Fee by Location
-
Average Calories Burned by Location
-
Satisfaction Score by Location
-
Average Workout Hours by Location
Therefore, leadership teams can understand which locations perform well and which need improvement.
Click to Purchases Fitness and Wellness Dashboard in Excel
5. Month Analysis Page: How Does Performance Change Over Time?
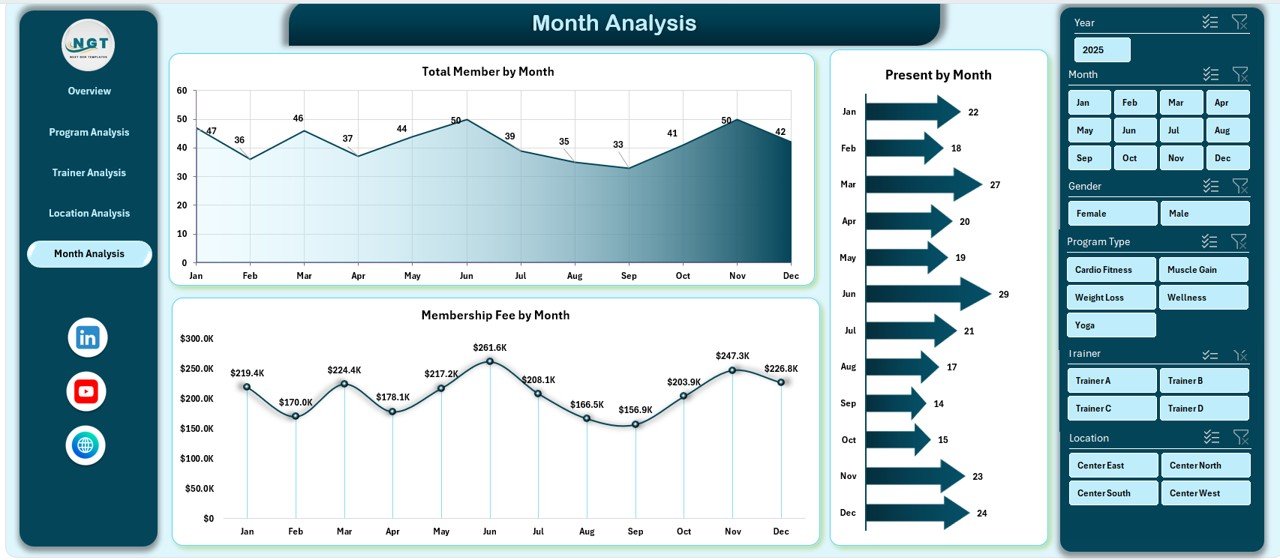
The Month Analysis Page tracks trends across months. Hence, organizations can identify seasonal patterns and growth opportunities.
Charts included:
-
Total Members by Month
-
Present by Month
-
Membership Fee by Month
This page supports forecasting, budgeting, and long-term planning.
What Role Do the Data Sheet and Support Sheet Play?
Data Sheet
The Data Sheet acts as the backbone of the dashboard. It stores all raw data such as:
-
Member details
-
Program type
-
Trainer name
-
Location
-
Attendance status
-
Calories burned
-
Workout hours
-
Satisfaction score
-
Membership fee
-
Month and date
Because the data stays structured, pivot tables and charts work smoothly.
Support Sheet
The Support Sheet stores helper tables, mappings, and calculation logic. Therefore, it keeps the dashboard clean and organized.
Advantages of Fitness and Wellness Dashboard in Excel
A Fitness and Wellness Dashboard in Excel offers several strong advantages.
Key advantages explained:
-
Centralized reporting: All insights appear in one file
-
Time-saving: Reduces manual report preparation
-
Visual clarity: Charts make trends easy to understand
-
Better decisions: Data-driven insights replace assumptions
-
Scalable: Supports future data growth
-
Cost-effective: No expensive tools required
Moreover, Excel dashboards remain customizable. Hence, users can adapt them to specific business needs.
Opportunities for Improvement in Fitness and Wellness Dashboard in Excel
Although the dashboard delivers strong insights, continuous improvement always helps.
Improvement opportunities include:
-
Adding goal or target benchmarks
-
Including year-over-year comparisons
-
Automating data refresh using Power Query
-
Enhancing visuals with conditional formatting
-
Integrating wearable or app-based fitness data
By applying these improvements, organizations can extract even more value from the dashboard.
Click to Purchases Fitness and Wellness Dashboard in Excel
Best Practices for the Fitness and Wellness Dashboard in Excel
Following best practices ensures long-term success and usability.
Best practices you should follow:
-
Keep the Data Sheet clean and consistent
-
Use standardized naming conventions
-
Refresh pivot tables regularly
-
Limit the number of slicers per page
-
Focus on actionable metrics
-
Use clear chart titles and labels
-
Protect formulas and structure
As a result, the dashboard stays reliable, accurate, and user-friendly.
What Challenges Do Users Face While Using Fitness Dashboards in Excel?
Even with a strong dashboard, some challenges may appear.
Common challenges:
-
Poor data quality
-
Inconsistent data entry
-
Overloaded visuals
-
Lack of user training
However, clear processes and simple design help overcome these challenges quickly.
How Can This Dashboard Support Better Decision-Making?
This dashboard supports smarter decisions by:
-
Highlighting attendance gaps
-
Identifying popular programs
-
Measuring trainer impact
-
Comparing location performance
-
Tracking revenue trends
Therefore, leaders can act faster and with more confidence.
Conclusion: Why Should You Use a Fitness and Wellness Dashboard in Excel?
A Fitness and Wellness Dashboard in Excel transforms raw fitness data into meaningful insights. Instead of juggling multiple reports, users gain one powerful view of performance, engagement, satisfaction, and revenue.
Moreover, the five-page structure ensures focused analysis across programs, trainers, locations, and time periods. When organizations use this dashboard effectively, they improve operational efficiency, member satisfaction, and financial outcomes.
In short, this dashboard acts as a single source of truth for fitness and wellness performance.
Frequently Asked Questions (FAQs)
1. What is the main purpose of a Fitness and Wellness Dashboard in Excel?
The main purpose is to track, analyze, and visualize fitness performance, attendance, satisfaction, and revenue in one place.
2. Who can use a Fitness and Wellness Dashboard in Excel?
Gym owners, fitness managers, wellness coordinators, trainers, and analysts can all use this dashboard.
3. Does this dashboard require advanced Excel skills?
No, basic Excel knowledge is enough to use and update the dashboard.
4. Can I customize the dashboard based on my needs?
Yes, Excel dashboards allow full customization of charts, metrics, and layout.
5. How often should I update the data?
You should update the data regularly, preferably daily or weekly, to keep insights accurate.
6. Can this dashboard handle large datasets?
Yes, with proper structure and optimization, Excel dashboards can handle large datasets efficiently.
Visit our YouTube channel to learn step-by-step video tutorials