Fitness & Wellness KPI Dashboard in Power BI In today’s fast-paced world, health and wellness have become top priorities. Fitness & Wellness KPI Dashboard in Power BI Whether you manage a gym, wellness center, or corporate fitness program, tracking performance is essential to improving outcomes. However, managing hundreds of data points — from memberships and sessions to satisfaction scores and revenue — can be overwhelming without an efficient tool.
That’s where the Fitness & Wellness KPI Dashboard in Power BI comes in. This ready-to-use, interactive dashboard helps you visualize your key performance indicators (KPIs), measure progress, and make data-driven decisions with ease.
It combines the power of Microsoft Power BI with clean, structured Excel data to deliver real-time insights into fitness operations, member engagement, and business growth.
Click to Purchases Fitness & Wellness KPI Dashboard in Power BI
What Is a Fitness & Wellness KPI Dashboard in Power BI?
A Fitness & Wellness KPI Dashboard is a Power BI–based performance management tool designed to monitor and evaluate the key metrics that define success in the health and fitness industry.
It transforms raw Excel data into powerful visuals and insights. You can track performance across different departments such as membership, finance, operations, and client satisfaction — all from one interactive dashboard.
This dashboard is perfect for gym owners, personal trainers, corporate wellness managers, and fitness franchise executives who want to improve efficiency and accountability.
Why Fitness & Wellness Businesses Need a KPI Dashboard
The fitness industry runs on numbers — revenue per client, retention rates, class attendance, trainer utilization, and more. Without visibility into these KPIs, it’s difficult to identify what’s working and where improvement is needed.
A Fitness & Wellness KPI Dashboard enables you to:
-
Monitor your organization’s overall performance in real time.
-
Compare actual results with targets and previous years.
-
Identify patterns and trends that affect profitability.
-
Measure client engagement and satisfaction effectively.
-
Make faster, more accurate business decisions.
With this dashboard, you no longer rely on guesswork — every action is guided by data.
Key Features of the Fitness & Wellness KPI Dashboard in Power BI
This Power BI dashboard includes three interactive pages that deliver a complete view of your business performance — from summary insights to detailed KPI trends. It is powered by an Excel data source containing Actuals, Targets, and KPI Definitions.
Let’s explore each page in detail.
1️⃣ Summary Page
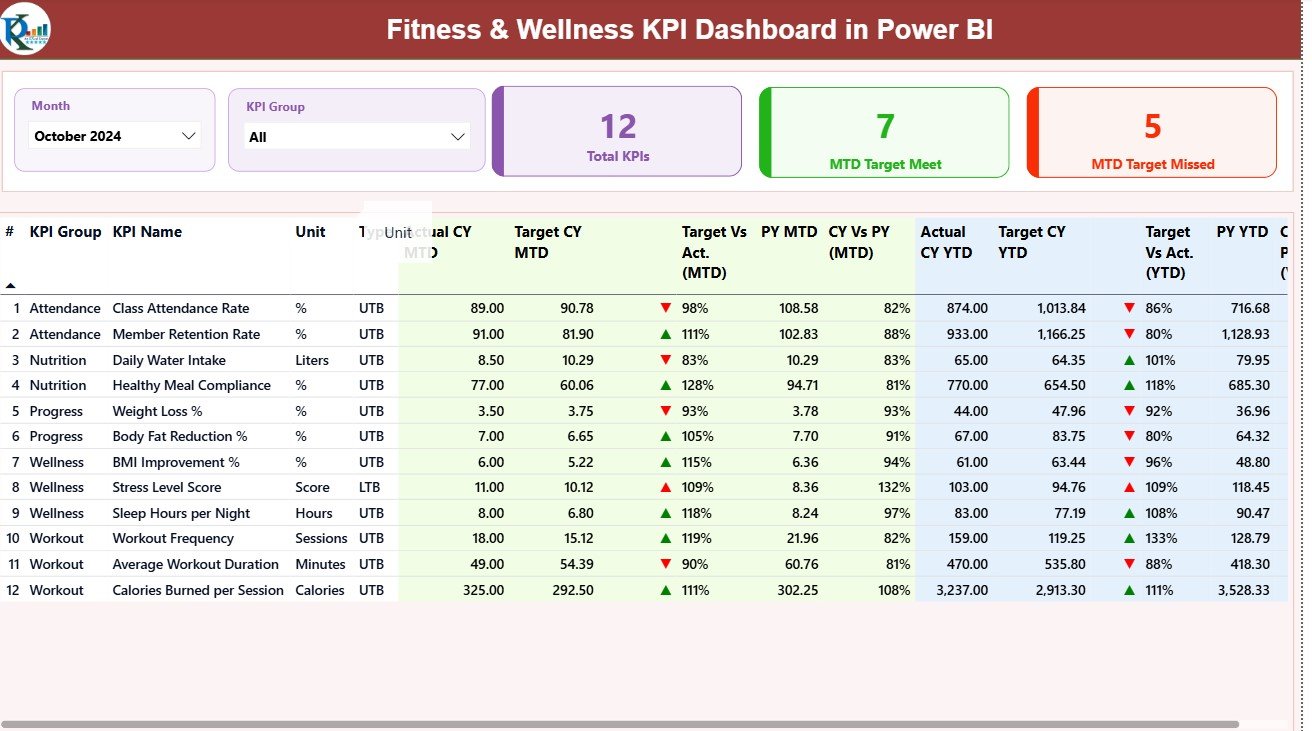
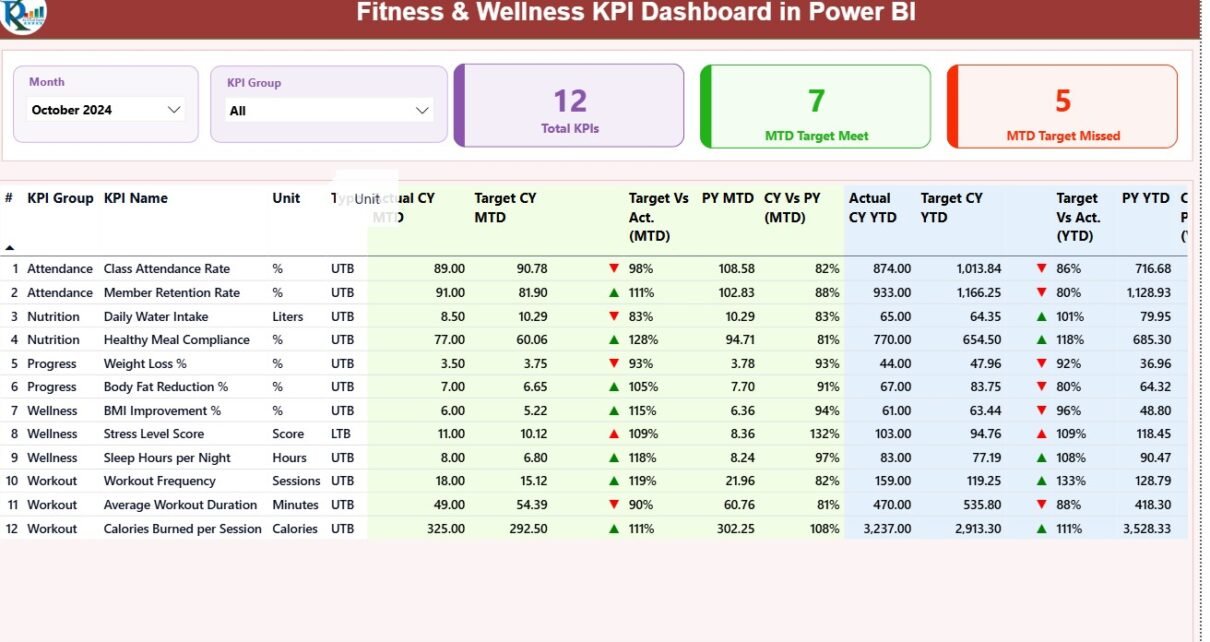
The Summary Page is the main view of the dashboard. It provides a high-level overview of all your KPIs, giving instant insight into what’s performing well and what needs attention.
Key highlights include:
-
Month & KPI Group Slicers: Located at the top, these filters allow you to view specific time periods or focus on a particular KPI group (e.g., Finance, Operations, Membership).
-
Three Key Cards:
-
Total KPIs Count – Displays the total number of KPIs being tracked.
-
MTD Target Met Count – Shows how many KPIs have achieved their monthly targets.
-
MTD Target Missed Count – Displays the count of KPIs that are below target.
-
-
Detailed Table View:
The main section presents a structured table including:-
KPI Number
-
KPI Group
-
KPI Name
-
Unit of Measurement
-
KPI Type (LTB – Lower the Better or UTB – Upper the Better)
-
Actual CY MTD vs Target CY MTD: With up/down icons (▲/▼) in green and red colors indicating performance.
-
Target vs Actual (MTD %) and CY vs PY (MTD %) comparisons.
-
Actual CY YTD vs Target CY YTD: Along with corresponding arrows and variance percentages.
-
This layout provides a clear snapshot of month-to-date and year-to-date results for every KPI.
2️⃣ KPI Trend Page
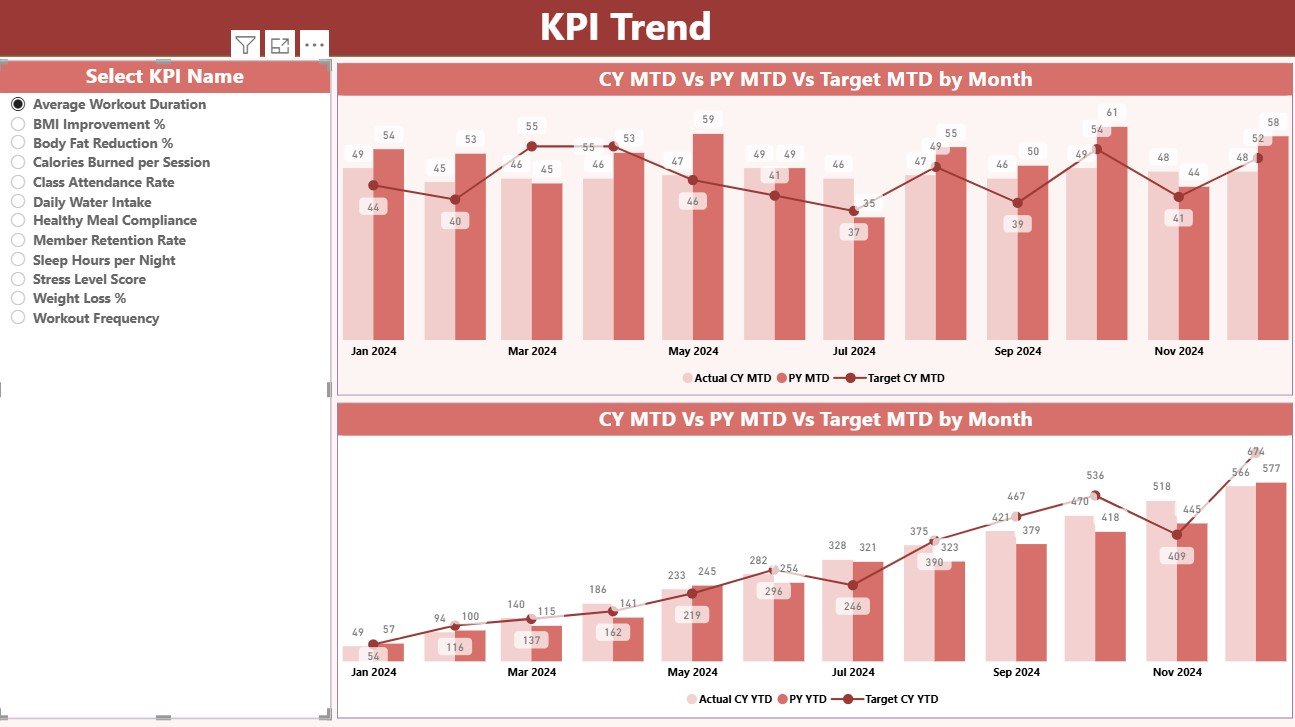
The KPI Trend Page offers a deeper dive into performance trends.
Features include:
-
Slicer for KPI Name: Select a specific KPI from the left-side slicer to analyze its performance.
-
Combo Charts: Two dynamic combo charts display Actual, Target, and Previous Year numbers for both MTD and YTD.
-
Visual Comparison: You can see progress at a glance — whether performance is improving, stable, or declining.
This page helps management and trainers identify key areas where strategy adjustments are needed.
3️⃣ KPI Definition Page
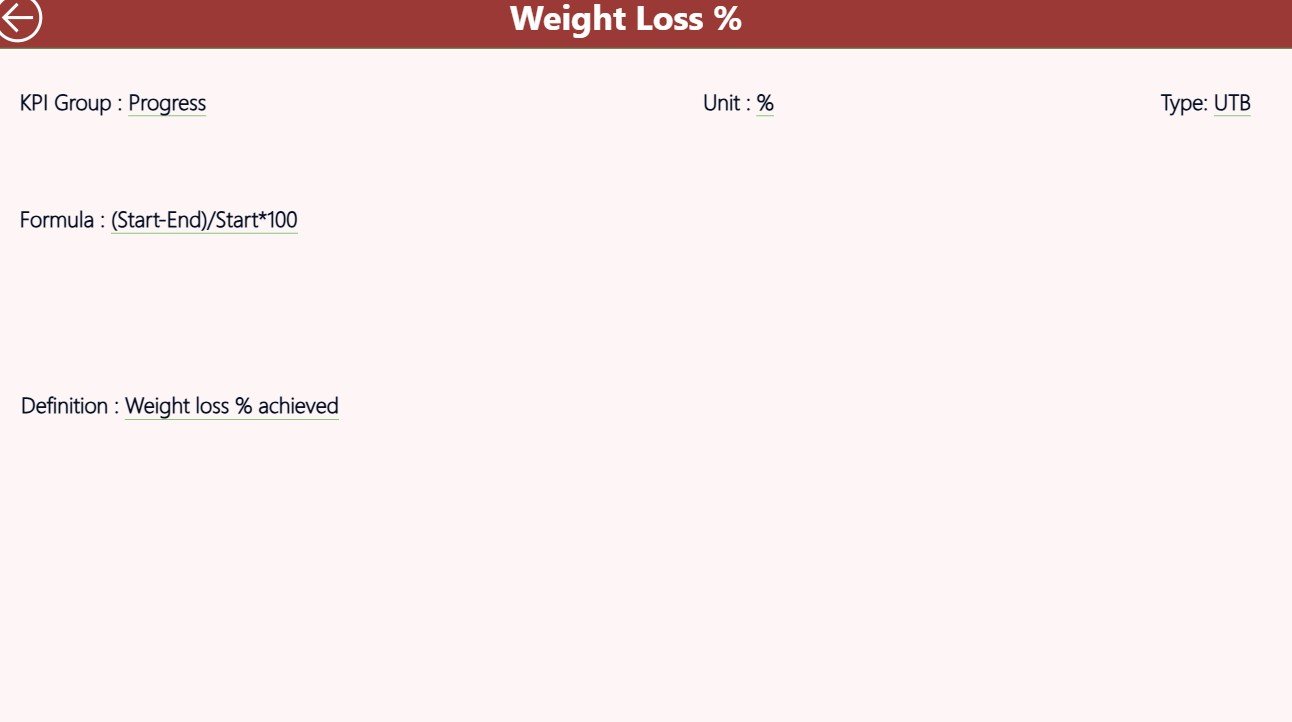
The KPI Definition Page is a hidden drill-through page that stores detailed information about each KPI.
You can access it by right-clicking on a KPI in the Summary Page and selecting Drill Through.
Data includes:
-
KPI Formula
-
KPI Definition
-
Measurement Unit
-
Type (LTB or UTB)
This page adds context to your metrics, ensuring that everyone understands what each KPI measures and how it’s calculated.
Click to Purchases Fitness & Wellness KPI Dashboard in Power BI
Excel Data Source Structure
The Power BI dashboard is powered by an Excel workbook containing three structured sheets.
1️⃣ Input_Actual Sheet
Enter the Actual data for each KPI:
-
Columns include KPI Name, Month (first date of the month), MTD, and YTD numbers.
2️⃣ Input_Target Sheet
Enter the Target data for each KPI:
-
Similar to the Actual sheet, with columns for KPI Name, Month, MTD, and YTD values.
3️⃣ KPI Definition Sheet
Document your KPIs here, including:
-
KPI Number, Group, Name, Unit, Formula, Definition, and Type (UTB/LTB).
Once data is entered, Power BI automatically updates visuals through data refresh.
Example KPIs for Fitness & Wellness Dashboard
You can customize this dashboard with KPIs relevant to your business model.
🏋️♀️ Operational KPIs
-
Member Attendance Rate (%)
-
Class Utilization (%)
-
Trainer Efficiency Score
-
Equipment Downtime (Hours)
💰 Financial KPIs
-
Monthly Revenue
-
Average Revenue per Member
-
Membership Retention Rate (%)
-
Cost per Session
💬 Customer KPIs
-
Member Satisfaction Score
-
Net Promoter Score (NPS)
-
Feedback Response Rate (%)
-
Referral Conversion Rate (%)
🧑🏫 Training KPIs
-
Sessions Conducted per Trainer
-
Trainer Rating (%)
-
Average Workout Duration (Minutes)
-
Cancellation Rate (%)
By combining these KPIs, fitness centers and wellness organizations gain a 360° understanding of both operational and customer success.
How to Use the Fitness & Wellness KPI Dashboard
Here’s a step-by-step guide to using the dashboard effectively:
-
Update the Excel Source File: Add your actual and target data monthly.
-
Refresh Data in Power BI: Connect the dashboard to the Excel file and refresh to update visuals.
-
Select Month & KPI Group: Use slicers to filter results for specific time frames.
-
Review the Summary Page: Identify which KPIs are on track and which need improvement.
-
Drill Down for Details: Use the KPI Trend and Definition pages to analyze deeper insights.
-
Share with Stakeholders: Publish the report to Power BI Service and share live dashboards with your team.
This process ensures continuous tracking and real-time reporting.
Advantages of the Fitness & Wellness KPI Dashboard in Power BI
✅ 1. Real-Time Data Visualization
Monitor your fitness business performance live — from any device.
✅ 2. Comprehensive Insights
View MTD, YTD, and previous year comparisons to track both short- and long-term progress.
✅ 3. Improved Decision-Making
Understand which areas need investment, focus, or optimization instantly.
✅ 4. Automation & Accuracy
No manual calculations — Power BI automatically processes formulas and updates visuals.
✅ 5. Customization Flexibility
Easily modify KPIs, add visuals, or connect other data sources (e.g., CRM, billing software).
✅ 6. Engaging Visuals
Use icons, colors, and charts to make data intuitive and presentation-ready.
Best Practices for the Fitness & Wellness KPI Dashboard
To get maximum value from this dashboard, follow these best practices:
🎯 Align KPIs with Goals: Ensure each KPI supports your fitness center’s strategy.
📅 Refresh Data Monthly: Keep insights current for actionable decisions.
📊 Use Clear Visuals: Limit clutter — focus on charts and metrics that matter.
🔄 Compare Year-over-Year: Evaluate growth and consistency over time.
👥 Share with Teams: Encourage trainers and staff to review performance data.
💡 Continuously Improve: Adjust targets and KPIs as your business evolves.
How Power BI Enhances Fitness Data Analysis
Power BI is one of the most powerful tools for visual analytics. For the fitness and wellness industry, it offers unmatched benefits:
-
Interactive Dashboards: Switch between KPIs, periods, and views effortlessly.
-
Cloud Integration: Access insights anytime, anywhere via Power BI Service.
-
Drill-Through Features: Explore KPI definitions and trends directly from visuals.
-
Scalability: Manage data for one gym or an entire chain.
-
Security: Role-based access ensures only authorized users see sensitive data.
By using Power BI, fitness organizations can evolve from reactive management to proactive performance optimization.
Common Mistakes to Avoid
Avoid these errors when implementing your dashboard:
❌ Not updating Excel data regularly.
❌ Using inconsistent units or formulas.
❌ Overloading visuals with unnecessary KPIs.
❌ Ignoring trend charts and variance percentages.
❌ Failing to align KPIs with strategic goals.
Avoiding these mistakes ensures your dashboard remains accurate, insightful, and easy to interpret.
Conclusion
The Fitness & Wellness KPI Dashboard in Power BI is more than just a visual tool — it’s a strategic asset for health and fitness professionals.
By integrating data from Excel into Power BI, it transforms scattered information into a unified, interactive view of performance. Whether you’re tracking financial growth, trainer efficiency, or member satisfaction, this dashboard helps you stay focused on what truly matters — improving wellness outcomes and driving sustainable business success.
With clear visuals, automated updates, and drill-through analytics, it empowers data-driven decision-making for any fitness or wellness organization.
Click to Purchases Fitness & Wellness KPI Dashboard in Power BI
Frequently Asked Questions (FAQs)
1. What is the Fitness & Wellness KPI Dashboard in Power BI?
It’s an interactive tool designed to track and visualize key metrics related to fitness performance, operations, and member engagement.
2. What data sources does it use?
It connects to an Excel file containing Actual, Target, and KPI Definition sheets.
3. Can I customize the KPIs?
Yes. You can add new KPIs, change formulas, or modify visuals in Power BI.
4. How often should I refresh data?
You can refresh data monthly or even automate daily refresh through Power BI Service.
5. Does it support year-over-year comparison?
Absolutely. It compares both MTD and YTD data against previous year values.
6. Is it suitable for small fitness studios?
Yes, it’s scalable — perfect for individual trainers, local gyms, or large fitness chains.
7. Can I share this dashboard with my team?
Yes, by publishing it to Power BI Service, you can share interactive reports with colleagues.
Click to Purchases Fitness & Wellness KPI Dashboard in Power BI
Visit our YouTube channel to learn step-by-step video tutorials