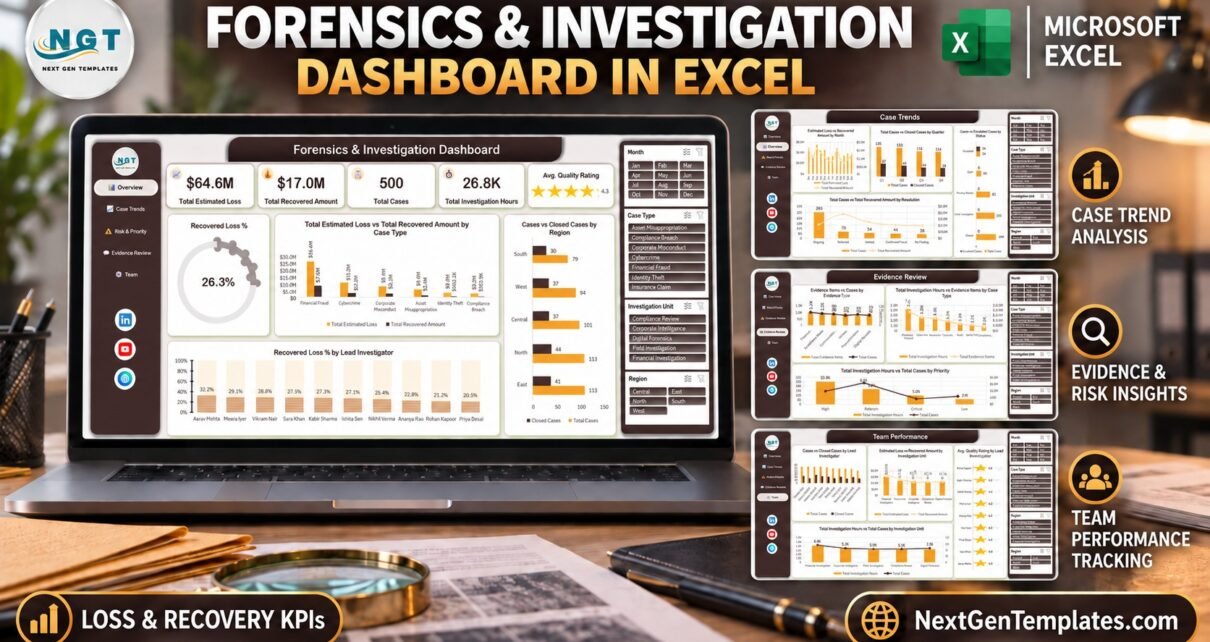
The Forensics and Investigation Dashboard in Excel reports on 500 sample case records across 5 interactive pages, 20 linked charts and 5 KPI cards, driven by 4 slicers that filter every page at once. The Data sheet holds 26 columns per case, and because every visual sits on a pivot table, swapping the sample rows for your own case log refreshes the whole workbook in one step.
Most investigation teams already keep a case log somewhere — a shared spreadsheet, an export from a ticketing tool, a list a supervisor maintains by hand. What they usually do not have is a way to answer “how much did we lose, how much did we recover, and which unit is carrying the load” without rebuilding charts every month. That is the gap this workbook fills, and it is worth being clear up front about what it is not: it is a reporting layer, not evidence-management software.
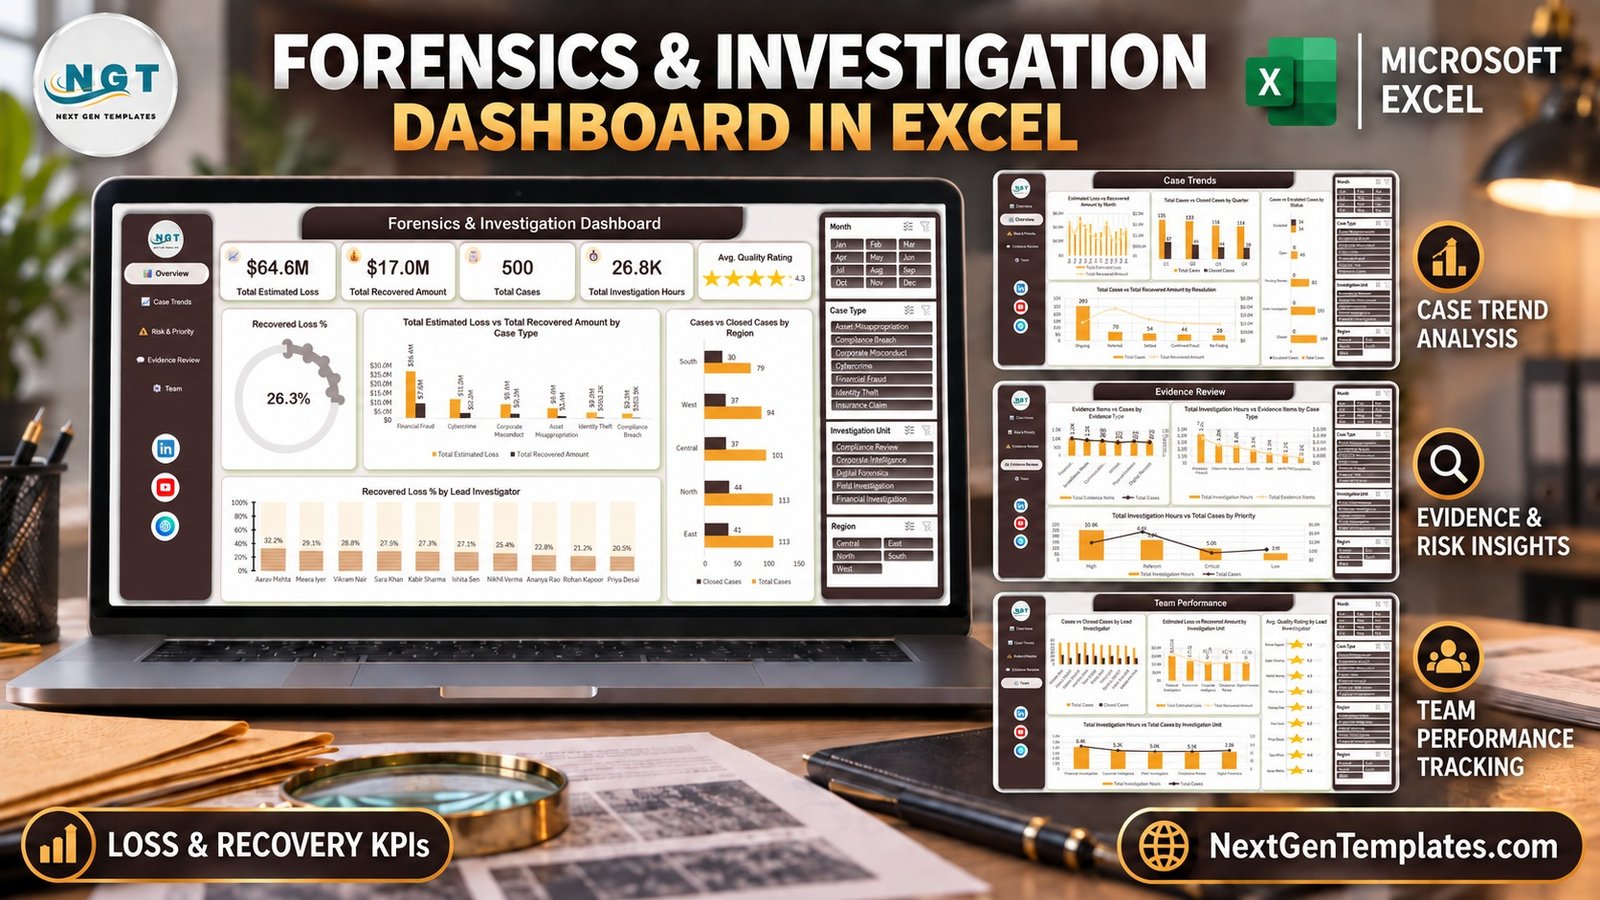
Key Features of the Forensics and Investigation Dashboard in Excel
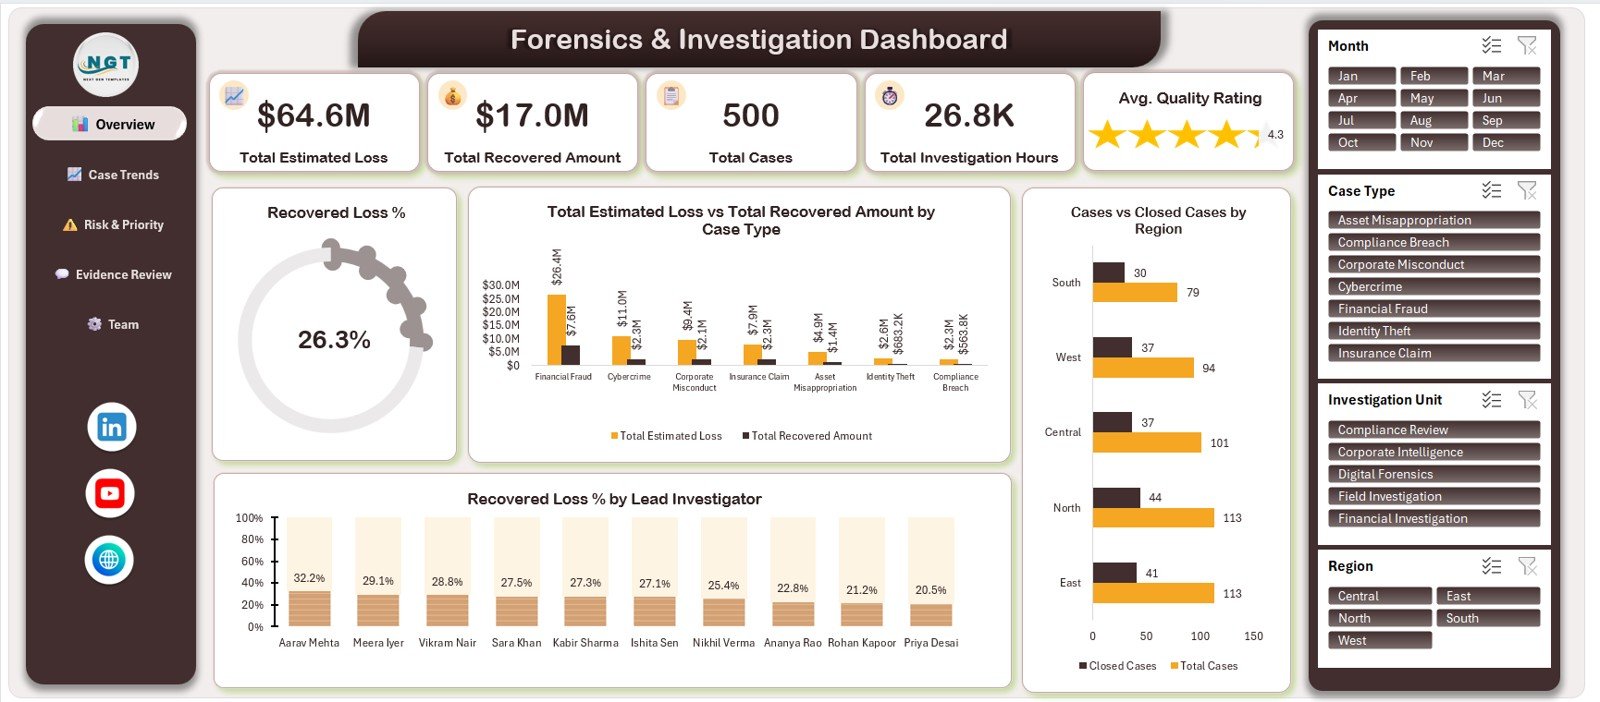
- Five KPI cards on the Overview page — Total Estimated Loss ($64.6M in the sample data), Total Recovered Amount ($17.0M), Total Cases (500), Total Investigation Hours (26.8K) and an Avg. Quality Rating of 4.3 rendered as a five-star visual. Every card is a pivot value, not a typed figure.
- Four slicers on all five pages — Month, Case Type, Investigation Unit and Region sit in a fixed right-hand panel. Selecting Cybercrime, or the West region, re-filters all 20 charts and all five cards at once.
- A left sidebar that works like app navigation — Overview, Case Trends, Risk & Priority, Evidence Review and Team Performance are one click apart.
- A Recovered Loss % measure — 26.3% across the sample data, broken out by Lead Investigator on the Overview page and by Case Type on the Risk & Priority page.
- No macros and no add-ins — the file is a plain .xlsx built on pivot tables, pivot charts and slicers, so it opens in environments where .xlsm workbooks are blocked by policy.
- Seven sheets in total — the five dashboard pages plus a Data sheet and a Support sheet, and the download bundles the Excel Dashboard user manual PDF alongside the workbook.
Dashboard Pages Explained
Page 1: Overview
The landing page carries the five KPI cards and a Recovered Loss % gauge reading 26.3%. Its charts are Total Estimated Loss vs Total Recovered Amount by Case Type, Cases vs Closed Cases by Region, and Recovered Loss % by Lead Investigator, which ranks the ten sample investigators from 32.2% down to 20.5%.
Page 2: Case Trends
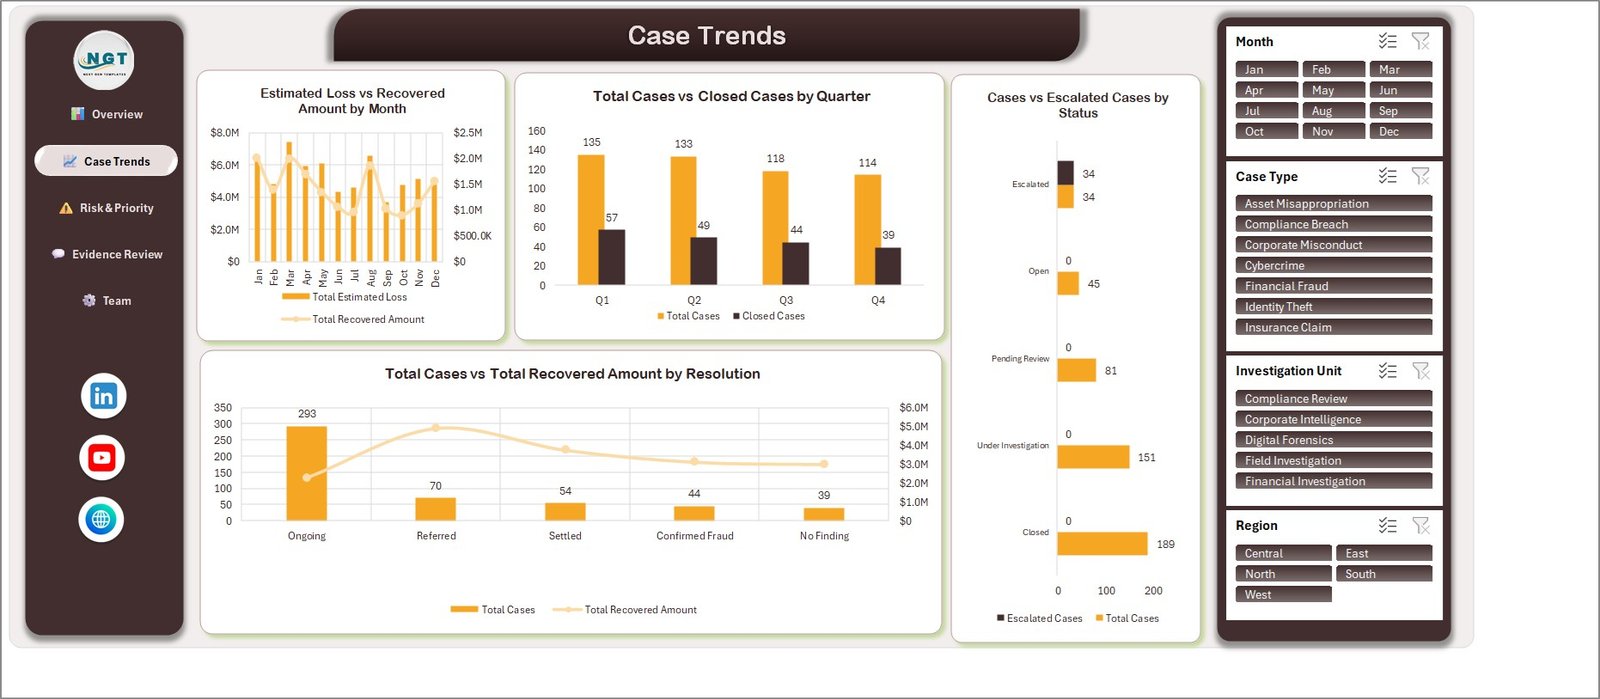
This page answers the timing questions. Estimated Loss vs Recovered Amount by Month plots the twelve-month shape of both figures; Total Cases vs Closed Cases by Quarter shows 135, 133, 118 and 114 cases from Q1 to Q4 against closures of 57, 49, 44 and 39; Cases vs Escalated Cases by Status splits the pipeline; and Total Cases vs Total Recovered Amount by Resolution shows Ongoing holding 293 of the 500 cases, ahead of Referred (70), Settled (54), Confirmed Fraud (44) and No Finding (39).
Page 3: Risk & Priority
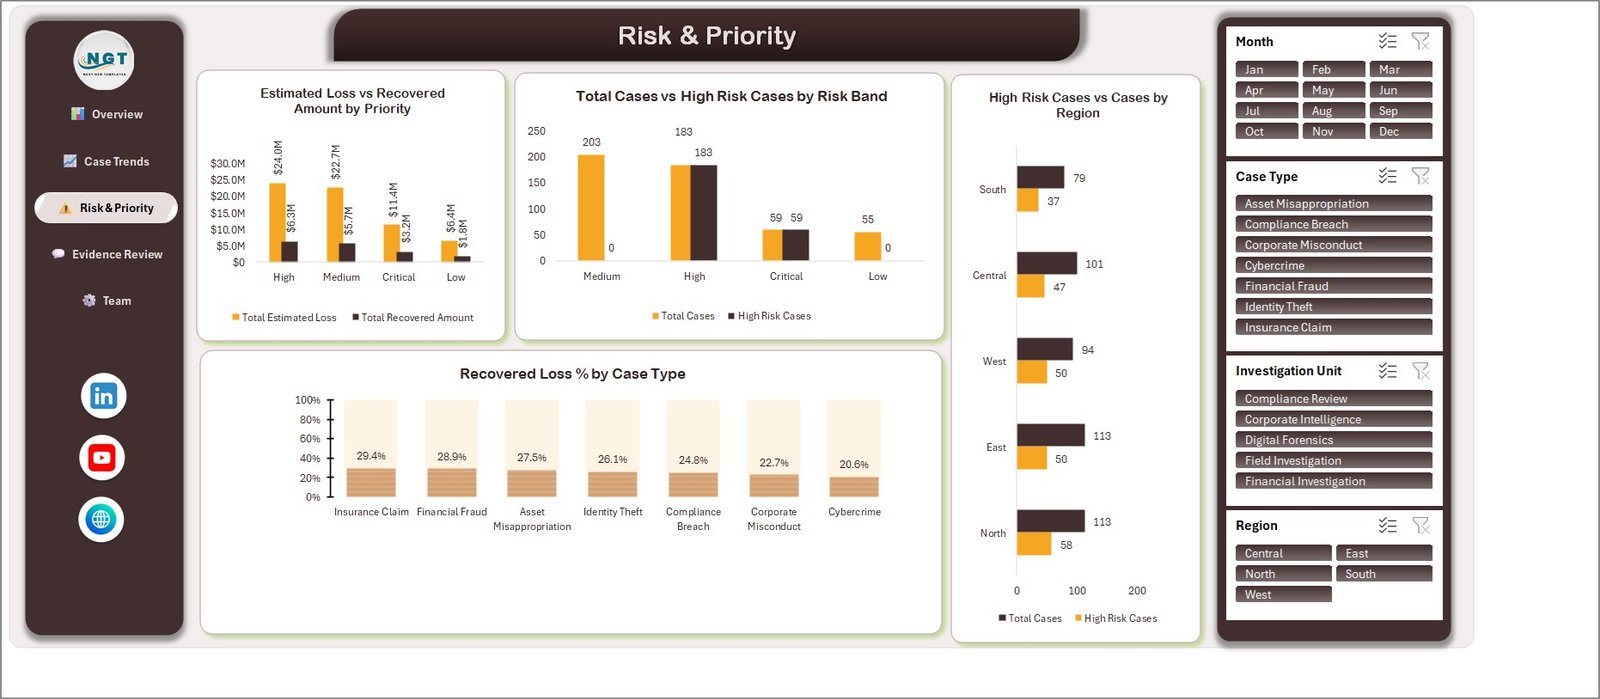
Here the caseload is graded. Estimated Loss vs Recovered Amount by Priority puts $24.0M of loss against $6.3M recovered on High priority cases; Total Cases vs High Risk Cases by Risk Band reports Medium 203, High 183, Critical 59 and Low 55; High Risk Cases vs Cases by Region compares the five regions; and Recovered Loss % by Case Type runs from 29.4% on Insurance Claim down to 20.6% on Cybercrime.
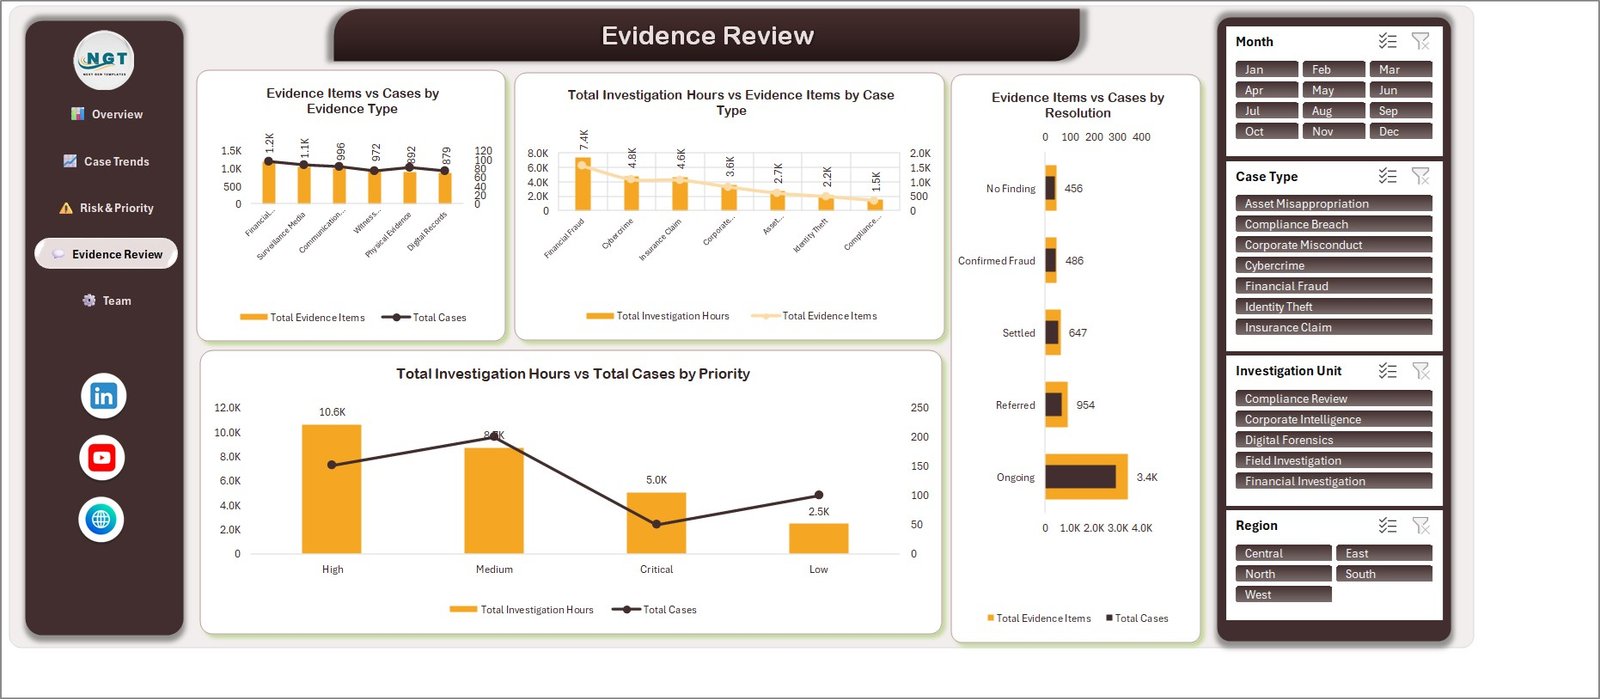
Page 4: Evidence Review
Evidence volume is matched against effort. Evidence Items vs Cases by Evidence Type ranks the six evidence categories; Total Investigation Hours vs Evidence Items by Case Type puts 7.4K hours on Financial Fraud at the top; Evidence Items vs Cases by Resolution shows 3.4K evidence items sitting in Ongoing work; and Total Investigation Hours vs Total Cases by Priority contrasts 10.6K hours on High priority with 2.5K on Low.
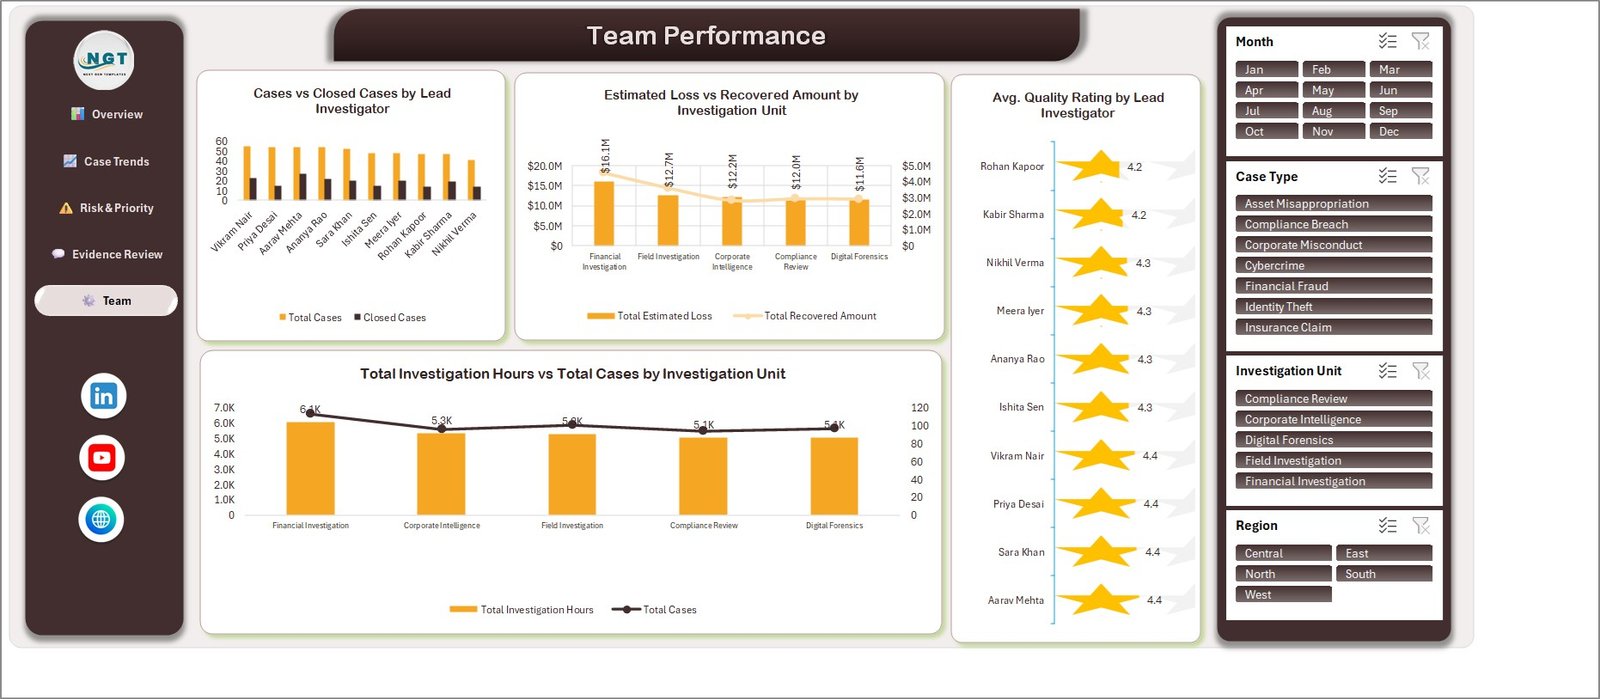
Page 5: Team Performance
The last page is about people and units. Cases vs Closed Cases by Lead Investigator compares the ten sample investigators; Estimated Loss vs Recovered Amount by Investigation Unit runs from Financial Investigation at $16.1M down to Digital Forensics at $11.6M; Avg. Quality Rating by Lead Investigator uses a star scale from 4.2 to 4.4; and Total Investigation Hours vs Total Cases by Investigation Unit shows where the hours actually go.
Data sheet and Support sheet
The Data sheet holds all 500 sample rows in 26 columns: Case ID, Incident Date, Case Type, Investigation Unit, Region, Lead Investigator, Evidence Type, Priority, Status, Resolution, Estimated Loss, Recovered Amount, Investigation Hours, Persons Interviewed, Evidence Items, Risk Score, Quality Rating, Month, Year, Quarter, Risk Band and five helper count columns. The Support sheet is a short in-workbook reference for refreshing the pivot cache and extending the source ranges.
Forensics and Investigation Dashboard in Excel vs a Google Sheets Build vs Paid Case-Analytics SaaS
| Feature | This Excel template | Google Sheets build | Paid case-analytics SaaS |
|---|---|---|---|
| Cost | One-time purchase ✅ | Build time, 2-3 days | $40-$150 / user / month |
| Platform | Excel 2016+ desktop, .xlsx | Browser, Google account | Vendor cloud |
| Setup time | Under 15 minutes ✅ | Days | 2-6 week onboarding |
| Macros required | None ✅ | Apps Script often needed | Not applicable |
| Cross-filtering | 4 slicers on all 5 pages ✅ | Filter views, page by page | Yes |
| Works offline | Yes ✅ | No | No |
| Data stays on your machine | Yes ✅ | Google cloud | Vendor cloud |
| Chain-of-custody / evidence vault | No | No | Yes |
| Year-1 cost at 5 users | One licence fee ✅ | $0 plus build labour | $2,400-$9,000 |
For an investigation team that needs management reporting on a case log without a six-week SaaS onboarding, this workbook sits in the sweet spot — and it is honest about the one thing it is not: an evidence system.
Who Should Use This Template
Perfect for:
- Internal audit, fraud risk and corporate investigation teams of 3-50 people who already keep a case log in a spreadsheet
- Forensic accounting and consulting practices that report recovery rates to a partner or client
- Compliance managers who need a monthly caseload and escalation pack and want a forensic case management dashboard they can attach to an email
- Analysts who want to track investigation cases in Excel without paying per seat
Not a fit if:
- You need an evidence-management system. There is no chain-of-custody log, no exhibit register and no custody tracking anywhere in this workbook.
- You need court-ready or legally admissible output. These are internal management charts, not evidence or expert-witness exhibits.
- You expect it to read your case-management platform automatically. There is no API, no connector and no live integration; case data is pasted into the Data sheet by hand.
- You intend to store real case records or personal data about suspects, victims or witnesses. The file ships with fictional sample data and has no access control, encryption or audit logging, so it is not suitable for regulated personal data.
- Your team works only in Excel for the web, or needs identical slicer behaviour on Mac.
Real-World Use Cases
Ravi leads a four-person internal investigations unit at a manufacturer. On the first Monday of each month he pastes the latest case log into the Data sheet, filters the Region slicer to his two plants, and drops the Case Trends page straight into the audit committee pack — instead of rebuilding four charts by hand each time.
Anita runs a small forensic accounting practice. She uses Recovered Loss % by Case Type to show clients where recovery actually lands, and the Team Performance page to check which investigator is carrying the most open hours before she accepts a new engagement.
Devan is a compliance manager who needed an excel dashboard for fraud investigations after a licence renewal quote tripled. He kept the case log his team already maintained, pointed the workbook at it, and now reports escalation counts monthly at a one-time cost.
Advantages of the Forensics and Investigation Dashboard in Excel
The obvious advantage is cost: a one-time purchase against $2,400 to $9,000 a year for a five-seat case-analytics subscription. The less obvious one is control. The workbook runs offline, the file never leaves your machine, and nothing is uploaded to a vendor — which matters when the subject of the analysis is your own organisation’s fraud exposure.
The second advantage is speed of adoption. As an investigation case dashboard it asks nothing of the user beyond Excel itself: because everything is pivot-driven, there is nothing to learn beyond clicking a slicer. A supervisor who can already use Excel filters can operate every page on day one, and any analyst who knows pivot tables can add a chart or a dimension without touching a single formula. If you want a refresher on how one slicer can drive several pivot charts at once, Microsoft’s guide to using slicers to filter data covers the exact connection settings this workbook relies on.
Opportunities for Improvement
It is worth being blunt about the limits. There is no case intake form — you maintain the log yourself and paste it in. The helper columns (Month, Year, Quarter, Risk Band) must be filled down manually when you add rows, and forgetting that is the single most common reason a chart looks wrong after an update. Refresh is manual: Ctrl+Alt+F5, every time.
Beyond roughly 100,000 rows, the pivot source ranges need extending and refreshes get slow on older hardware. And the workbook reports on money and time, not on legal process — no statute-of-limitation flags, no disclosure deadlines, no evidence custody. For benchmarking the loss and recovery ratios you will be reading, the ACFE’s Report to the Nations is a far better external reference than any figure this sample data contains.
Best Practices
- Keep your category values consistent. Seven case types, five investigation units and five regions in the sample; if your log writes “Cyber Crime” and “Cybercrime” both will appear as separate slicer buttons.
- Fill the four helper columns to the last row before refreshing, not after.
- Reset every slicer before you export a page — a filter left on is how a wrong number reaches a board pack.
- Anonymise. Replace real names with case codes before the file leaves your laptop, and never put witness or suspect personal data in it.
- Keep one clean copy of the original workbook so you can start again if a pivot range gets damaged.
Explore Relevant Templates
- Forensics & Investigation KPI Dashboard in Excel — the scorecard companion, a month-picker KPI table with traffic lights rather than five analysis pages.
- Anti-Money Laundering (AML) KPI Dashboard in Excel — for alert and SAR reporting alongside your case work.
- Forensics & Investigation KPI Dashboard in Power BI — the same KPI set for teams already standardised on Power BI.
- Also available as: a separate Forensics & Investigation Dashboard in Power BI edition is being prepared and is not live yet. It is its own build with its own page layout, not a copy of this workbook.
Frequently Asked Questions
What does the Forensics and Investigation Dashboard in Excel track?
It reports estimated loss, recovered amount, recovered loss percentage, case counts, closure and escalation counts, investigation hours, evidence items, persons interviewed, risk score and quality rating, sliced by case type, investigation unit, region, lead investigator, priority, status, resolution and month.
Does it need macros or an add-in?
No. It is a plain .xlsx built on pivot tables, pivot charts and slicers. There is no VBA, no Power Query connection and no add-in, so it opens where macro-enabled files are blocked by corporate policy.
Is this evidence-management or case-management software?
No. It is a reporting layer over a case log you maintain yourself. There is no chain-of-custody tracking, no evidence vault, no access control and no integration with a case-management system, and the output is not intended to be legally admissible.
Can I store real case data in it?
We do not recommend it. The workbook has no encryption, user permissions or audit trail, so it is unsuitable for real case records or personal data about suspects, victims or witnesses. Use anonymised or aggregated figures and follow your organisation’s data policy.
How does it compare with a paid case-analytics platform?
A five-seat subscription typically runs $2,400 to $9,000 in year one and adds evidence custody, workflow and audit trails. This workbook gives you the reporting layer only, for a one-time fee, offline, with your data staying on your own machine.
How long does setup take?
Under 15 minutes if your case log already carries the same fields. Delete the 500 sample rows, paste yours in the same column order, fill the four helper columns and refresh the pivot cache once.
How many cases can it handle?
The sample carries 500 rows. Pivot tables handle tens of thousands comfortably; past roughly 100,000 rows you will want to extend the pivot source ranges and expect slower refreshes on older machines.
About the Author
Built by PK — Microsoft Certified Professional with 15+ years of Excel, Google Sheets and Power BI experience. Founder of NextGenTemplates, reaching 300K+ subscribers across YouTube channels. Every template is hand-built and tested before release.
Conclusion
If your investigation team already keeps a case log and simply needs to report on it, the Forensics and Investigation Dashboard in Excel turns that log into five pages of management reporting without a subscription, an onboarding project or a macro prompt. Just keep its scope in mind: reporting, not evidence handling, and sample data rather than a home for real case files.
👉 Click here to purchase the Forensics & Investigation Dashboard in Excel
Instant download · One-time payment · No subscription
🎥 For step-by-step video tutorials, visit Youtube.com/@PKAnExcelExpert
Last updated: September 2026