Freight forwarding operations grow more complex every year. Companies manage multiple shipment modes, carriers, origin and destination countries, incoterms, and monthly volumes. Therefore, teams need a clear and reliable way to track performance. That is exactly where a Freight Forwarding Dashboard in Excel becomes a powerful solution.
In this detailed and SEO-friendly guide, you will learn what a Freight Forwarding Dashboard in Excel is, why it matters, how it works, its page-wise structure, advantages, best practices, and frequently asked questions. Moreover, this article expands the provided information with practical explanations and real-world relevance. As a result, you can confidently use or implement this dashboard for logistics and freight analysis.
Click to Purchases Freight Forwarding Dashboard in Excel
What Is a Freight Forwarding Dashboard in Excel?
A Freight Forwarding Dashboard in Excel is a centralized performance tracking tool that helps logistics teams monitor shipment, cost, revenue, and profitability data in one place.
Instead of working with scattered spreadsheets and manual reports, this dashboard brings all key freight metrics together. As a result, decision-makers gain instant visibility into shipment performance, profit margins, carrier efficiency, and cost trends.
Because the dashboard runs inside Excel, users can easily update data, apply filters, and analyze trends without advanced technical skills. Therefore, it suits freight forwarders, logistics managers, supply chain teams, and finance professionals alike.
Why Do Freight Forwarding Businesses Need a Dashboard in Excel?
Freight forwarding involves many moving parts. When teams track data manually, errors increase and insights get delayed. However, a structured dashboard solves these challenges effectively.
Here is why freight forwarding businesses rely on Excel dashboards:
-
They centralize shipment, cost, and revenue data
-
They improve visibility across routes, carriers, and shipment modes
-
They support faster and more accurate decision-making
-
They reduce manual reporting effort
-
They help identify profit leaks and cost overruns
Moreover, Excel remains widely used across logistics organizations. Therefore, an Excel-based dashboard fits naturally into existing workflows.
What Are the Key Features of the Freight Forwarding Dashboard in Excel?
This Freight Forwarding Dashboard in Excel comes as a ready-to-use analytical solution. It includes structured sheets, visual charts, and interactive filters that make freight data easy to understand.
Page Navigator for Easy Access
The dashboard includes a Page Navigator on the left side. This navigator allows users to switch between analysis pages quickly. As a result, users save time and avoid confusion while exploring data.
How Is the Dashboard Structured?
The dashboard contains five analytical pages inside the Excel desktop application file. Each page focuses on a specific aspect of freight forwarding performance.
Let us explore each page in detail.
What Does the Overview Page Show in the Freight Forwarding Dashboard?
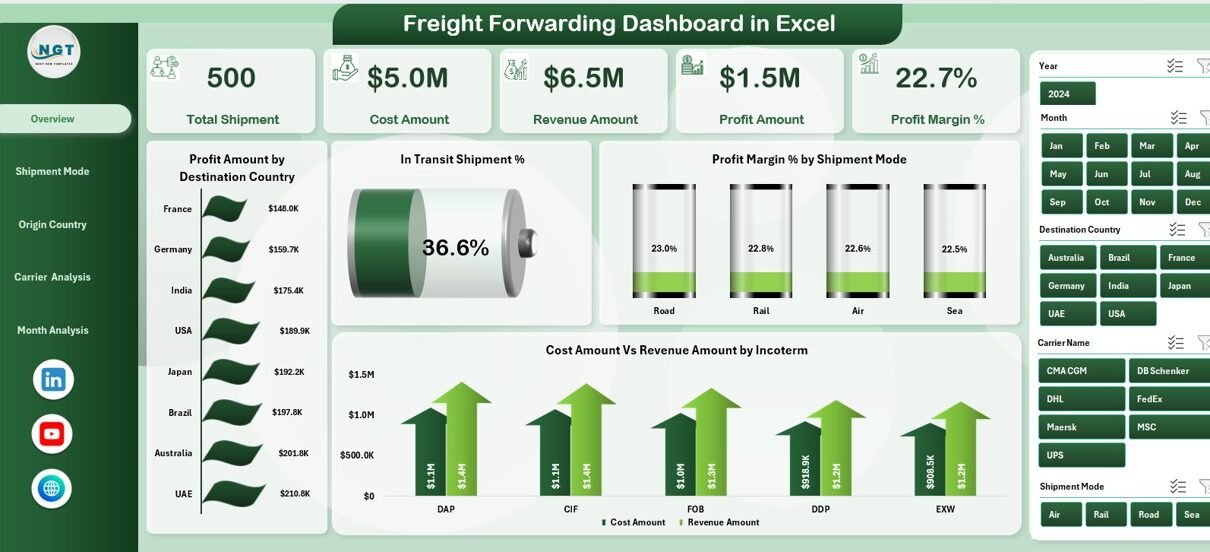
Overview Page – High-Level Freight Performance
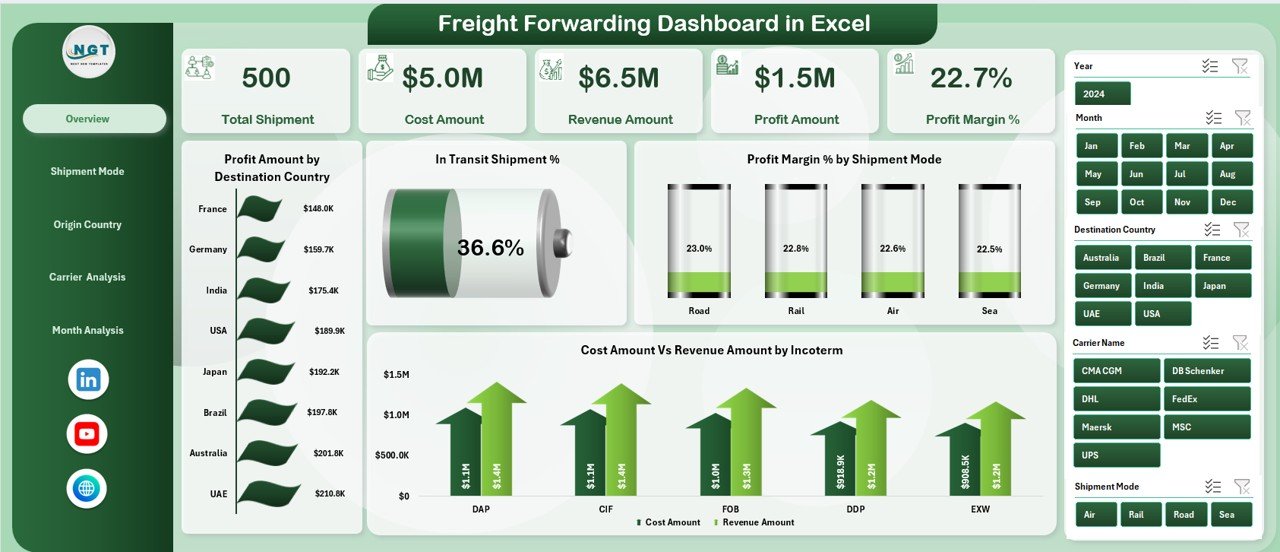
The Overview Page serves as the main summary page of the dashboard. It gives a quick snapshot of overall freight performance.
Key Elements on the Overview Page
-
Right-side slicer for dynamic filtering
-
Four KPI cards that highlight key performance indicators
-
Four analytical charts for visual insights
Charts on the Overview Page
-
Profit Amount by Destination Country
This chart shows which destination countries generate the highest profit. Therefore, teams can focus on high-value routes. -
In-Transit Shipment %
This metric highlights the percentage of shipments currently in transit. As a result, teams can monitor delivery pipeline health. -
Profit Margin % by Shipment Mode
This chart compares profitability across air, sea, and road shipments. Hence, managers can optimize shipment mode selection. -
Cost Amount vs Revenue Amount by Incoterm
This comparison reveals how different incoterms impact costs and revenues. Therefore, pricing strategies improve. -
Click to Purchases Freight Forwarding Dashboard in Excel
How Does Shipment Mode Analysis Improve Decision-Making?
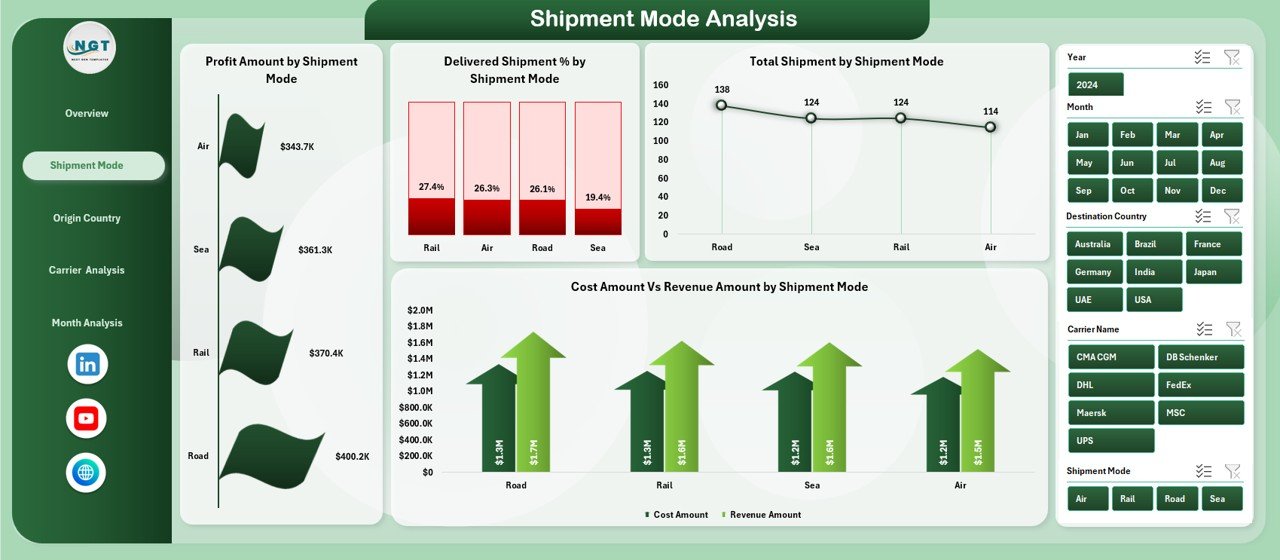
Shipment Mode Analysis Page
The Shipment Mode Analysis Page focuses on performance by shipment type. It helps logistics teams understand how each mode contributes to profit and volume.
Key Elements
-
Right-side slicer for filtering
-
Four focused charts
Charts Included
-
Profit Amount by Shipment Mode
This chart shows which shipment mode generates the most profit. -
Delivered Shipment % by Shipment Mode
This metric highlights delivery efficiency by mode. -
Total Shipment by Shipment Mode
This chart displays shipment volume distribution. -
Cost Amount vs Revenue Amount by Shipment Mode
This comparison helps control operational costs.
Because shipment mode selection directly affects margins, this page plays a critical role in strategic planning.
Why Is Origin Country Analysis Important in Freight Forwarding?
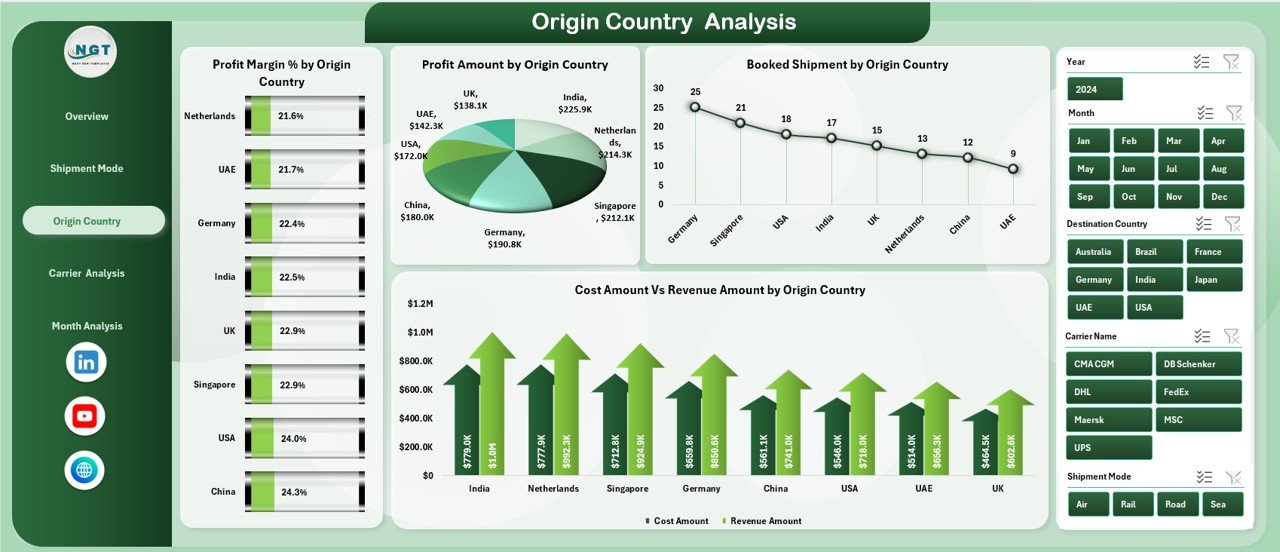
Origin Country Analysis Page
The Origin Country Analysis Page evaluates performance based on shipment origin. It helps businesses understand regional efficiency and profitability.
Key Elements
-
Right-side slicer
-
Four analytical charts
Charts Included
-
Profit Margin % by Origin Country
This chart highlights which origin countries deliver higher margins. -
Profit Amount by Origin Country
This view shows total profit contribution by origin. -
Booked Shipment by Origin Country
This chart displays shipment volume by origin. -
Cost Amount vs Revenue Amount by Origin Country
This comparison identifies cost-heavy regions.
As a result, companies can renegotiate contracts or adjust sourcing strategies.
Click to Purchases Freight Forwarding Dashboard in Excel
How Does Carrier Analysis Help Optimize Logistics Partners?
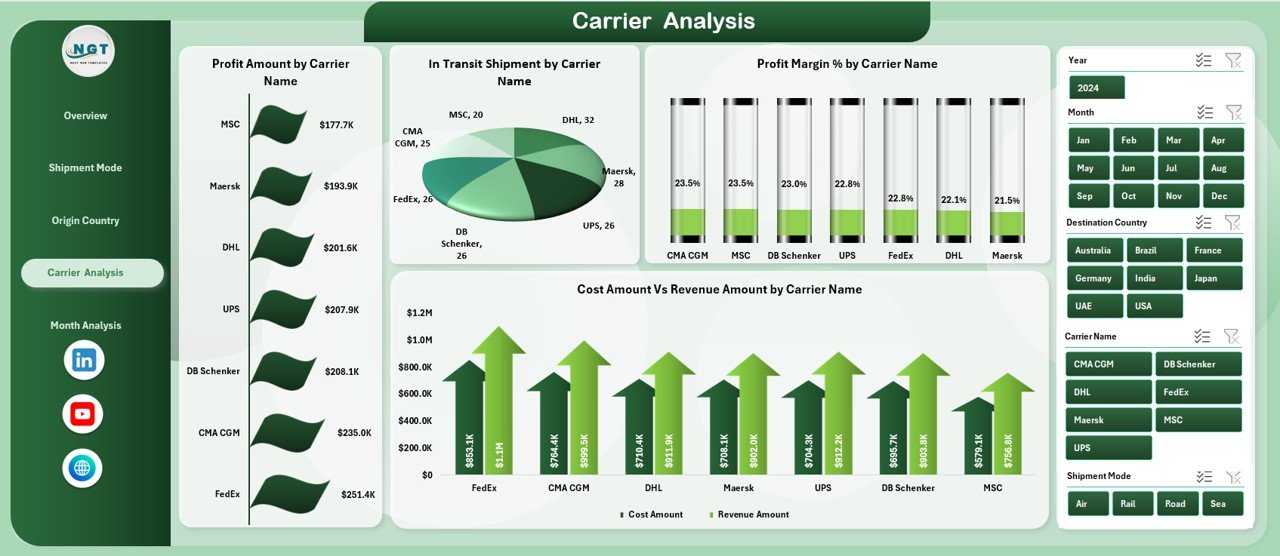
Carrier Analysis Page
The Carrier Analysis Page focuses on carrier performance. Since carriers directly impact cost and delivery timelines, this page adds strong operational value.
Key Elements
-
Right-side slicer
-
Four performance charts
Charts Included
-
Profit Amount by Carrier Name
This chart reveals which carriers contribute most to profit. -
In-Transit Shipment by Carrier Name
This metric highlights operational workload by carrier. -
Profit Margin % by Carrier Name
This view compares carrier efficiency. -
Cost Amount vs Revenue Amount by Carrier Name
This chart supports carrier cost control decisions.
Therefore, teams can identify top-performing carriers and address underperforming ones.
What Insights Does the Month Analysis Page Provide?
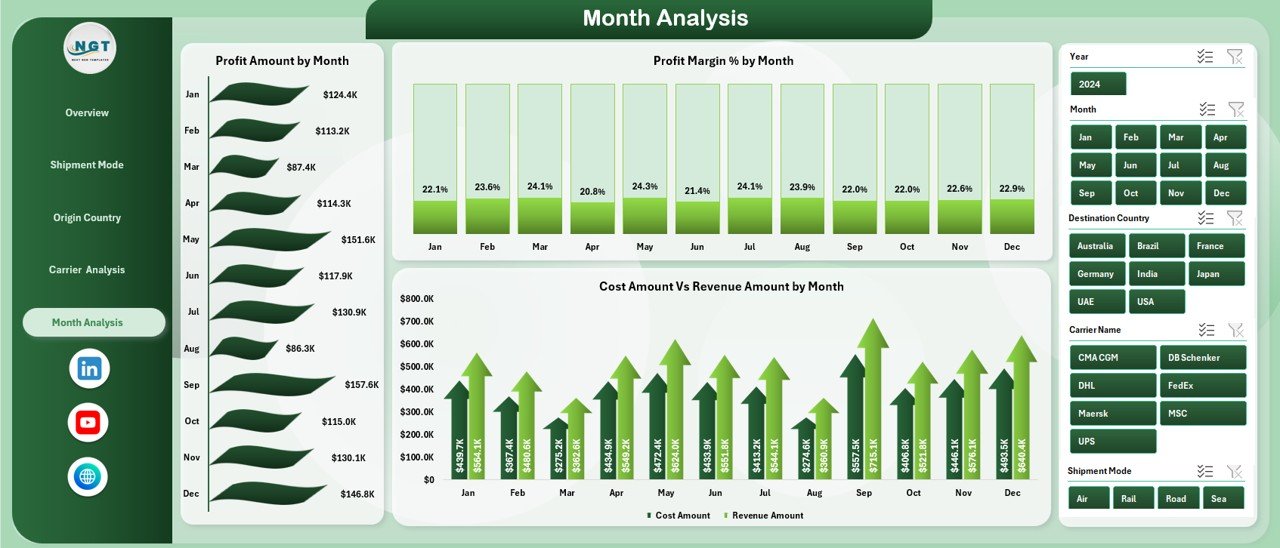
Month Analysis Page
The Month Analysis Page tracks trends over time. It helps teams spot seasonality and performance fluctuations.
Key Elements
-
Right-side slicer
-
Three trend charts
Charts Included
-
Profit Amount by Month
This chart shows monthly profit trends. -
Profit Margin % by Month
This view highlights margin changes over time. -
Cost Amount vs Revenue Amount by Month
This comparison helps track cost control monthly.
As a result, businesses can forecast demand and plan capacity effectively.
What Is the Role of the Data Sheet and Support Sheet?
Data Sheet
The Data Sheet stores all raw freight forwarding data. Users update this sheet regularly to refresh the dashboard automatically.
Typical data includes:
-
Shipment date
-
Origin and destination country
-
Shipment mode
-
Carrier name
-
Cost amount
-
Revenue amount
-
Incoterm
-
Shipment status
Support Sheet
The Support Sheet contains helper calculations, lookup tables, and validation lists. It ensures data accuracy and smooth dashboard performance.
Advantages of Freight Forwarding Dashboard in Excel
A Freight Forwarding Dashboard in Excel delivers several strong advantages.
Key Advantages
-
✅ Centralizes all freight performance data
-
✅ Improves shipment, carrier, and route visibility
-
✅ Helps track profit, cost, and margins clearly
-
✅ Reduces manual reporting effort
-
✅ Supports faster operational decisions
-
✅ Works without additional software
-
✅ Easy to customize and scale
Because Excel remains flexible, teams can adapt the dashboard to different business models.
How Does This Dashboard Improve Business Performance?
This dashboard turns raw data into actionable insights. Therefore, managers can:
-
Identify profitable routes and shipment modes
-
Reduce operational costs
-
Improve carrier selection
-
Monitor delivery efficiency
-
Track monthly trends and seasonality
As a result, freight forwarding businesses gain a competitive edge.
Best Practices for the Freight Forwarding Dashboard in Excel
To get the most value from this dashboard, follow these best practices.
Data Management Best Practices
-
Keep the Data Sheet clean and consistent
-
Use standardized country, carrier, and mode names
-
Update data regularly
Dashboard Usage Best Practices
-
Apply slicers before drawing conclusions
-
Review month-wise trends frequently
-
Compare cost vs revenue for every analysis
Performance Improvement Best Practices
-
Focus on low-margin shipment modes
-
Optimize high-cost carriers
-
Track in-transit shipments daily
Following these practices ensures accurate insights and better decisions.
Who Can Use the Freight Forwarding Dashboard in Excel?
This dashboard suits many professionals, including:
-
Freight forwarders
-
Logistics managers
-
Supply chain analysts
-
Operations managers
-
Finance and cost control teams
-
Export-import professionals
Because Excel skills suffice, adoption remains easy.
Conclusion: Why Choose a Freight Forwarding Dashboard in Excel?
A Freight Forwarding Dashboard in Excel offers a practical, powerful, and cost-effective way to analyze logistics performance. It brings clarity to complex freight data and supports better decisions across shipment modes, carriers, origins, and time periods.
By using this dashboard, businesses reduce reporting effort, improve profitability, and strengthen operational control. Therefore, it becomes an essential tool for modern freight forwarding operations.
Frequently Asked Questions (FAQs)
What is a Freight Forwarding Dashboard in Excel used for?
A Freight Forwarding Dashboard in Excel helps track shipments, costs, revenues, and profits in a structured visual format.
Can beginners use this dashboard?
Yes, the dashboard uses standard Excel features. Therefore, beginners can use it easily.
How often should data be updated?
You should update the data daily or weekly, depending on shipment volume.
Can I customize the dashboard?
Yes, you can add KPIs, charts, or filters based on business needs.
Does the dashboard support multiple shipment modes?
Yes, it supports analysis by air, sea, road, or any custom shipment mode.
Is Excel suitable for freight analytics?
Yes, Excel works well for small to mid-size freight operations and quick analysis.
Visit our YouTube channel to learn step-by-step video tutorials