The healthcare industry is transforming rapidly, and marketing teams must keep pace with digital trends while ensuring accuracy, efficiency, and collaboration. As remote work becomes a new standard, tracking performance and outcomes has never been more important. That’s where the Healthcare Marketing Remote Work Report in Excel comes in — a powerful, ready-to-use tool that helps you monitor progress, measure success, and optimize strategies from anywhere.
This article explores everything about this professional Excel-based report — from its structure and features to best practices and benefits — so you can make data-driven decisions with confidence.
Click to Purchases Healthcare Marketing Remote Work Report in Excel
What Is a Healthcare Marketing Remote Work Report in Excel?
A Healthcare Marketing Remote Work Report in Excel is a structured performance tracking system designed to monitor marketing projects, campaigns, and revenue activities handled by distributed or hybrid teams. It centralizes all critical marketing data — from campaign progress to conversion rates — into a single, interactive dashboard built in Microsoft Excel.
This report provides both visual insights and analytical depth. It empowers managers, analysts, and healthcare marketers to review every key metric in one place, compare departments, and evaluate campaign efficiency. Whether your team works from a hospital office or remotely from home, this Excel tool keeps everyone aligned.
Why Do Healthcare Marketing Teams Need a Remote Work Report?
Remote work in healthcare marketing introduces flexibility but also brings challenges — scattered communication, lack of transparency, and difficulty in tracking project outcomes. Without a consolidated reporting system, marketers often struggle to measure:
-
Campaign completion status
-
Revenue contribution by department
-
Channel performance and conversion rates
-
Timely task delivery across remote teams
The Healthcare Marketing Remote Work Report in Excel solves all these issues. It acts as a bridge between remote work flexibility and organizational accountability.
Structure of the Healthcare Marketing Remote Work Report in Excel
This Excel report contains three key pages (plus a support sheet) that together create a complete reporting system:
Summary Page
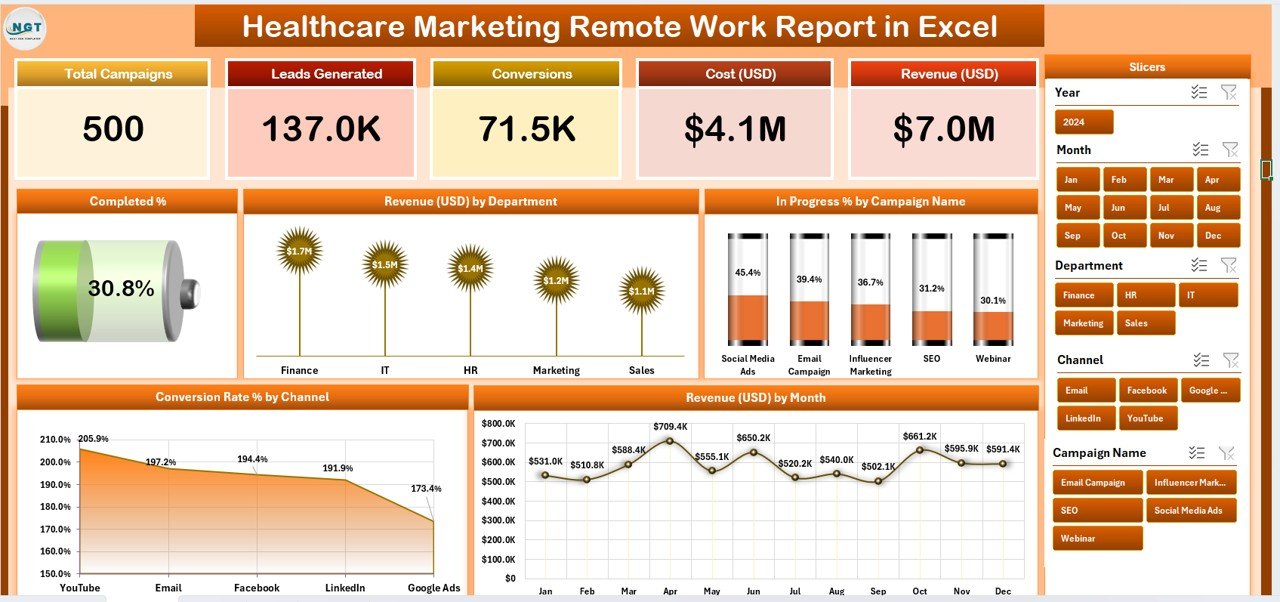
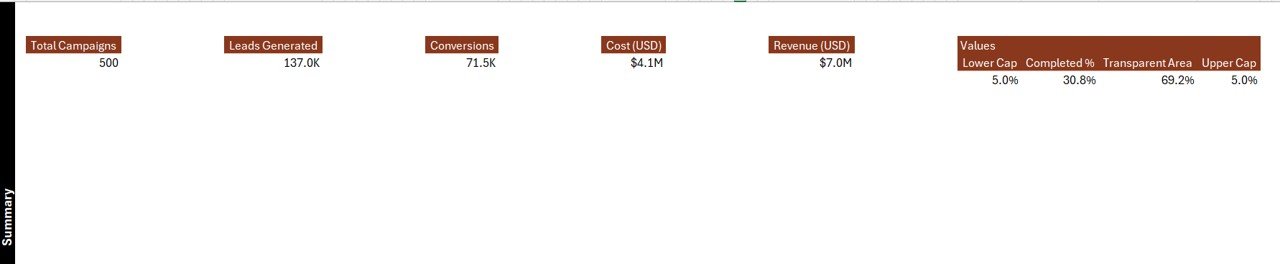
The Summary Page serves as the main dashboard interface. It’s where you get an instant snapshot of your marketing performance.
Key features of this page include:
-
Five KPI Cards on the top section that highlight key metrics such as Total Campaigns, Completed %, In-Progress %, Conversion Rate %, and Total Revenue (USD).
-
Right-Side Slicer Panel that allows you to filter results by department, campaign, or channel dynamically.
Five Insightful Charts that make data visual and actionable:
- Completed % Chart – Tracks project completion across teams.
- Revenue (USD) by Department – Displays departmental performance.
- In Progress % by Campaign Name – Monitors campaigns still running.
- Conversion Rate % by Channel – Shows marketing effectiveness by communication medium.
- Revenue (USD) by Month – Helps compare monthly income trends.
The Summary Page acts as your “mission control center,” ensuring that leaders can see all metrics at a glance and make quick, informed decisions.
Click to Purchases Healthcare Marketing Remote Work Report in Excel
Report Page
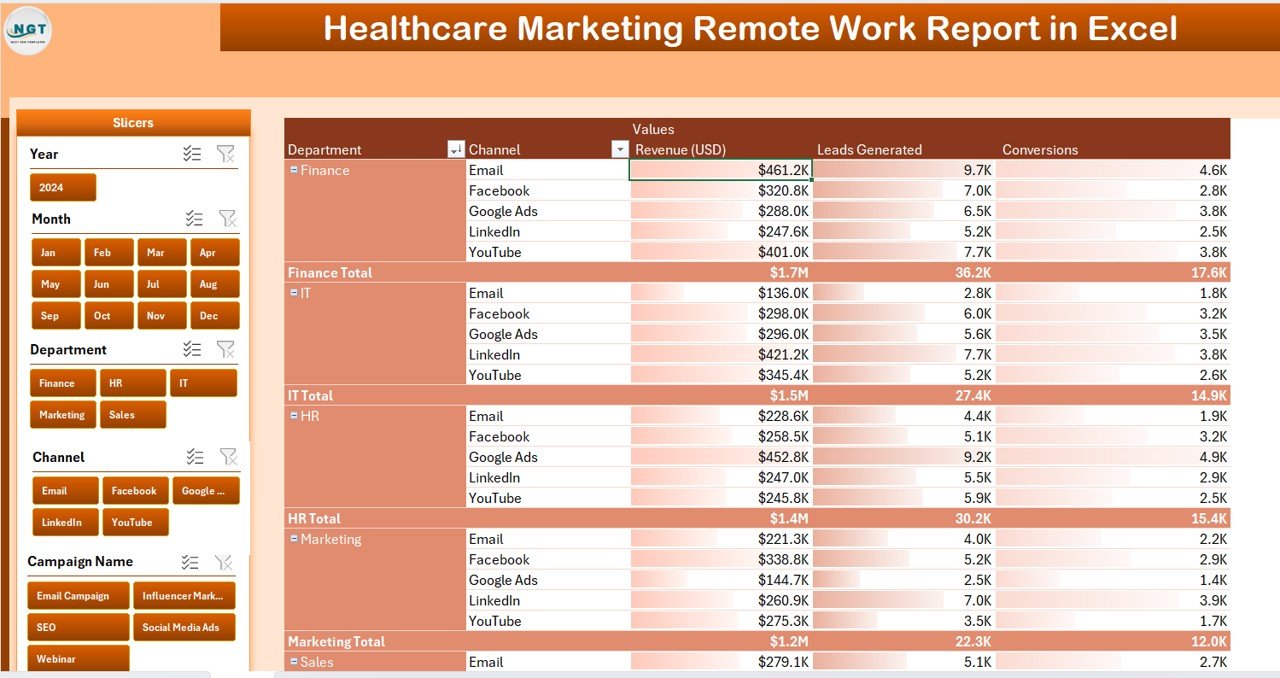
The Report Page focuses on tabular details and deep filtering options. It’s ideal for analysts who want to explore raw data and identify trends.
Key highlights:
-
Left-Side Slicers: Allow filtering by campaign, channel, department, or responsible person.
-
Interactive Information Table: Displays campaign-level details such as project name, start date, end date, progress %, revenue achieved, and remarks.
-
Dynamic Layout: Every change made in slicers automatically refreshes the table, giving you up-to-date results.
This sheet ensures that marketers can track progress without jumping between files or systems.
Data Sheet
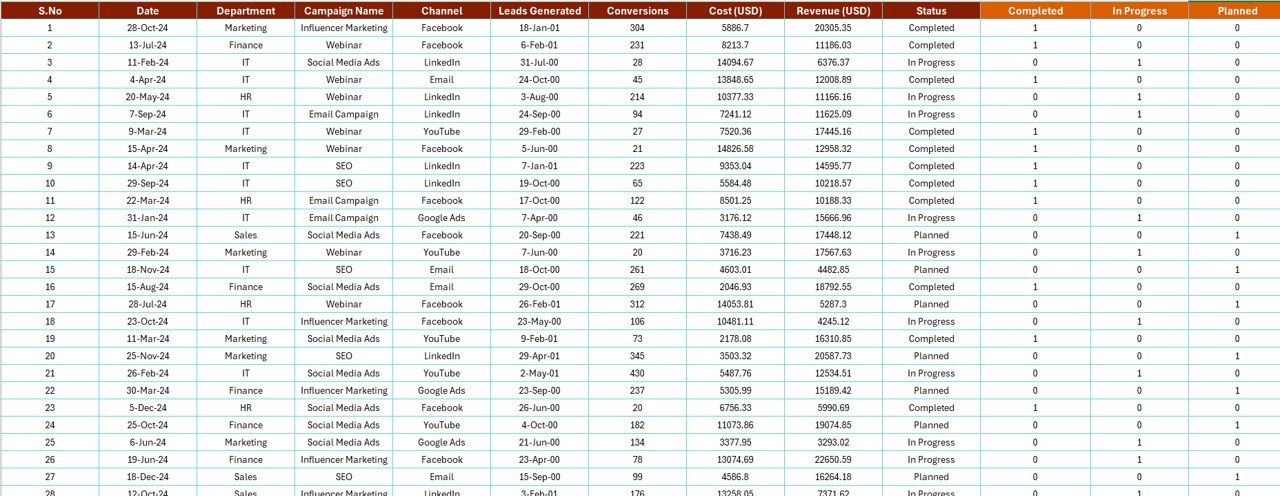
The Data Sheet is the foundation of the entire report. It holds all the core data powering the dashboard.
Common columns in this sheet include:
-
Campaign Name
-
Department
-
Responsible Person
-
Start Date / End Date
-
Channel
-
Conversion Rate %
-
Revenue (USD)
-
Status (Completed / In Progress / Not Started)
You can easily expand or modify this dataset as your campaigns grow. The dashboard instantly updates when you add new data — no manual effort required.
Support Sheet
The Support Sheet contains reference lists and drop-down data sources. For example, it stores predefined lists of departments, campaigns, or channels used for slicers and data validation.
Having this sheet ensures consistency and prevents data entry errors.
How Does the Healthcare Marketing Remote Work Report Work?
This report uses Excel formulas, conditional formatting, and pivot tables to transform raw data into a meaningful summary. Here’s how the workflow operates:
-
Input Data: Enter or paste your campaign details in the Data Sheet.
-
Automatic Aggregation: Pivot tables summarize results in the Report and Summary pages.
-
Visualization: Dynamic charts and KPI cards present the data visually.
-
Filtering: Use slicers to analyze data by department, campaign, or channel.
-
Decision Making: Review trends, measure revenue, and identify improvement areas.
Because everything happens inside Excel, you don’t need any complex software or subscriptions — only Microsoft Excel.
Benefits of Using Excel for Remote Marketing Reports
Excel remains one of the most trusted business analysis tools for healthcare organizations. Here are some reasons why this format is so effective:
-
Accessibility: Every team member can open and edit the report without specialized tools.
-
Flexibility: You can customize charts, colors, and calculations to suit your reporting style.
-
Automation: Pivot tables and slicers automatically update results when you refresh data.
-
Scalability: The structure supports adding new campaigns or KPIs anytime.
-
Cost-Effectiveness: No extra licensing costs — Excel already exists in most organizations.
Real-World Use Cases of the Healthcare Marketing Remote Work Report
-
Campaign Performance Review:
Track how multiple digital campaigns perform in different regions or departments. -
Revenue Analysis:
Compare monthly revenue by department or by marketing channel. -
Conversion Tracking:
Monitor the effectiveness of digital campaigns like email, social media, or referral programs. -
Remote Team Performance:
Measure task completion rates and productivity across remote employees. -
Budget Utilization:
Evaluate marketing spend versus actual revenue outcomes. -
Strategic Planning:
Identify top-performing campaigns and channels for future budget allocation.
Click to Purchases Healthcare Marketing Remote Work Report in Excel
Advantages of Healthcare Marketing Remote Work Report in Excel
The Healthcare Marketing Remote Work Report in Excel offers numerous advantages that empower teams to stay productive and aligned even while working remotely:
✅ 1. Enhanced Transparency
Every stakeholder can see the same performance indicators and campaign progress in real time. Transparency builds trust and ensures accountability.
✅ 2. Streamlined Collaboration
When remote marketers update data, everyone sees the impact instantly. The shared Excel file encourages teamwork without confusion.
✅ 3. Improved Decision-Making
With clear charts and KPIs, managers can make quick and informed choices — whether to extend a campaign, allocate more budget, or pivot strategy.
✅ 4. Real-Time Insights
Dynamic charts allow real-time tracking of results. You don’t need to wait for end-of-month reports; insights appear instantly.
✅ 5. Cost-Effective Reporting
Instead of expensive analytics platforms, this Excel-based report provides equal analytical depth with minimal investment.
✅ 6. Flexibility and Customization
You can tailor the layout, add new metrics, or modify existing KPIs to suit your organization’s marketing strategy.
How to Use the Report Effectively
To get the most out of this Excel tool, follow these simple yet impactful steps:
-
Define Campaign Goals: Before data entry, outline what success means for each campaign — e.g., conversion rate or revenue target.
-
Update Data Regularly: Add new records daily or weekly to ensure the dashboard reflects real-time performance.
-
Review Key Charts Weekly: Focus on the “Revenue by Month” and “Conversion Rate by Channel” charts for quick insights.
-
Identify Outliers: Use conditional formatting to spot campaigns that perform exceptionally well or poorly.
-
Share Insights: Export visuals into PDF or PowerPoint for management meetings.
Best Practices for the Healthcare Marketing Remote Work Report in Excel
Following best practices ensures that your report remains accurate, relevant, and efficient.
⭐ 1. Keep Data Consistent
Always use the same naming conventions for departments, channels, and campaigns. Inconsistent entries can break formulas and charts.
⭐ 2. Use Data Validation
Create dropdown menus for fields like “Department” and “Channel” to minimize human error.
⭐ 3. Refresh Pivot Tables
After adding new data, refresh pivot tables to update all charts automatically.
⭐ 4. Protect the Layout
Lock formulas and chart areas to prevent accidental edits by remote users.
⭐ 5. Use Color Codes
Apply traffic light indicators — green for completed, yellow for in progress, red for pending — to make interpretation faster.
⭐ 6. Automate with Macros (Optional)
Advanced users can add macros for automating data entry or generating reports in one click.
How This Report Supports Remote Teams
This report bridges the physical gap between remote employees by offering:
-
Centralized Visibility: Everyone works from one data source.
-
Remote Monitoring: Managers can track campaign progress from anywhere.
-
Performance Accountability: Each team member’s contribution reflects in real time.
-
Faster Feedback Loop: Data helps identify issues early and correct them quickly.
It turns distance into strength by connecting performance with transparency.
Example Scenario
Imagine a healthcare marketing team promoting telemedicine services across multiple regions.
-
The team runs campaigns on social media, email, and search engines.
-
Each marketer updates campaign progress weekly in the Excel file.
-
The manager uses slicers to check performance by region or channel.
-
The Summary Page shows that email campaigns have a 20% higher conversion rate than social media.
-
The management reallocates budget accordingly.
This simple, data-driven approach boosts ROI without requiring new tools or complex analytics software.
Tips for Customizing Your Report
-
Add a “Cost per Lead (CPL)” column in the Data Sheet to calculate efficiency.
-
Introduce Trend Arrows using conditional formatting to show month-to-month performance changes.
-
Insert Timeline Slicers to filter results by specific dates.
-
Use Power Query for automatic data import from CRM systems or other files.
Customization makes the dashboard even more powerful and industry-specific.
Common Mistakes to Avoid
Even a well-designed report can lose accuracy if not managed carefully. Avoid these mistakes:
-
Forgetting to refresh pivot tables after data updates.
-
Deleting linked ranges or slicer sources.
-
Using inconsistent date formats.
-
Copy-pasting formulas incorrectly.
-
Ignoring data validation rules.
By maintaining proper hygiene, your Excel report stays reliable and professional.
Integration Opportunities
You can extend this Excel report by linking it to other systems:
-
Power BI: Import your Excel data for advanced visualization.
-
SharePoint / OneDrive: Store the file online for shared access by remote teams.
-
Google Sheets (via export): Convert the Excel file for collaborative editing online.
-
Outlook / Teams: Schedule automatic sharing of weekly snapshots with leadership.
Such integrations increase automation and collaboration across remote setups.
Conclusion
The Healthcare Marketing Remote Work Report in Excel is more than a spreadsheet — it’s a digital control hub for distributed marketing teams. It combines structure, interactivity, and simplicity in one place.
By using this Excel template, healthcare marketers can monitor campaign performance, evaluate revenue trends, and manage remote teams efficiently. The report enables smarter decisions, fosters transparency, and supports long-term growth in a hybrid work environment.
With its visual dashboards, slicers, and data-driven metrics, this report transforms raw data into actionable insights — all within the familiar power of Microsoft Excel.
Frequently Asked Questions (FAQs)
1️⃣ What is the main purpose of the Healthcare Marketing Remote Work Report in Excel?
It helps healthcare marketers monitor campaign progress, track revenue, and measure conversion performance across remote or hybrid teams in one structured Excel dashboard.
2️⃣ Can this Excel report be customized?
Yes. You can modify charts, KPIs, slicers, and data structures to match your organization’s specific needs.
3️⃣ Do I need any coding or VBA knowledge?
No. The report works using built-in Excel functions, pivot tables, and conditional formatting. However, advanced users can add VBA macros for automation.
4️⃣ How often should I update the data?
Weekly updates are ideal for most teams, but high-frequency campaigns can update daily for real-time insights.
5️⃣ Can multiple users access the file simultaneously?
Yes. You can host it on OneDrive or SharePoint to allow remote users to collaborate securely.
6️⃣ What are the benefits of using Excel instead of other analytics tools?
Excel is affordable, widely available, and offers strong flexibility with charts, slicers, and pivot tables without requiring complex software licenses.
7️⃣ Can I import data from other systems?
Absolutely. You can use Excel’s Power Query feature to connect data from CRM tools, CSV files, or online databases.
Visit our YouTube channel to learn step-by-step video tutorials