The Hydropower KPI Scorecard in Excel is a powerful, ready-to-use analytical template that helps energy organizations track, evaluate, and improve performance across every stage of hydropower operations.
Built entirely in Microsoft Excel, this scorecard consolidates key performance indicators (KPIs) into a simple and interactive format. Whether you’re managing power generation, equipment efficiency, or maintenance costs, this tool delivers insights that drive data-driven decisions — fast and accurately.
In this comprehensive guide, we’ll explore everything you need to know about the Hydropower KPI Scorecard in Excel — from its structure and features to best practices, advantages, and FAQs.
Click to Purchases Hydropower KPI Scorecard in Excel
⚡ What Is a Hydropower KPI Scorecard in Excel?
A Hydropower KPI Scorecard is a performance monitoring system designed to measure critical operational metrics in hydropower plants. It helps track areas such as power generation efficiency, turbine downtime, environmental compliance, and cost optimization — all in one place.
By using Excel, this tool turns raw data into structured visuals and tables that make decision-making simpler and faster. It helps energy managers and plant engineers stay aligned on performance goals, identify bottlenecks, and ensure every operational process contributes to overall productivity.
Click to Purchases Hydropower KPI Scorecard in Excel
🧩 Structure of the Hydropower KPI Scorecard Template
This template includes four key worksheets, each built to manage specific aspects of KPI monitoring.
1️⃣ Scorecard Sheet — The Central Dashboard

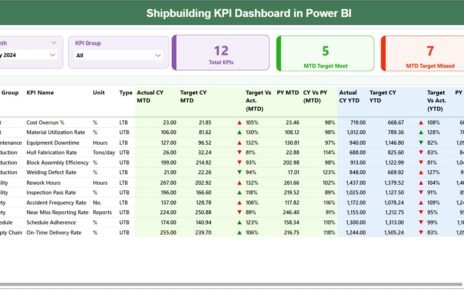
The Scorecard Sheet serves as the primary interface of the template. It gives an immediate snapshot of all hydropower KPIs and their real-time performance.
Here’s what it includes:
-
Dropdown Menus: Quickly select the month and view performance as MTD (Month-to-Date) or YTD (Year-to-Date).
-
Actual vs Target Comparison: Instantly compare actual performance metrics with predefined targets.
-
Visual Indicators: Color-coded cells and conditional formatting make it easy to identify which KPIs are on track and which need attention.
-
Comprehensive KPI Overview: See all relevant KPI metrics together — generation, maintenance, downtime, energy output, and more.
💡 Example: If the “Plant Availability %” drops below the target threshold, the scorecard automatically highlights it in red, helping you act before production efficiency suffers.
2️⃣ KPI Trend Sheet — Monitor Progress Over Time

The KPI Trend Sheet visualizes how performance evolves. You can select any KPI using a dropdown (cell C3) and instantly see its monthly or yearly trend.
Key features:
-
Displays KPI Group, Unit, Type (UTB/LTB), Formula, and Definition.
-
Plots MTD and YTD trend charts for Actual, Target, and Previous Year data.
-
Enables easy comparison of performance trends — ideal for management reviews or performance improvement planning.
For example, you can analyze Turbine Efficiency (%) trends over months to see how maintenance schedules influence performance.
3️⃣ Input Data Sheet — The Data Engine

This sheet is where you record or paste all the operational data used in the scorecard.
-
Data Entry: Capture actual values, targets, and supporting metrics.
-
Flexibility: Update data anytime as new monthly reports or readings arrive.
-
Dynamic Linking: Every update automatically refreshes the Scorecard and Trend charts.
Because it’s Excel-based, it supports data imports from SCADA systems, production reports, or manual logs — making it practical for both small and large hydropower facilities.
Click to Purchases Hydropower KPI Scorecard in Excel
4️⃣ KPI Definition Sheet — Build a Clear KPI Dictionary
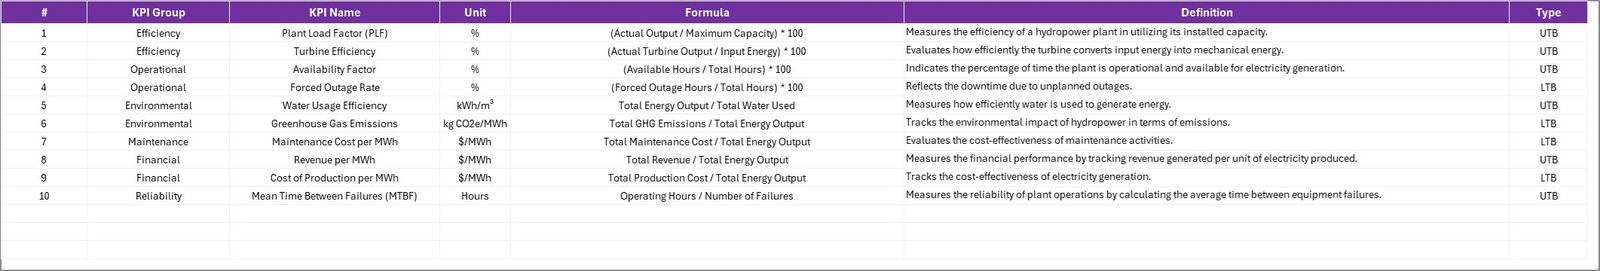
The KPI Definition Sheet ensures everyone understands what each metric means. It includes fields like:
-
KPI Name
-
KPI Group
-
Unit
-
Formula
-
Definition
🌱 Why Hydropower Plants Need a KPI Scorecard
Hydropower operations involve numerous interdependent activities — from water inflow management to turbine performance and grid supply. Without a centralized monitoring system, it’s easy to lose track of performance gaps.
A Hydropower KPI Scorecard in Excel helps you:
-
Measure operational efficiency in real time.
-
Identify downtime causes and reduce maintenance delays.
-
Track energy generation versus water availability.
-
Maintain environmental and safety compliance.
-
Simplify reporting and communication with stakeholders.
With Excel as the platform, you don’t need complex software — just structured data, formulas, and visuals.
⚙️ Key KPIs to Include in a Hydropower Scorecard
To make your scorecard truly effective, include performance indicators across these major categories:
💧 Generation Efficiency KPIs
-
Turbine Efficiency (%)
-
Plant Load Factor (%)
-
Water Utilization Ratio
-
Energy Output (MWh)
-
Capacity Factor (%)
🧰 Maintenance KPIs
-
Planned vs Unplanned Downtime (hours)
-
Maintenance Cost per MWh
-
Turbine Availability (%)
-
Mean Time to Repair (MTTR)
-
Spare Parts Cost (% of Total O&M)
🌿 Environmental KPIs
-
Water Flow Rate Variance (%)
-
Sediment Load (%)
-
Carbon Emission Reduction (tons)
-
Compliance Audit Score (%)
💸 Financial & Cost KPIs
-
Cost per MWh (USD)
-
Operating Expenditure (% of Revenue)
-
Revenue per MWh
-
Budget Utilization (%)
-
Return on Investment (ROI)
👥 Safety & Workforce KPIs
-
Lost Time Injury Frequency Rate (LTIFR)
-
Training Hours per Employee
-
Safety Compliance (%)
-
Equipment Incident Rate
Tracking these KPIs regularly builds a strong foundation for decision-making and ensures plant performance stays aligned with sustainability and profitability goals.
Click to Purchases Hydropower KPI Scorecard in Excel
📊 Types of Analysis You Can Do in Excel
Excel provides everything you need for analysis — without requiring expensive software.
Here are the main ways you can use your Hydropower KPI Scorecard:
-
Trend Analysis: Identify whether KPIs are improving or declining over time.
-
Target Achievement: Measure how actuals compare to targets, with visual alerts.
-
Year-on-Year Comparison: See how performance this year compares to previous years.
-
Root Cause Analysis: Use filters and pivot tables to isolate problem areas (e.g., low efficiency due to turbine fouling).
-
Performance Ranking: Highlight best-performing units or teams.
-
Cost Optimization: Track budget vs actuals to control expenses.
With slicers, dropdowns, and pivot charts, you can interactively explore insights in just a few clicks.
✅ Advantages of Using Hydropower KPI Scorecard in Excel
Let’s explore why this Excel-based solution stands out:
1. Easy to Use and Implement
No coding or external software is needed. Anyone familiar with Excel can operate and maintain it.
2. Real-Time Visibility
With dynamic formulas, charts, and slicers, you get instant visibility into performance metrics.
3. Improved Decision-Making
You can spot trends, inefficiencies, and achievements faster — leading to better planning.
4. Standardized Performance Measurement
KPI definitions remain consistent across departments, ensuring fair and accurate comparison.
5. Cost-Effective
Excel requires no additional investment, making it perfect for both small and large facilities.
6. Customizable
You can easily add new KPIs, departments, or calculations as your hydropower plant evolves.
🚀 Opportunities for Improvement
Even though Excel provides excellent flexibility, you can enhance the scorecard further by:
-
Integrating with real-time data systems (SCADA or IoT sensors).
-
Automating data imports through macros or Power Query.
-
Adding Power BI connectivity for advanced visualization.
-
Including predictive analytics to forecast performance.
-
Enhancing data validation to prevent entry errors.
By combining Excel’s analytical power with automation, your KPI scorecard can evolve into a complete performance intelligence system.
Click to Purchases Hydropower KPI Scorecard in Excel
🏆 Best Practices for the Hydropower KPI Scorecard in Excel
Follow these best practices to make the most of your scorecard:
1. Define Clear KPI Ownership
Assign responsibility for each KPI to a specific person or department. Accountability drives accuracy.
2. Update Data Regularly
Maintain a consistent update cycle — monthly or weekly — to ensure insights stay relevant.
3. Use Conditional Formatting
Highlight underperforming KPIs with color codes (e.g., red for below target, green for above target).
4. Simplify Visuals
Keep charts clean and limited to key insights. Overcrowding visuals can confuse users.
5. Validate Data Entries
Use Excel’s data validation tools to avoid incorrect entries that can distort analysis.
6. Link Actuals and Targets Smartly
Ensure formulas link dynamically to avoid errors when you change periods or KPIs.
7. Protect Critical Sheets
Lock formulas and structure cells to prevent accidental edits or deletions.
8. Keep KPI Definitions Updated
Whenever a KPI formula or definition changes, update it in the KPI Definition sheet to maintain standardization.
9. Use Pivot Tables for Aggregation
Create pivot tables for department, turbine, or regional comparisons — a great way to extract meaningful insights.
10. Backup Regularly
Maintain versioned backups of your scorecard to track historical changes and prevent data loss.
🧠 How This Scorecard Supports Decision-Making
The Hydropower KPI Scorecard in Excel is more than just a reporting tool. It empowers managers to:
-
Detect Inefficiencies Early: Color-coded indicators help you act before issues escalate.
-
Plan Maintenance Strategically: Use trend charts to schedule maintenance during low-demand periods.
-
Optimize Resource Utilization: Balance water use, energy output, and maintenance resources efficiently.
-
Enhance Compliance: Regular tracking ensures environmental and operational standards are met.
-
Drive Continuous Improvement: Historical data analysis helps teams learn from past trends.
🧾 Example Use Case: Monthly Performance Review
Imagine a hydropower plant reviewing performance for July 2025:
-
Turbine Efficiency: 92% vs target 95% → ⚠️ Needs cleaning or inspection.
-
Plant Load Factor: 87% vs target 85% → ✅ Above expectation.
-
Maintenance Cost per MWh: 12 USD vs target 10 USD → 📉 Investigate cause.
-
Water Utilization Ratio: Stable → 👍 Efficiency maintained.
The Scorecard highlights weak areas instantly, helping leadership make data-backed decisions in minutes.
🧩 Why Excel Is Ideal for Hydropower KPI Tracking
Excel remains one of the most practical tools for energy analytics because it offers:
-
Built-in formulas and automation
-
Pivot charts and dashboards
-
Data entry simplicity
-
Scalability from small to large datasets
-
Offline accessibility
You can later migrate the same dataset to Power BI or Google Sheets for enhanced interactivity, without losing structure.
🧭 Conclusion
The Hydropower KPI Scorecard in Excel is a complete performance monitoring solution tailored for hydropower facilities. It simplifies how data is collected, analyzed, and reported — giving operators, engineers, and managers the power to make informed decisions instantly.
By combining KPI visibility, trend tracking, and actionable insights, this scorecard ensures every unit in your plant operates at its best. It’s an affordable, effective, and scalable tool for modern energy management.
💬 Frequently Asked Questions (FAQs)
1. What is a KPI scorecard in hydropower?
A KPI scorecard is a structured system for tracking performance metrics such as generation efficiency, cost per MWh, and equipment downtime in hydropower plants.
2. Why use Excel for KPI tracking?
Excel is easy to use, flexible, and cost-effective. It provides charts, pivot tables, and formulas to visualize performance without specialized software.
3. How often should I update the Hydropower KPI Scorecard?
You should update the scorecard monthly or after every operational report to keep data accurate and timely.
4. Can I add my own KPIs?
Yes. You can customize the KPI Definition sheet by adding new metrics relevant to your organization’s goals.
5. How can I visualize trends effectively?
Use the KPI Trend Sheet, which includes dynamic charts showing MTD and YTD comparisons for Actual, Target, and Previous Year data.
6. Can I connect this Excel scorecard to Power BI?
Absolutely. You can link it directly to Power BI for real-time visual dashboards and interactive analysis.
7. Is this scorecard suitable for small hydropower plants?
Yes. It works for both small and large facilities because of its scalability and customization options.
8. What are the main benefits of using this scorecard?
Improved efficiency, reduced downtime, better reporting, and standardized KPI tracking — all at zero additional cost.
Click to Purchases Hydropower KPI Scorecard in Excel
Visit our YouTube channel to learn step-by-step video tutorials