In today’s highly connected global economy, international trade organizations must continuously monitor performance across exports, imports, logistics, compliance, and operational efficiency. However, many companies still rely on disconnected spreadsheets and manual reporting systems. As a result, managers struggle to identify performance gaps quickly and make timely decisions.
Therefore, businesses increasingly adopt structured KPI scorecards to transform raw trade data into meaningful insights. One practical and powerful solution is the International Trade KPI Scorecard in Excel — a ready-to-use performance monitoring system designed to track international trade KPIs efficiently.
In this comprehensive guide, you will learn everything about this scorecard, including its features, structure, advantages, implementation methods, best practices, and frequently asked questions.
Click to Purchases International Trade KPI Scorecard in Excel
What Is an International Trade KPI Scorecard in Excel?
An International Trade KPI Scorecard in Excel is an interactive performance tracking tool that helps organizations measure global trade operations using Key Performance Indicators (KPIs).
Instead of reviewing multiple reports separately, businesses can monitor all trade metrics in one centralized dashboard. Moreover, Excel automatically converts entered data into visual performance indicators, which allows faster and smarter decision-making.
The scorecard enables organizations to track:
-
Export and import performance
-
Shipment timelines
-
Trade costs and profitability
-
Compliance metrics
-
Vendor and logistics efficiency
-
Operational productivity
Consequently, companies gain better control over international operations.
Why Do Businesses Need an International Trade KPI Scorecard?
International trade involves multiple processes such as customs clearance, transportation coordination, supplier management, and currency handling. Without structured monitoring, organizations often face operational challenges.
Common Problems Without KPI Tracking
-
Delayed shipment monitoring
-
Poor visibility into trade performance
-
Compliance risks
-
Increasing logistics costs
-
Slow management reporting
-
Data inconsistencies
However, when businesses implement a KPI scorecard, they gain clarity and operational control.
Click to Purchases International Trade KPI Scorecard in Excel
Key Features of International Trade KPI Scorecard in Excel
This ready-to-use template contains four structured worksheets, each designed for a specific analytical purpose.
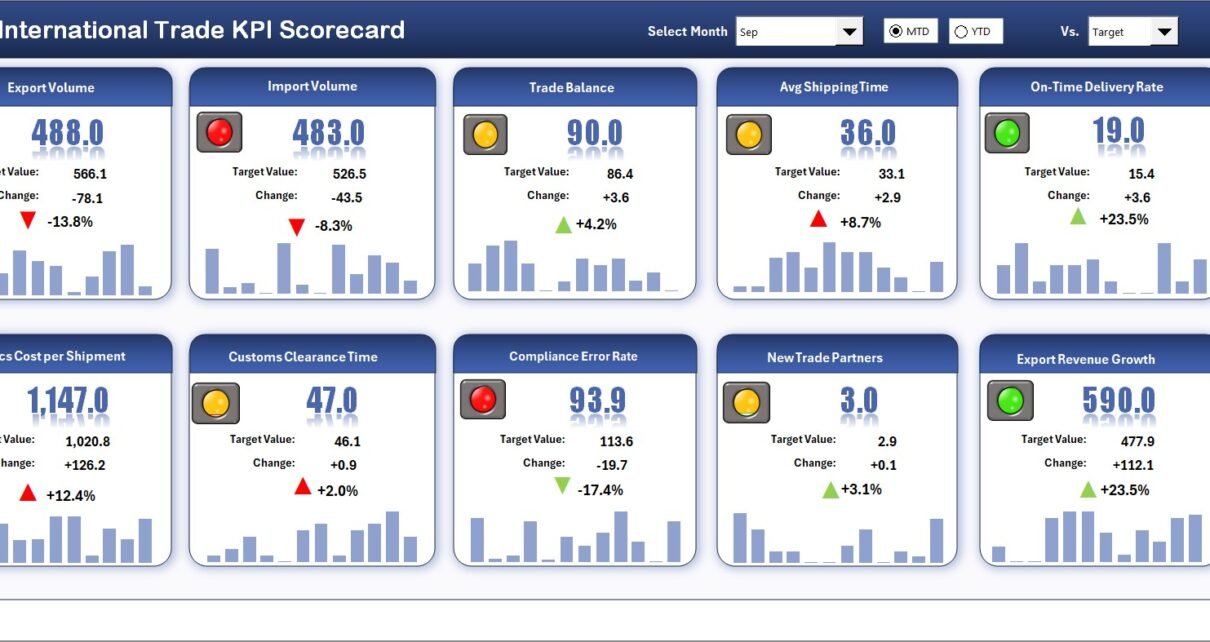
1. Scorecard Sheet – Main Performance Dashboard
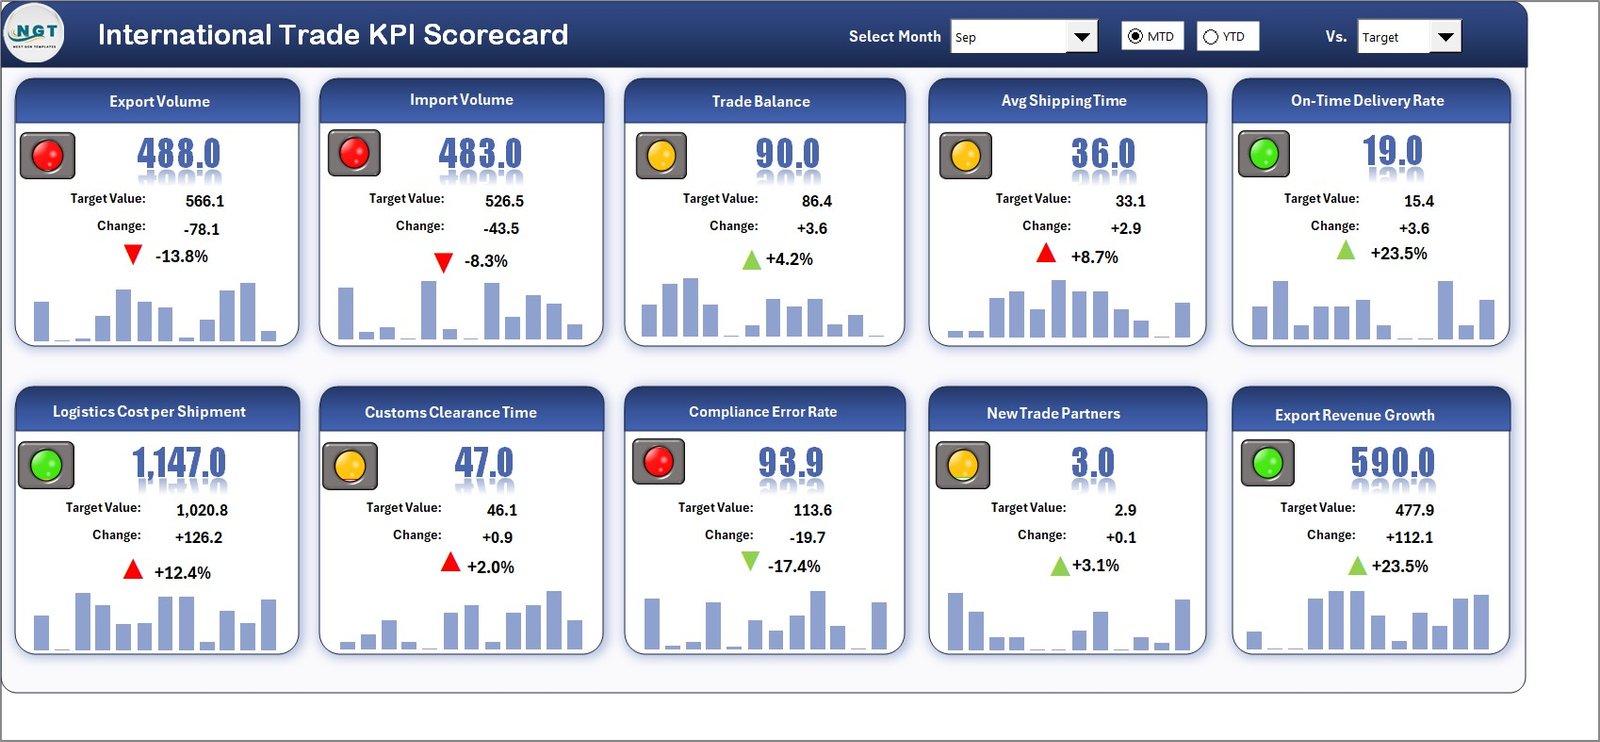
The Scorecard Sheet acts as the central interface where users monitor KPI performance.
Key Functionalities
✅ Dropdown Menus for Dynamic Analysis
Users can easily select:
-
Month
-
MTD (Month-to-Date)
-
YTD (Year-to-Date)
Therefore, performance analysis becomes flexible and interactive.
✅ Actual vs Target Comparison
The dashboard compares actual results against predefined targets. As a result, managers instantly identify performance gaps.
✅ Visual Performance Indicators
Color-coded formatting highlights KPI status:
-
Green → Target achieved
-
Yellow → Near target
-
Red → Requires attention
Thus, users understand performance without complex analysis.
✅ Comprehensive KPI Overview
The scorecard displays:
-
KPI Name
-
KPI Group
-
Units
-
MTD performance
-
YTD performance
Consequently, leadership teams receive a complete performance snapshot.
Click to Purchases International Trade KPI Scorecard in Excel
2. KPI Trend Sheet – Performance Analysis Over Time
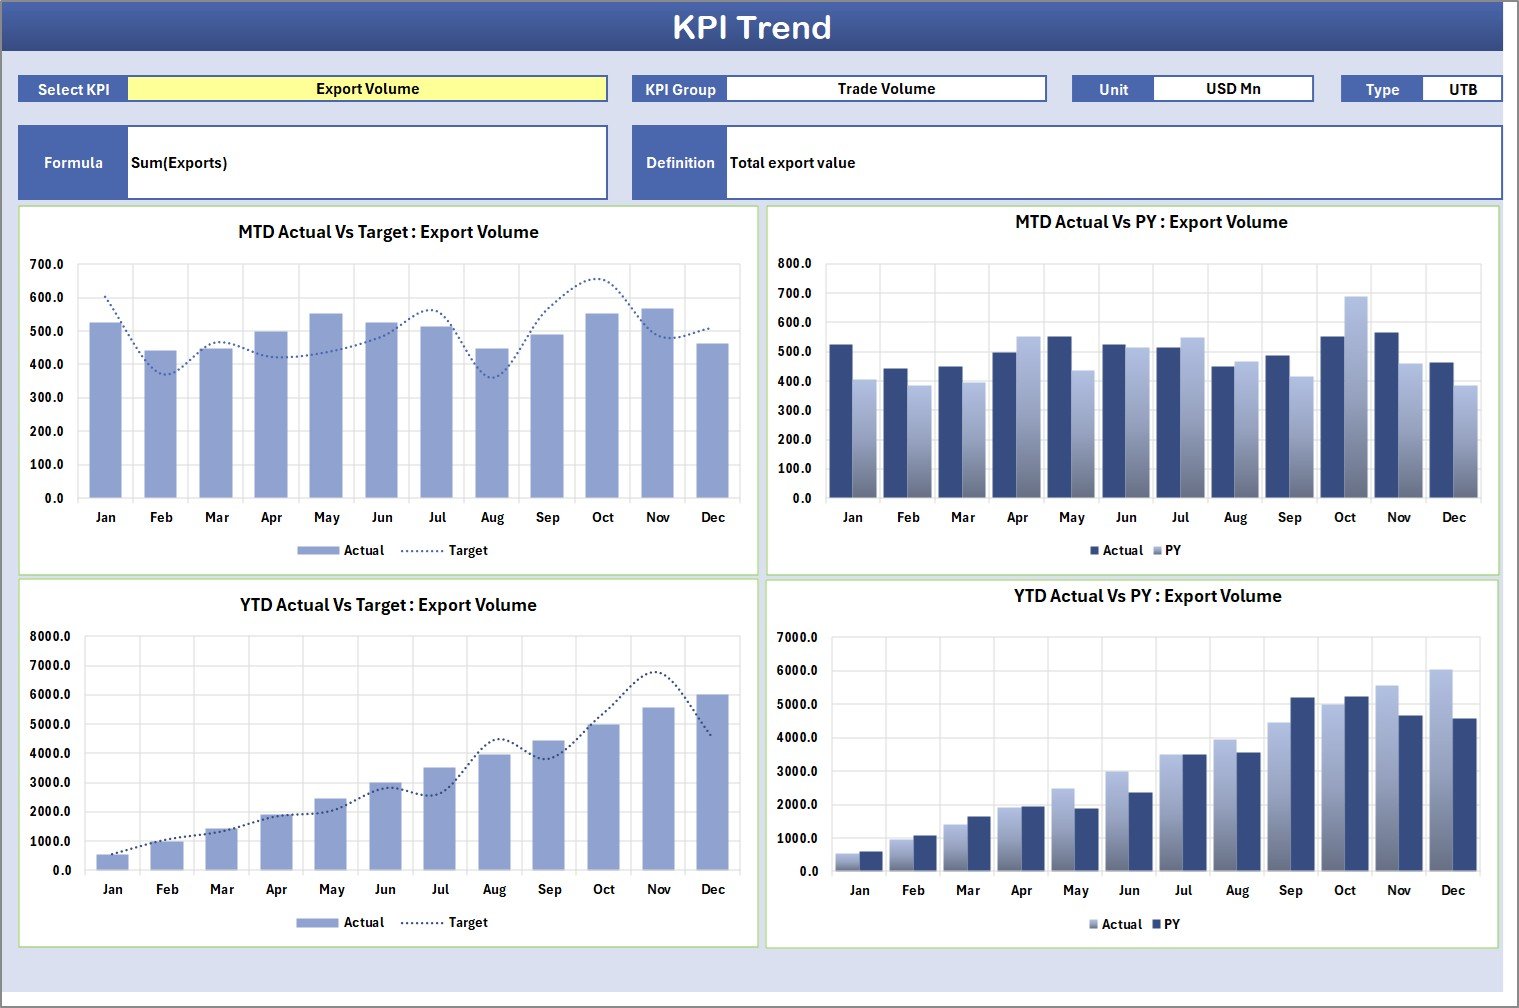
The KPI Trend Sheet provides deeper insights into KPI behavior.
How Does It Work?
Users select a KPI from the dropdown in Cell C3, and the dashboard automatically displays:
-
KPI Group
-
Unit of measurement
-
KPI Type (LTB or UTB)
-
KPI Formula
-
KPI Definition
Additionally, trend charts visualize performance patterns.
Trend Charts Include
-
Actual values
-
Target values
-
Previous Year (PY) comparison
Therefore, organizations easily analyze growth trends and operational consistency.
Click to Purchases International Trade KPI Scorecard in Excel
3. Input Data Sheet – Data Entry Center
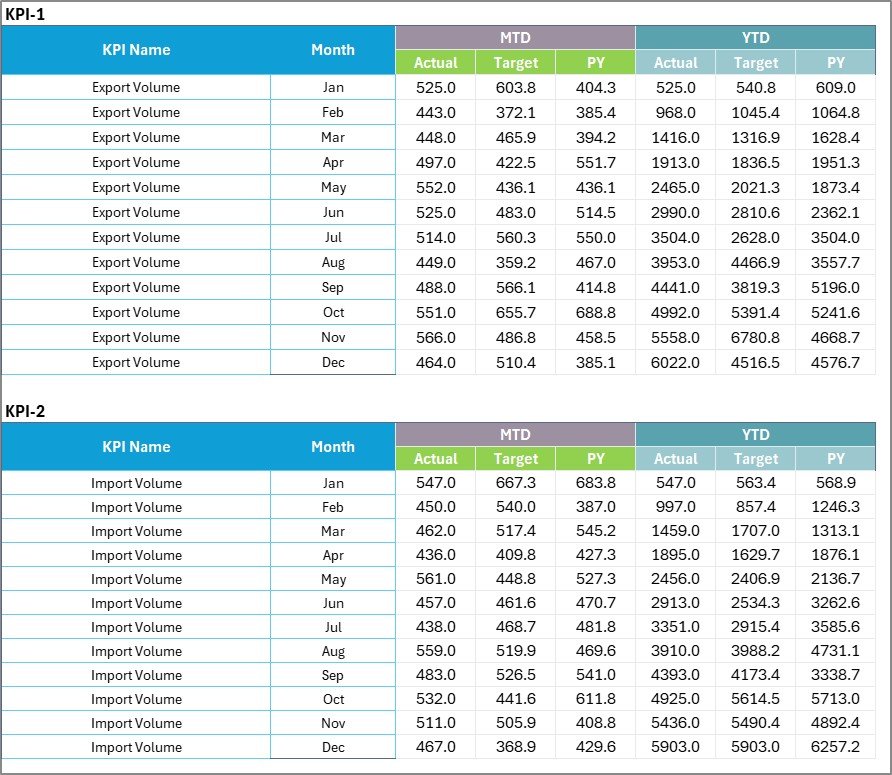
The Input Data Sheet works as the backbone of the scorecard.
Main Capabilities
-
Record KPI actual values
-
Enter targets
-
Update monthly performance data
-
Maintain historical records
Whenever users update data, the entire scorecard refreshes automatically. Hence, reporting always reflects current performance.
4. KPI Definition Sheet – Standardization Hub
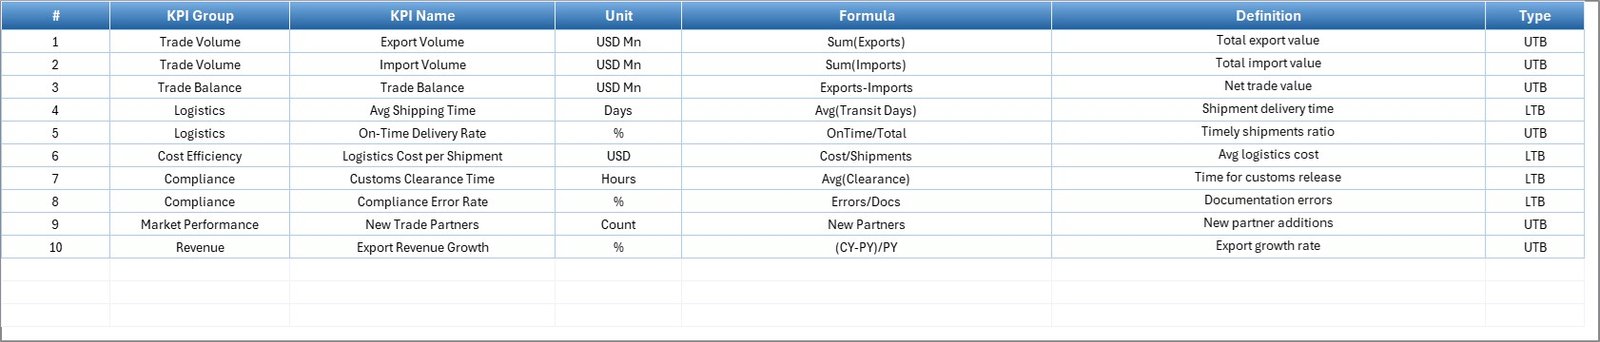
The KPI Definition Sheet ensures KPI clarity and consistency.
Information Captured
-
KPI Name
-
KPI Group
-
Unit
-
Formula
-
KPI Definition
Because of this structure, all stakeholders understand KPI calculations clearly.
Which KPIs Can Be Tracked in International Trade?
Organizations can customize the scorecard according to business needs.
Examples of Trade KPIs
-
Export Order Fulfillment Rate
-
Import Clearance Time
-
Shipment On-Time Delivery %
-
Logistics Cost per Shipment
-
Customs Delay Frequency
-
Trade Compliance Rate
-
Inventory Transit Time
-
Export Revenue Growth
-
Freight Cost Variance
-
Documentation Accuracy Rate
Therefore, companies measure both operational and financial performance.
Click to Purchases International Trade KPI Scorecard in Excel
Advantages of International Trade KPI Scorecard in Excel
Using this scorecard provides several operational and strategic benefits.
✅ Improved Performance Visibility
Managers instantly view trade performance without analyzing multiple reports.
✅ Faster Decision-Making
Visual indicators help leaders take action quickly.
✅ Centralized Data Management
All KPIs remain stored in one structured file.
✅ Easy Customization
Excel allows organizations to modify KPIs anytime.
✅ Cost-Effective Solution
Companies avoid expensive BI software while still gaining analytical insights.
✅ Better Accountability
Teams clearly understand targets and responsibilities.
How Does the Scorecard Improve Trade Operations?
A KPI scorecard does more than reporting. It actively improves operations.
Operational Improvements Include
-
Faster shipment tracking
-
Reduced delays
-
Better supplier coordination
-
Improved compliance monitoring
-
Accurate forecasting
As a result, organizations achieve higher efficiency and profitability.
Click to Purchases International Trade KPI Scorecard in Excel
How to Implement International Trade KPI Scorecard in Excel?
Implementation becomes simple when organizations follow structured steps.
Step 1: Define Trade KPIs
Identify KPIs aligned with trade goals and business strategy.
Step 2: Enter KPI Definitions
Add KPI details in the KPI Definition Sheet.
Step 3: Input Performance Data
Update monthly actual and target values.
Step 4: Analyze Dashboard
Use dropdown filters to review MTD and YTD performance.
Step 5: Monitor Trends
Review KPI trends regularly to identify improvement areas.
Best Practices for the International Trade KPI Scorecard
Following best practices ensures accurate insights and long-term success.
✅ Standardize KPI Definitions
Ensure all departments interpret KPIs the same way.
✅ Update Data Regularly
Maintain monthly updates to keep dashboards accurate.
✅ Use Realistic Targets
Set achievable yet challenging performance goals.
✅ Review Trends Frequently
Trend analysis helps detect risks early.
✅ Maintain Data Accuracy
Validate inputs before reporting cycles.
✅ Train Users
Provide training so teams understand dashboard usage.
Click to Purchases International Trade KPI Scorecard in Excel
Why Excel Is Still Powerful for KPI Monitoring
Although many analytics tools exist, Excel remains widely used.
Reasons Excel Works Well
-
Familiar interface for users
-
Flexible formulas and automation
-
Easy integration with data sources
-
No additional licensing cost
-
Quick deployment
Therefore, Excel continues to serve as an effective business intelligence tool.
Click to Purchases International Trade KPI Scorecard in Excel
Who Should Use This KPI Scorecard?
This template suits multiple industries and roles.
Ideal Users
-
Export & Import Companies
-
Logistics Managers
-
Supply Chain Teams
-
Trade Compliance Officers
-
Operations Managers
-
Financial Analysts
-
International Business Consultants
How Can Businesses Customize the Scorecard?
Companies can easily tailor the template.
Customization Options
-
Add regional KPIs
-
Include currency conversions
-
Track country-wise performance
-
Add department filters
-
Integrate Power Query automation
Therefore, the scorecard adapts to different business models.
Click to Purchases International Trade KPI Scorecard in Excel
Future Opportunities with KPI Scorecards
Businesses can further enhance analytics by:
-
Connecting Excel with Power BI
-
Automating data imports
-
Adding predictive analytics
-
Implementing AI-driven forecasting
Thus, organizations move toward advanced analytics gradually.
Conclusion
International trade operations require accuracy, visibility, and timely decision-making. Without structured monitoring, businesses struggle to manage complex global activities effectively.
The International Trade KPI Scorecard in Excel provides a practical and powerful solution by combining KPI tracking, performance visualization, and trend analysis in one centralized system.
Because the template remains easy to use, customizable, and cost-effective, organizations can improve operational control, enhance performance monitoring, and make data-driven decisions confidently.
Ultimately, this scorecard transforms trade data into actionable insights that support sustainable global growth.
Click to Purchases International Trade KPI Scorecard in Excel
Frequently Asked Questions (FAQs)
1. What is an International Trade KPI Scorecard?
It is an Excel-based dashboard used to monitor export, import, logistics, and trade performance using measurable KPIs.
2. Can beginners use this scorecard?
Yes. The template uses simple Excel features, so beginners can easily update and analyze data.
3. What does MTD and YTD mean?
-
MTD: Month-to-Date performance
-
YTD: Year-to-Date performance
4. Can I customize KPIs in the template?
Yes. You can add, remove, or modify KPIs according to business requirements.
5. Does the dashboard update automatically?
Yes. Once you enter data in the Input Data sheet, all charts and scorecards update automatically.
6. Is Excel suitable for international trade analytics?
Yes. Excel provides flexible formulas, visualization tools, and automation features ideal for KPI monitoring.
7. Who benefits most from this scorecard?
Exporters, importers, logistics companies, supply chain managers, and trade analysts benefit significantly.
Click to Purchases International Trade KPI Scorecard in Excel
Visit our YouTube channel to learn step-by-step video tutorials