In today’s competitive business environment, organizations generate massive volumes of knowledge every single day. However, without a structured system, this valuable information often remains scattered, unused, or forgotten. As a result, teams waste time, duplicate work, and miss critical insights. Therefore, companies increasingly rely on structured tools to organize, measure, and reuse knowledge efficiently.
That is exactly where a Knowledge Management Dashboard in Excel becomes a game-changing solution.
This in-depth and SEO-friendly article explains what a Knowledge Management Dashboard in Excel is, why it matters, how it works, and how organizations can use it to drive productivity, compliance, and cost savings. Moreover, this guide walks you through the complete page-wise dashboard structure, key metrics, advantages, best practices, and frequently asked questions—all written in simple, easy-to-understand language.
Click to Purchases Knowledge Management Dashboard in Excel
What Is a Knowledge Management Dashboard in Excel?
A Knowledge Management Dashboard in Excel is a ready-to-use, interactive reporting tool that helps organizations track, analyze, and improve how knowledge gets created, accessed, reused, and validated across departments.
Instead of storing documents, SOPs, guidelines, training materials, and best practices in disconnected folders or systems, this dashboard centralizes performance tracking into one visual interface. Consequently, decision-makers gain instant clarity on how knowledge contributes to cost savings, time efficiency, compliance, and organizational learning.
Because the dashboard runs entirely in Microsoft Excel, it remains flexible, affordable, and easy to customize—even for non-technical users.
Why Do Organizations Need a Knowledge Management Dashboard?
Knowledge is one of the most valuable assets in any organization. However, unmanaged knowledge quickly becomes a liability. Therefore, organizations need a clear system to monitor and optimize how employees consume and reuse knowledge.
A Knowledge Management Dashboard in Excel helps because:
-
It reduces repeated work through knowledge reuse
-
It saves time by improving access to validated information
-
It supports compliance and governance goals
-
It measures real business impact using data
-
It encourages collaboration across departments
As a result, teams shift from reactive information searching to proactive knowledge utilization.
How Does a Knowledge Management Dashboard in Excel Work?
This dashboard connects structured knowledge data with visual analytics. First, users capture raw data in a Data Sheet. Then, Excel processes that data using formulas, pivot tables, and charts. Finally, interactive slicers allow users to filter insights by department, owner, knowledge type, access level, or time period.
Because everything runs inside Excel, users do not need external software or advanced technical skills.
Click to Purchases Knowledge Management Dashboard in Excel
Key Features of the Knowledge Management Dashboard in Excel
The Knowledge Management Dashboard in Excel comes with a clean layout, intuitive navigation, and five dedicated analytical pages. Each page answers specific business questions while maintaining consistency and clarity.
How Does the Page Navigator Improve Usability?
The Page Navigator, located on the left side, allows users to move smoothly between dashboard pages. Instead of scrolling or searching through tabs, users instantly access the required analysis.
This feature improves user experience and saves time, especially for leadership reviews and presentations.
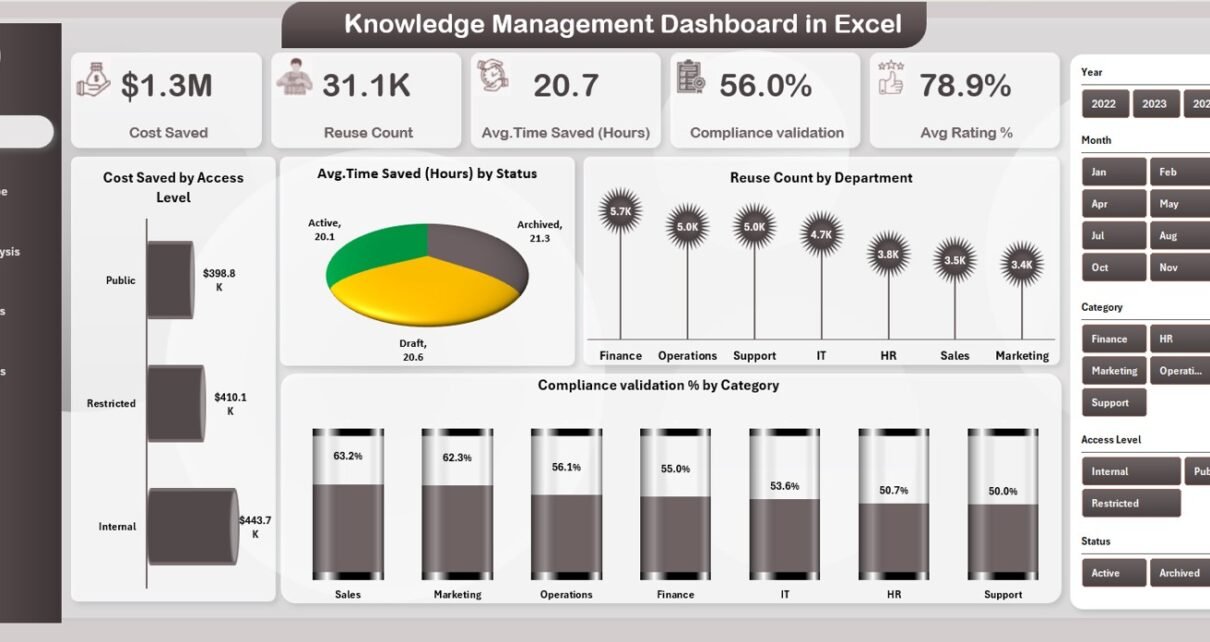
Overview Page: How Do You Measure Knowledge Impact at a Glance?
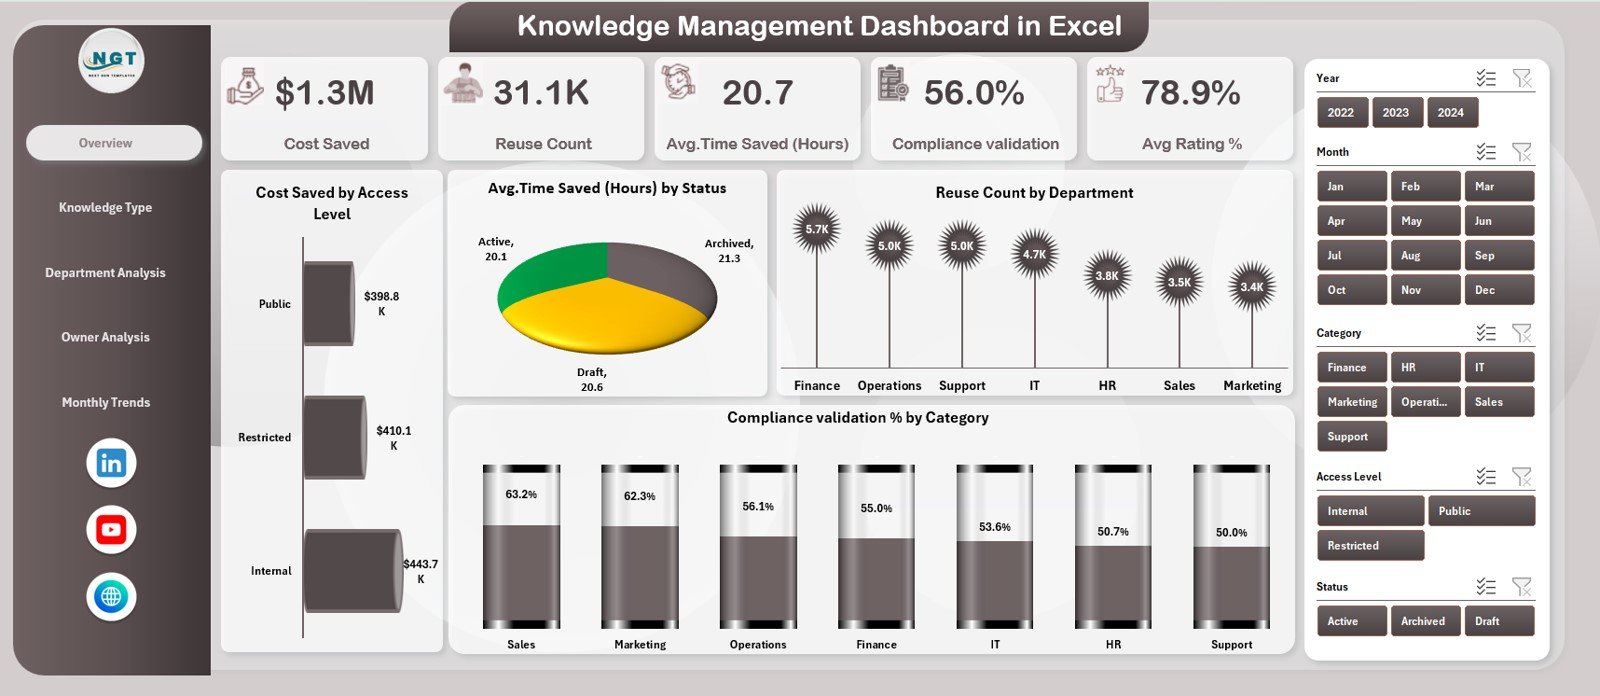
The Overview Page acts as the command center of the dashboard. It provides a high-level summary of key knowledge metrics while enabling quick filtering through right-side slicers.
Key KPI Cards on the Overview Page
The dashboard displays powerful KPI cards that instantly communicate performance:
-
Cost Saved
-
Reuse Count
-
Average Time Saved (Hours)
-
Compliance Validation
-
Average Rating %
These KPIs allow leaders to assess whether knowledge initiatives deliver measurable business value.
Charts on the Overview Page
The Overview Page also includes four insightful charts:
-
Cost Saved by Access Level
-
Average Time Saved (Hours) by Status
-
Reuse Count by Department
-
Compliance Validation % by Category
Together, these visuals explain where knowledge delivers the highest impact and where improvement is required.
Click to Purchases Knowledge Management Dashboard in Excel
Knowledge Type Analysis: Which Knowledge Delivers the Most Value?
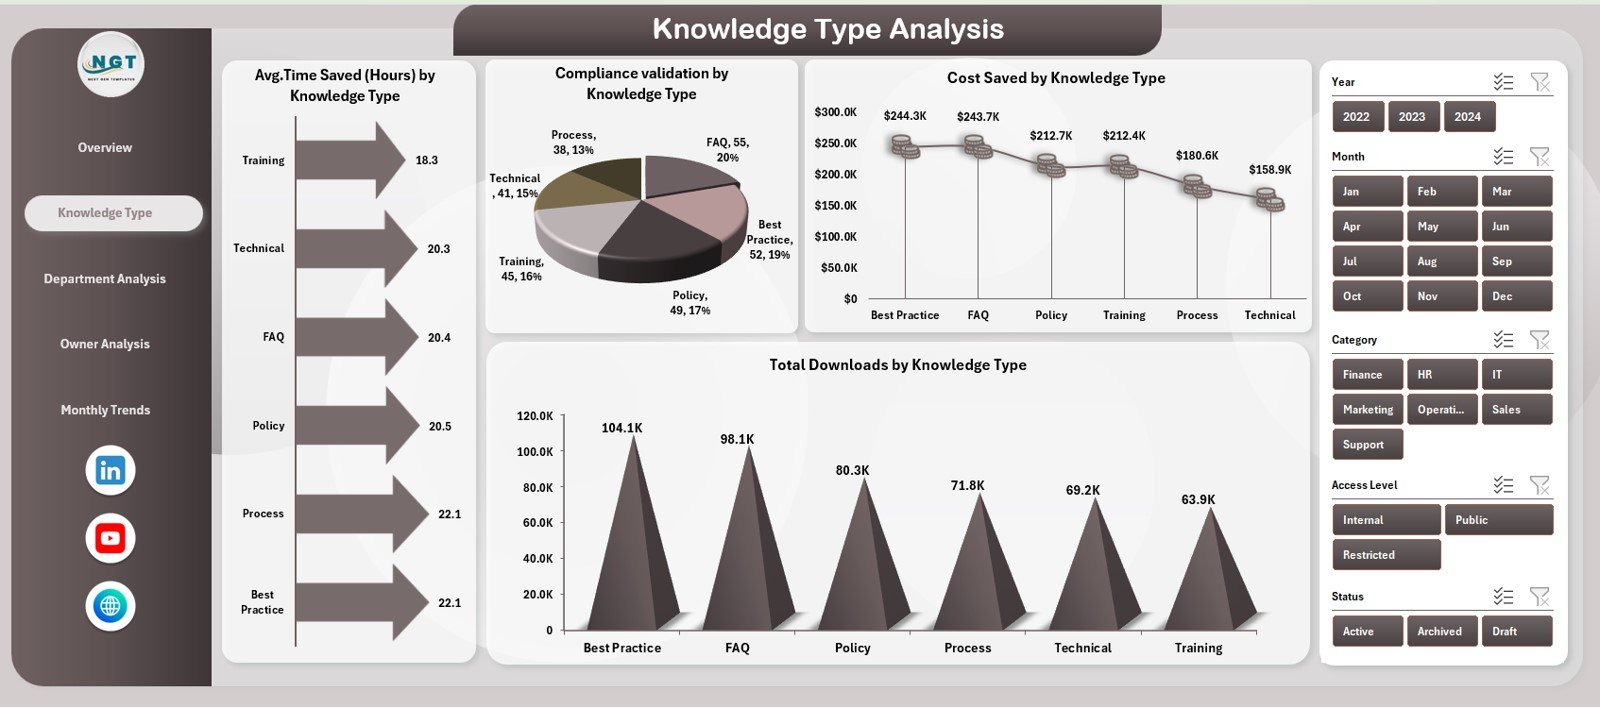
The Knowledge Type Analysis Page focuses on understanding how different types of knowledge perform across the organization.
Charts on the Knowledge Type Analysis Page
This page includes four focused charts:
-
Average Time Saved (Hours) by Knowledge Type
-
Compliance Validation by Knowledge Type
-
Cost Saved by Knowledge Type
-
Total Downloads by Knowledge Type
Because knowledge does not deliver equal value, this analysis helps organizations invest in the most impactful formats such as SOPs, templates, training guides, or best-practice documents.
Department Analysis: Which Teams Use Knowledge Most Effectively?
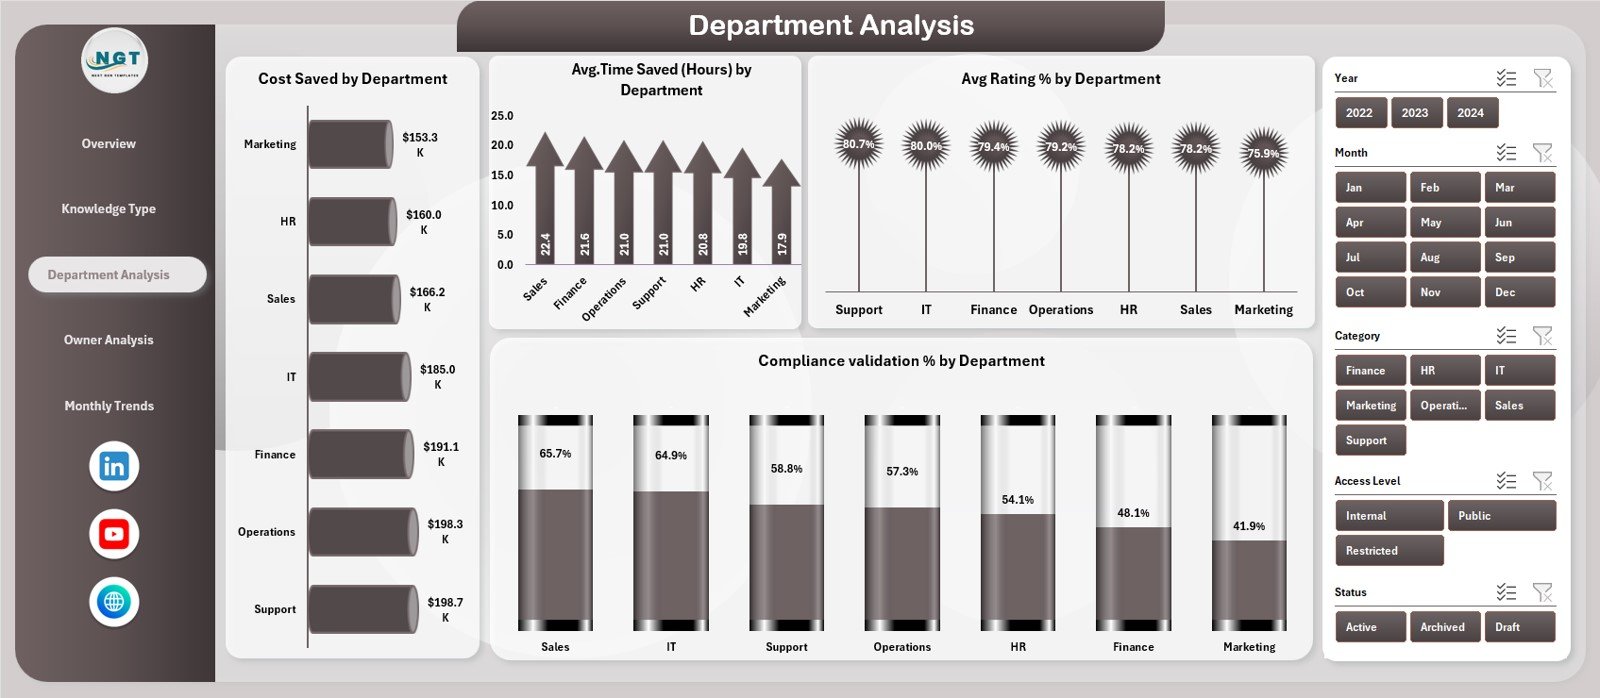
The Department Analysis Page reveals how different teams adopt and benefit from shared knowledge.
Charts on the Department Analysis Page
This page includes four department-focused visuals:
-
Cost Saved by Department
-
Average Time Saved (Hours) by Department
-
Average Rating % by Department
-
Compliance Validation % by Department
As a result, leaders identify high-performing teams and replicate their knowledge practices across other departments.
Owner Analysis: Who Contributes the Most Valuable Knowledge?
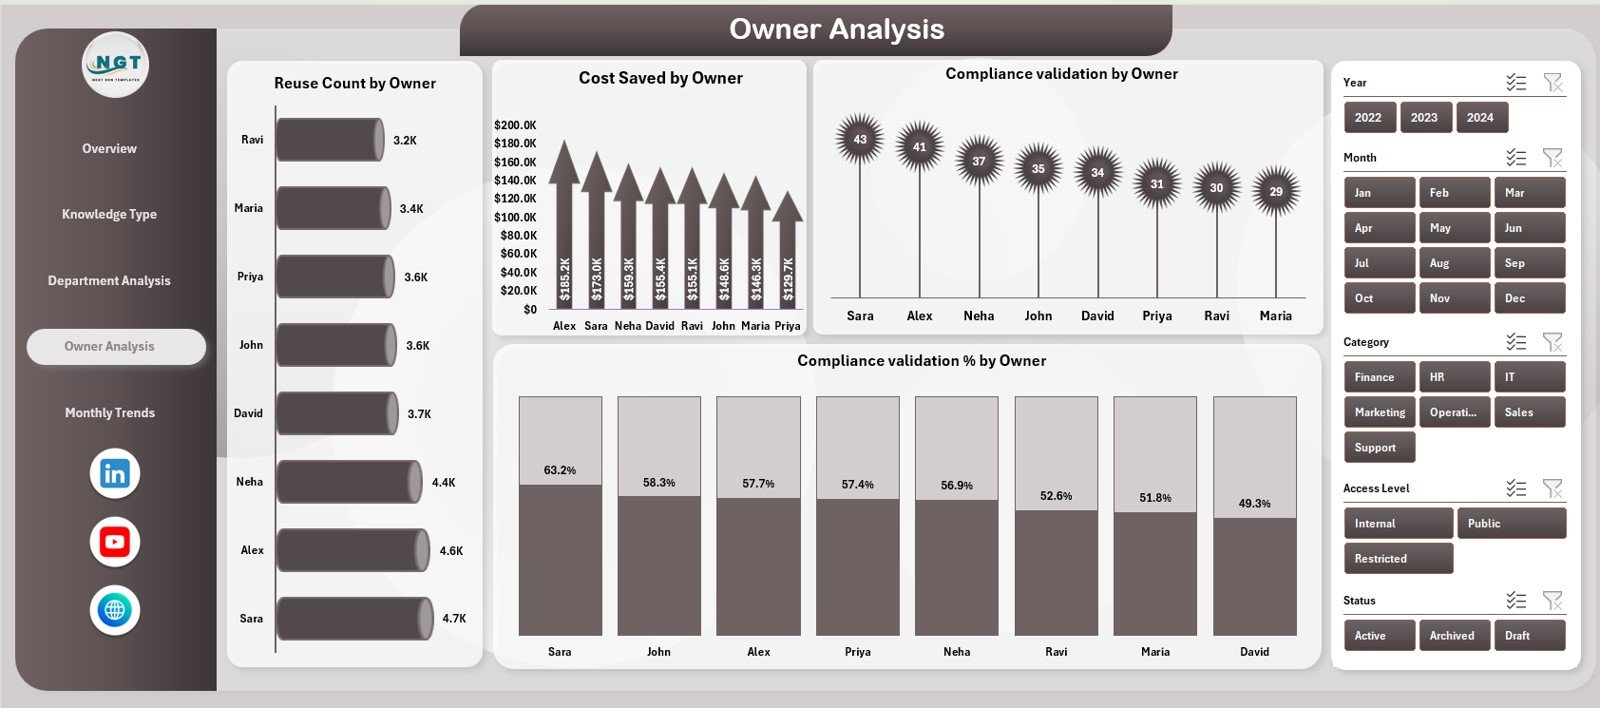
The Owner Analysis Page highlights individual knowledge contributors and owners.
Charts on the Owner Analysis Page
This page includes four contributor-centric charts:
-
Reuse Count by Owner
-
Cost Saved by Owner
-
Compliance Validation by Owner
-
Compliance Validation % by Owner
This analysis encourages accountability and motivates employees to create high-quality, reusable knowledge assets.
Click to Purchases Knowledge Management Dashboard in Excel
Monthly Trends: How Does Knowledge Performance Change Over Time?
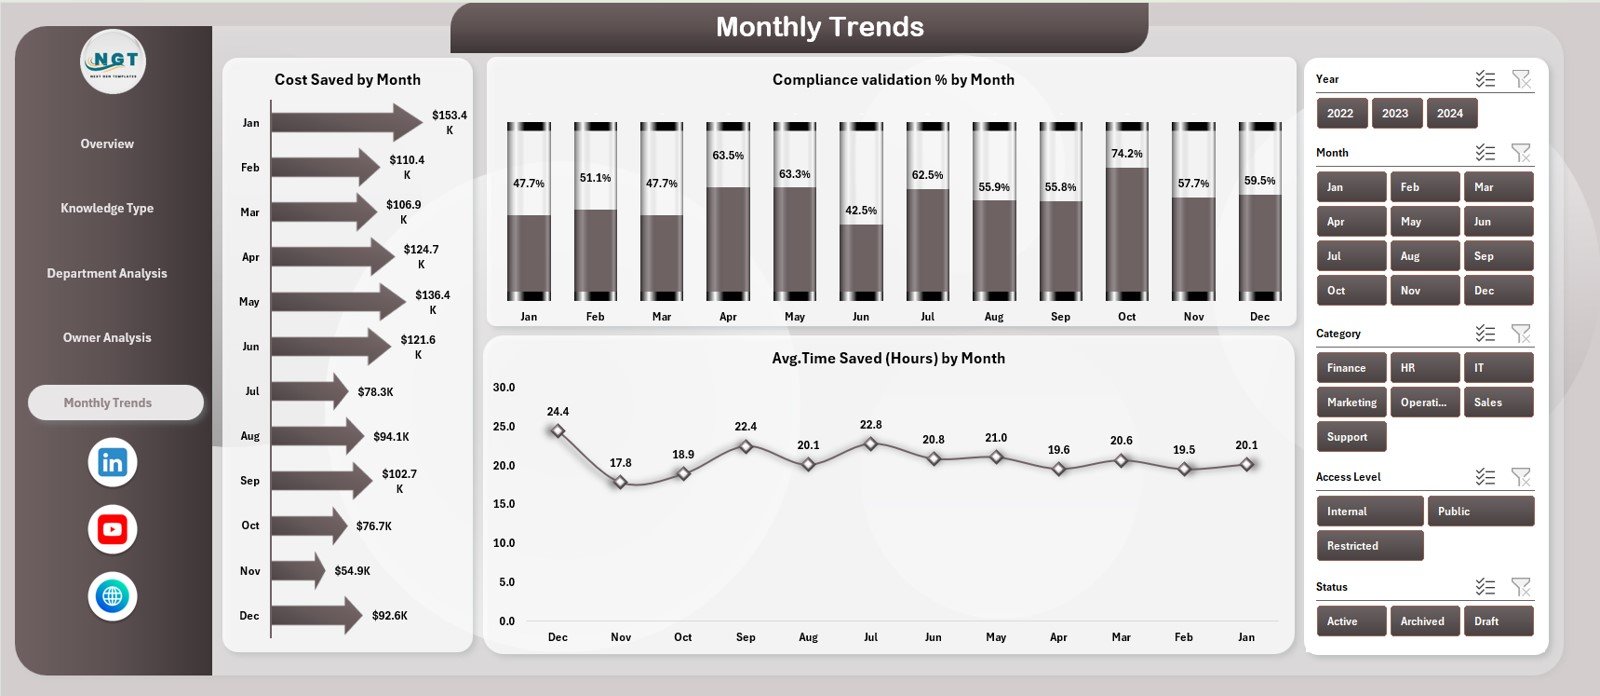
The Monthly Trends Page helps organizations track progress and consistency.
Charts on the Monthly Trends Page
This page includes three trend-based visuals:
-
Cost Saved by Month
-
Compliance Validation % by Month
-
Average Time Saved (Hours) by Month
Because knowledge management is a continuous process, these trends help teams evaluate improvement initiatives over time.
What Is the Role of the Data Sheet?
The Data Sheet stores all raw knowledge records. Users enter structured data such as:
-
Knowledge type
-
Department
-
Owner
-
Access level
-
Time saved
-
Cost saved
-
Compliance status
-
Ratings
-
Download counts
Once data updates, the dashboard refreshes automatically, ensuring real-time insights.
Click to Purchases Knowledge Management Dashboard in Excel
Advantages of Knowledge Management Dashboard in Excel
A Knowledge Management Dashboard in Excel delivers measurable and strategic benefits.
Key Advantages
-
🚀 Improves productivity by reducing search time
-
💰 Tracks real cost savings from knowledge reuse
-
⏱️ Measures time efficiency in hours
-
📊 Provides data-driven insights for leadership
-
📋 Strengthens compliance and governance
-
🤝 Encourages collaboration and accountability
-
📈 Supports continuous improvement initiatives
Because Excel remains widely used, adoption stays fast and friction-free.
Who Should Use a Knowledge Management Dashboard in Excel?
This dashboard suits a wide range of users, including:
-
Knowledge managers
-
HR and learning teams
-
Process excellence teams
-
IT documentation teams
-
Compliance officers
-
Department heads
-
Senior leadership
Therefore, any organization that values structured knowledge benefits from this dashboard.
Click to Purchases Knowledge Management Dashboard in Excel
Best Practices for the Knowledge Management Dashboard in Excel
To maximize value, organizations should follow proven best practices.
1. Standardize Knowledge Entry
Use consistent naming, categories, and definitions. This practice improves reporting accuracy.
2. Update Data Regularly
Frequent updates ensure dashboards reflect current knowledge performance.
3. Validate Compliance Periodically
Always review compliance status to avoid outdated or risky knowledge usage.
4. Encourage Knowledge Ownership
Assign clear owners to each knowledge asset to maintain accountability.
5. Review Monthly Trends
Analyze trends monthly to track progress and identify improvement areas.
6. Use Insights for Decision-Making
Do not treat the dashboard as a reporting tool only. Instead, use insights to improve processes.
How Does This Dashboard Support Business Decision-Making?
This dashboard translates abstract knowledge into measurable metrics. Therefore, leaders gain clarity on ROI, efficiency, and risk reduction. Moreover, teams align knowledge initiatives with business goals.
As a result, organizations shift from information overload to strategic knowledge utilization.
Conclusion: Why Knowledge Management Dashboard in Excel Is Essential
Knowledge fuels innovation, efficiency, and growth. However, without measurement, knowledge remains invisible. A Knowledge Management Dashboard in Excel transforms scattered information into actionable insights.
By tracking cost savings, time efficiency, compliance, and reuse, organizations unlock the true value of knowledge. Furthermore, Excel-based design ensures accessibility, flexibility, and ease of adoption.
Ultimately, this dashboard empowers organizations to work smarter, faster, and more confidently.
Frequently Asked Questions (FAQs)
What is a Knowledge Management Dashboard in Excel?
A Knowledge Management Dashboard in Excel is a visual tool that tracks knowledge usage, reuse, cost savings, compliance, and performance metrics in one interactive Excel file.
Why should organizations use Excel for knowledge management?
Excel offers flexibility, affordability, and familiarity. Therefore, teams adopt it quickly without training or extra software costs.
Can this dashboard work for large organizations?
Yes. The dashboard scales easily by adding more records to the Data Sheet while keeping insights structured.
Does this dashboard require advanced Excel skills?
No. Basic Excel knowledge is enough to use and update the dashboard.
How often should organizations update the dashboard?
Organizations should update the dashboard weekly or monthly to ensure accurate insights.
Can this dashboard support compliance audits?
Yes. The compliance validation metrics help organizations track and demonstrate governance standards.
Click to Purchases Knowledge Management Dashboard in Excel
Visit our YouTube channel to learn step-by-step video tutorials