Organizations generate knowledge every single day—documents, SOPs, best practices, training material, and lessons learned. However, most organizations struggle to measure how effectively this knowledge is reused, how much cost it saves, and whether it truly adds value. As a result, knowledge initiatives often fail to show clear ROI.
That is exactly why a Knowledge Management Dashboard in Power BI becomes a powerful and practical solution. This dashboard converts knowledge-related data into clear, visual, and actionable insights. Moreover, it helps leadership understand how knowledge contributes to productivity, compliance, and cost savings.
In this detailed and SEO-friendly blog post, you will learn what a Knowledge Management Dashboard in Power BI is, why it matters, how it works, its page-wise structure, key KPIs, advantages, best practices, and frequently asked questions. The language remains simple, clear, and business-focused so you can use it immediately.
Click to Purchases Knowledge Management Dashboard in Power BI
What Is a Knowledge Management Dashboard in Power BI?
A Knowledge Management Dashboard in Power BI is an interactive analytical solution that tracks, measures, and visualizes knowledge usage and effectiveness across an organization.
Instead of relying on static KM reports, this dashboard provides:
-
Real-time insights
-
Interactive slicers
-
KPI cards
-
Trend-based analysis
As a result, organizations can clearly see how knowledge is reused, how much time and cost it saves, and how compliant and effective it is.
Most importantly, Power BI allows decision-makers to drill down from high-level metrics to detailed insights within seconds.
Why Do Organizations Need a Knowledge Management Dashboard?
Knowledge initiatives often fail because leaders cannot measure their impact. Without data, KM remains a support function instead of a strategic asset.
A Knowledge Management Dashboard in Power BI helps because:
-
It proves ROI of knowledge reuse
-
It shows time and cost savings
-
It improves compliance visibility
-
It identifies high-performing departments and owners
-
It supports continuous improvement
As a result, organizations move from knowledge storage to knowledge-driven performance.
Click to Purchases Knowledge Management Dashboard in Power BI
How Does a Knowledge Management Dashboard in Power BI Work?
The dashboard works on a simple and scalable approach.
First, organizations collect knowledge-related data such as downloads, reuse counts, ratings, time saved, and compliance status. Then, Power BI models this data and displays insights using visuals, charts, and KPI cards.
Because Power BI supports slicers and filters, users can analyze data by:
-
Knowledge type
-
Department
-
Owner
-
Month
-
Access level
Therefore, analysis becomes flexible, fast, and insightful.
Click to Purchases Knowledge Management Dashboard in Power BI
Overall Structure of the Knowledge Management Dashboard in Power BI
This ready-to-use dashboard includes 5 well-designed pages in the Power BI Desktop file. Each page focuses on a specific aspect of knowledge performance.
Let us understand each page in detail.
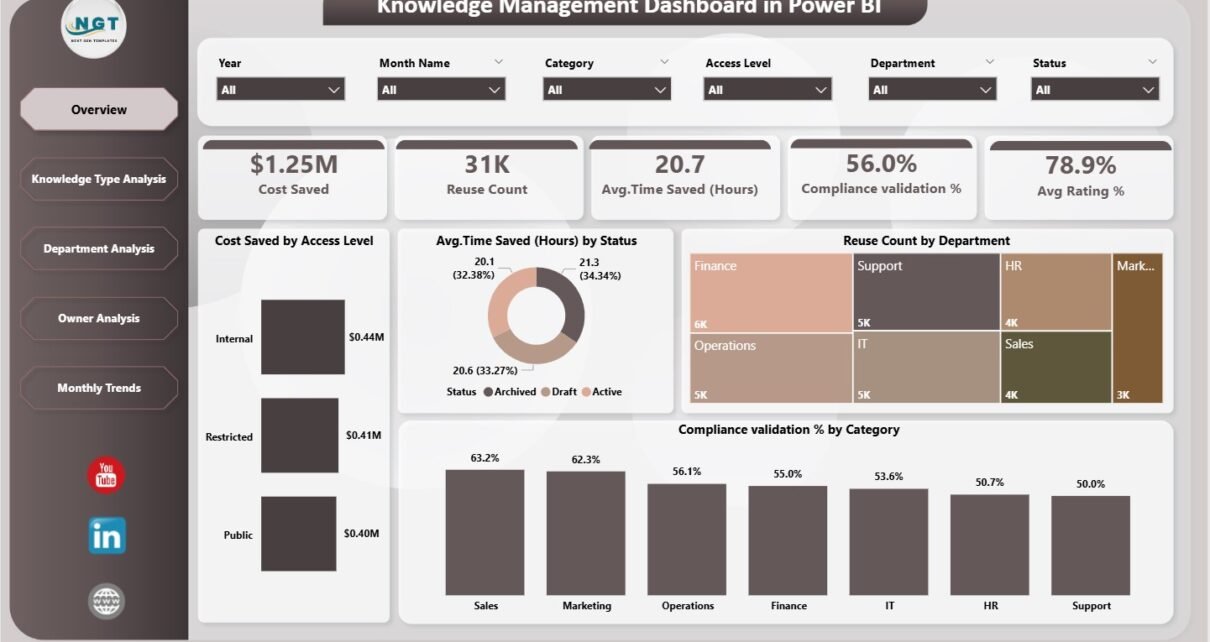
1. Overview Page – High-Level Knowledge Performance Snapshot
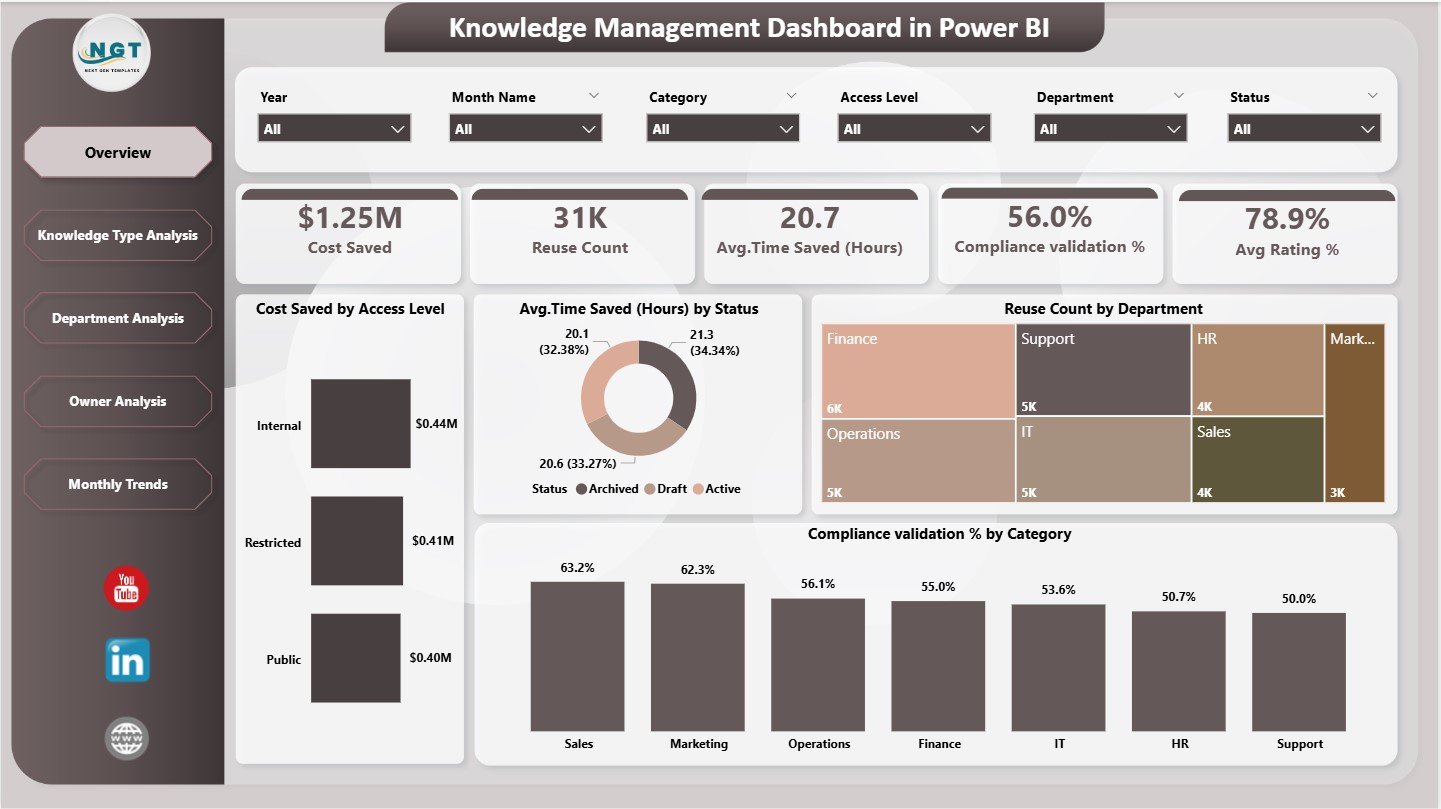
The Overview Page is the main landing page of the Knowledge Management Dashboard in Power BI. This page provides a quick and consolidated view of overall KM performance.
KPI Cards on the Overview Page
At the top of the page, the dashboard displays five KPI cards:
-
Cost Saved – Total monetary savings due to knowledge reuse
-
Reuse Count – Number of times knowledge assets were reused
-
Average Time Saved (Hours) – Productivity gain from reused knowledge
-
Compliance Validation % – Percentage of compliant knowledge assets
-
Average Rating % – User satisfaction with knowledge content
Because of these cards, leadership can instantly assess KM effectiveness.
Charts on the Overview Page
Below the KPI cards, the dashboard includes four insightful charts:
-
Cost Saved by Access Level
-
Average Time Saved (Hours) by Status
-
Reuse Count by Department
-
Compliance Validation % by Category
These visuals help users quickly identify where knowledge creates the most value.
2. Knowledge Type Analysis Page – Understanding Content Performance
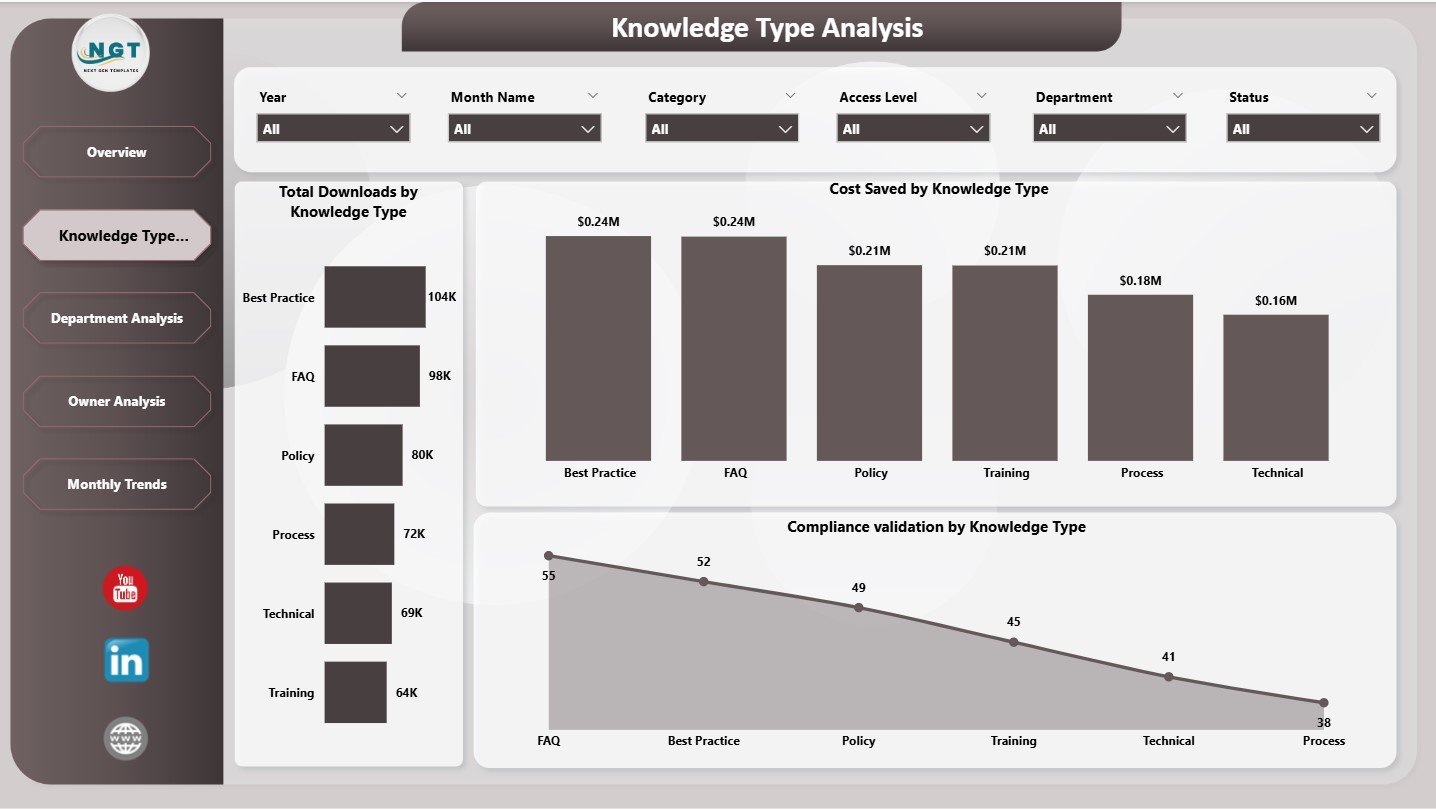
The Knowledge Type Analysis Page focuses on how different types of knowledge perform across the organization.
Charts on the Knowledge Type Analysis Page
This page includes three charts:
-
Total Downloads by Knowledge Type
-
Cost Saved by Knowledge Type
-
Compliance Validation by Knowledge Type
Because of this analysis, organizations can clearly see:
-
Which knowledge formats drive maximum usage
-
Which content types generate the highest savings
-
Which types require compliance improvement
As a result, content strategy becomes data-driven.
Click to Purchases Knowledge Management Dashboard in Power BI
3. Department Analysis Page – Department-Wise Knowledge Impact
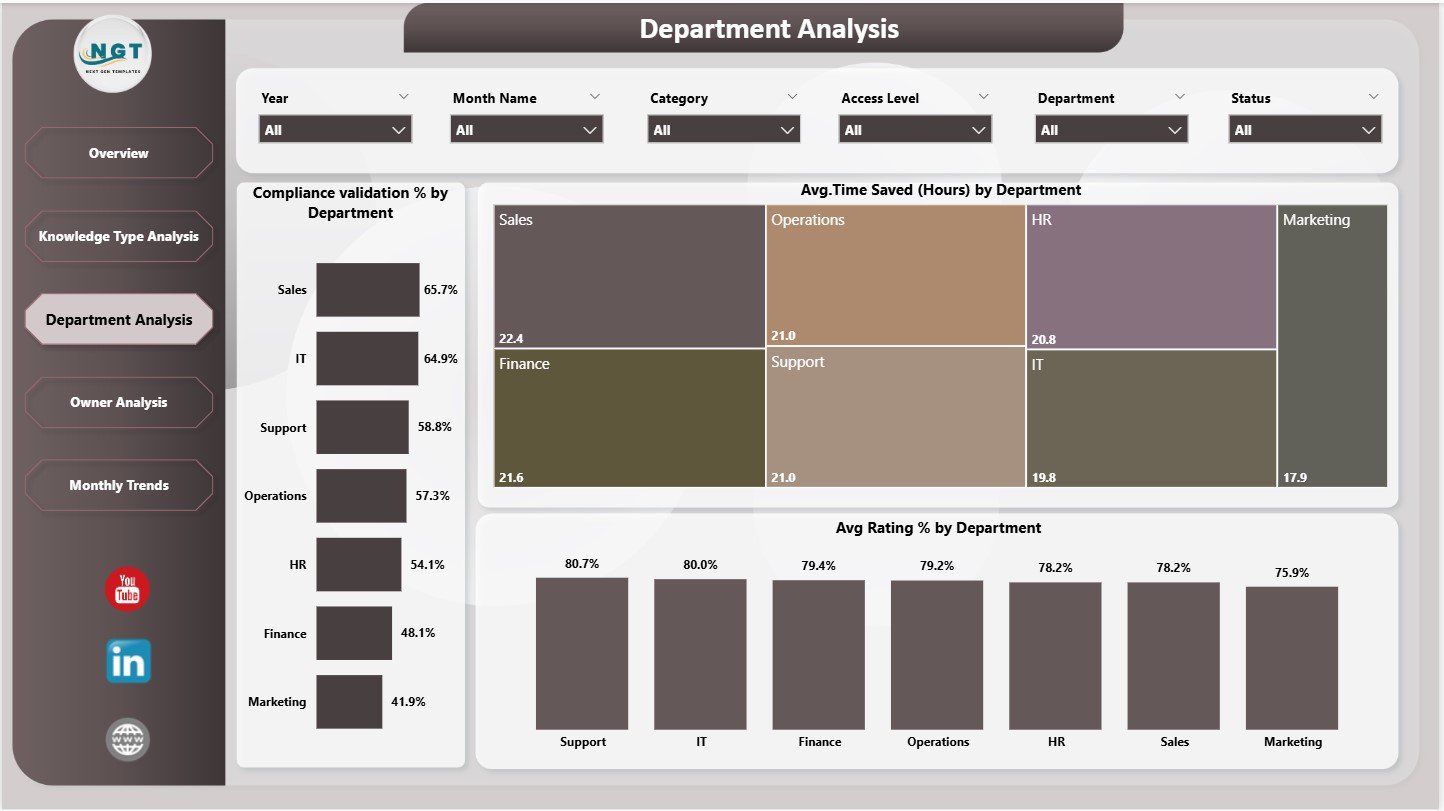
The Department Analysis Page shows how knowledge performs across different departments.
Charts on the Department Analysis Page
This page includes three charts:
-
Compliance Validation % by Department
-
Average Time Saved (Hours) by Department
-
Average Rating % by Department
With this view, leadership can:
-
Identify departments that actively reuse knowledge
-
Spot departments needing KM adoption support
-
Compare satisfaction and compliance levels
Therefore, KM initiatives become more targeted and effective.
4. Owner Analysis Page – Measuring Knowledge Ownership
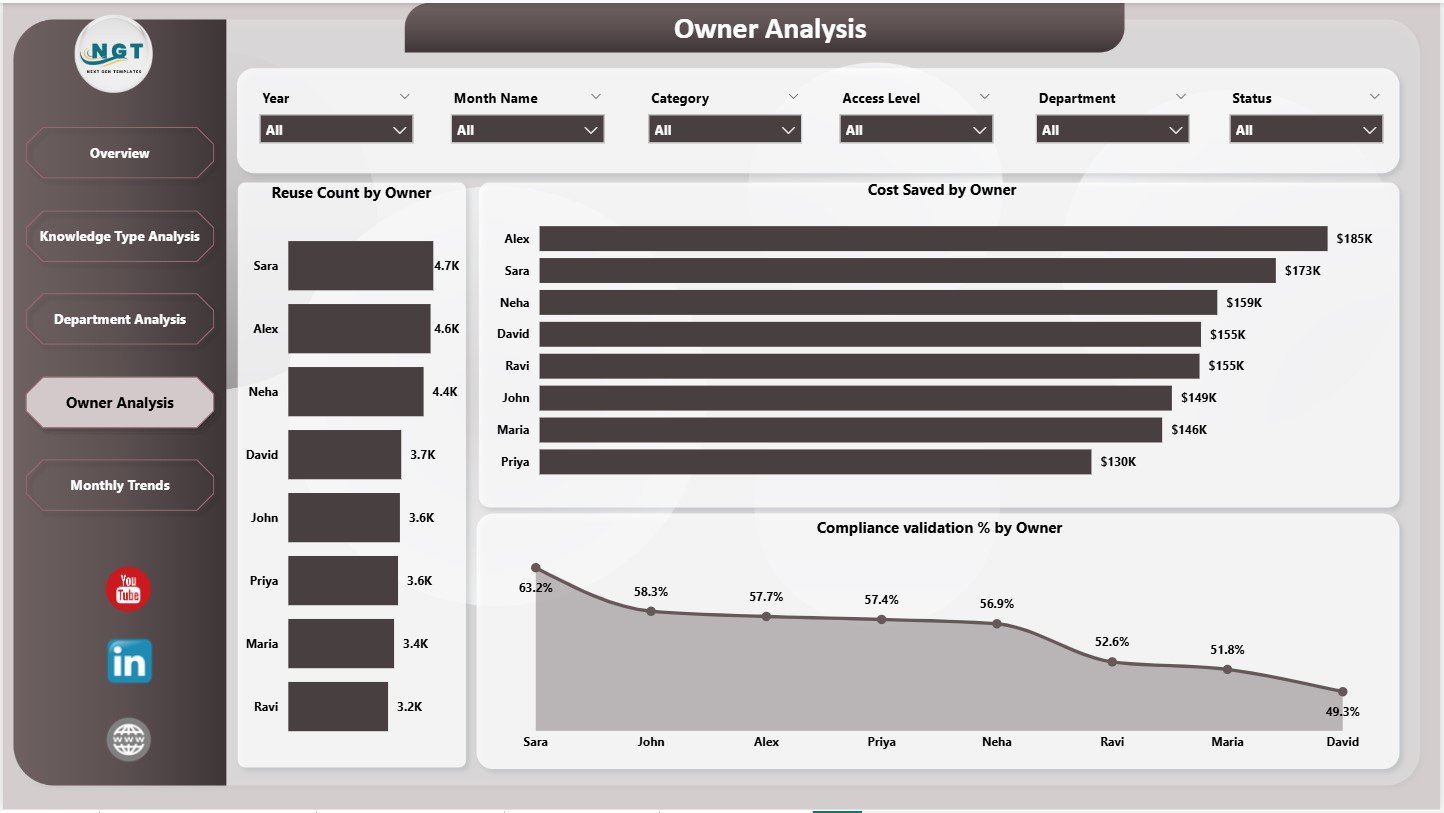
The Owner Analysis Page focuses on individuals or teams responsible for creating and maintaining knowledge.
Charts on the Owner Analysis Page
This page includes three charts:
-
Reuse Count by Owner
-
Cost Saved by Owner
-
Compliance Validation % by Owner
Because of this page, organizations can:
-
Recognize top knowledge contributors
-
Encourage ownership and accountability
-
Improve content quality and governance
As a result, KM culture strengthens across the organization.
Click to Purchases Knowledge Management Dashboard in Power BI
5. Monthly Trends Page – Tracking Knowledge Performance Over Time
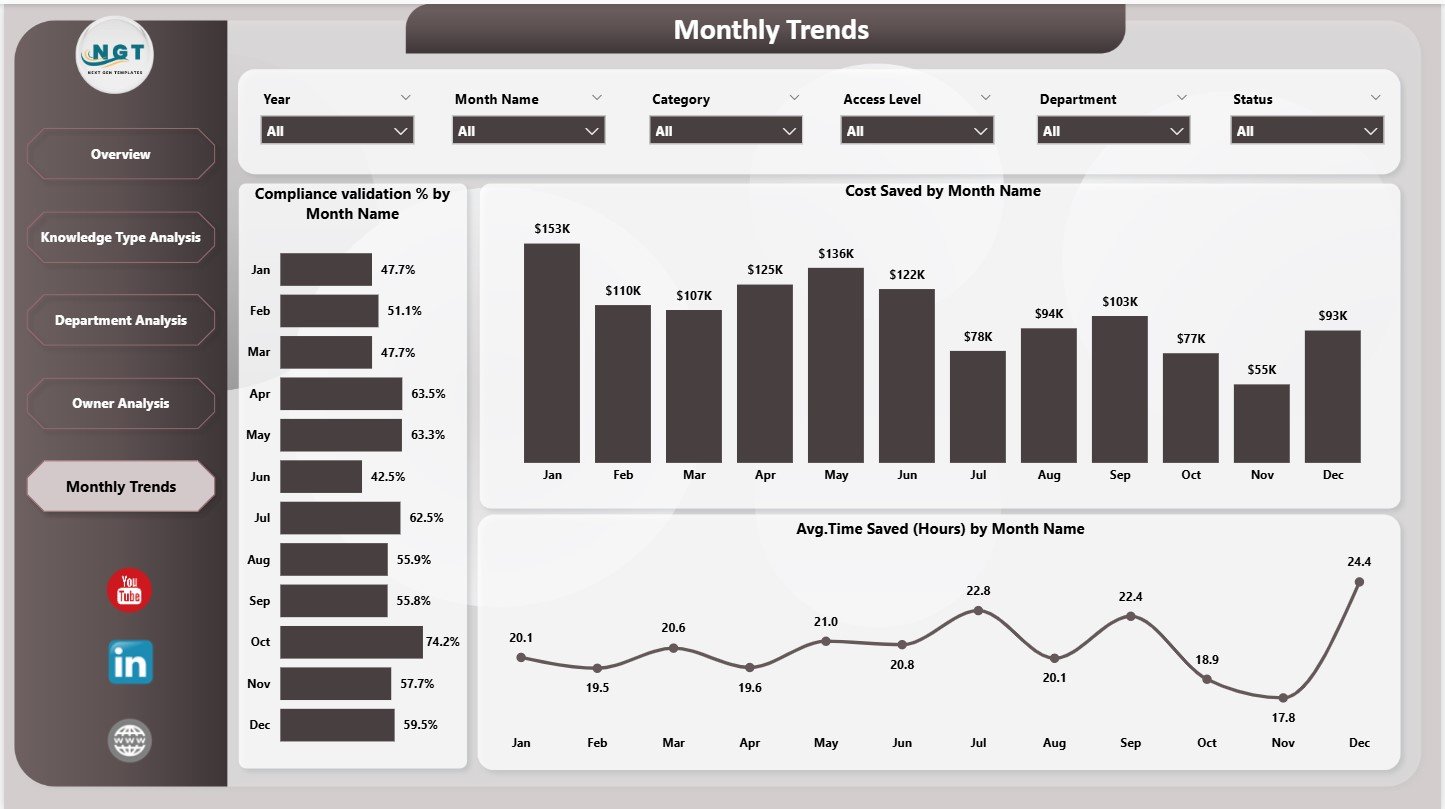
The Monthly Trends Page shows how KM performance evolves over time.
Charts on the Monthly Trends Page
This page includes three trend charts:
-
Compliance Validation % by Month Name
-
Cost Saved by Month Name
-
Average Time Saved (Hours) by Month Name
These trends help organizations:
-
Track KM maturity
-
Identify seasonal patterns
-
Measure long-term improvement
Therefore, leadership gains confidence in KM investments.
Key KPIs Tracked in a Knowledge Management Dashboard
A Knowledge Management Dashboard in Power BI typically tracks KPIs such as:
-
Knowledge Reuse Count
-
Cost Savings
-
Time Saved (Hours)
-
Compliance Validation %
-
Average Rating %
-
Downloads
-
Knowledge Ownership Metrics
Because Power BI models remain flexible, organizations can easily add more KPIs.
Click to Purchases Knowledge Management Dashboard in Power BI
Advantages of Knowledge Management Dashboard in Power BI
Using a Knowledge Management Dashboard in Power BI delivers significant benefits.
Key Advantages
-
✅ Clear visibility into knowledge value
-
✅ Quantified cost and time savings
-
✅ Improved compliance tracking
-
✅ Department and owner accountability
-
✅ Interactive and real-time analysis
-
✅ Scalable and professional reporting
As a result, KM becomes a strategic function instead of a support activity.
How Does This Dashboard Improve Decision-Making?
This dashboard transforms KM data into actionable insights. For example:
-
If compliance drops, teams can review content immediately
-
If reuse remains low, leaders can improve awareness
-
If certain knowledge types perform better, teams can replicate success
Therefore, decisions become proactive, data-driven, and aligned with business goals.
Common Challenges Without a Knowledge Management Dashboard
Without a structured KM dashboard, organizations often face:
-
Lack of KM ROI visibility
-
Poor adoption of knowledge assets
-
No ownership accountability
-
Difficulty proving business impact
-
Manual and delayed reporting
A Power BI-based KM dashboard solves these challenges effectively.
Best Practices for the Knowledge Management Dashboard in Power BI
To get maximum value, follow these best practices:
Best Practices
-
Define KPIs clearly and consistently
-
Standardize knowledge categories and owners
-
Update KM data on a fixed schedule
-
Use trend analysis to measure improvement
-
Review dashboards with leadership regularly
-
Focus on value-driven metrics, not vanity metrics
By following these practices, KM initiatives deliver measurable results.
Click to Purchases Knowledge Management Dashboard in Power BI
Who Can Use a Knowledge Management Dashboard in Power BI?
This dashboard is ideal for:
-
Knowledge Management Teams
-
HR and L&D Teams
-
Compliance Teams
-
IT and Operations Teams
-
Business Leaders
-
Digital Transformation Teams
Because Power BI visuals remain intuitive, adoption becomes easy across roles.
Why Choose Power BI for Knowledge Management Dashboards?
Power BI offers:
-
Interactive slicers and visuals
-
Strong data modeling capabilities
-
Drill-down and cross-filtering
-
Easy integration with Excel and databases
-
Scalable enterprise reporting
Therefore, Power BI becomes an excellent choice for KM analytics.
Conclusion
A Knowledge Management Dashboard in Power BI is not just a reporting tool. It is a value measurement system for organizational knowledge. It helps quantify cost savings, time savings, compliance, and user satisfaction. Moreover, it enables leaders to understand how knowledge drives productivity and efficiency.
By using a well-structured 5-page Power BI dashboard, organizations can move from knowledge storage to knowledge intelligence. When implemented correctly, this dashboard becomes a critical enabler of continuous improvement and digital maturity.
Frequently Asked Questions (FAQs)
What is the main purpose of a Knowledge Management Dashboard in Power BI?
The main purpose is to measure knowledge reuse, cost savings, time savings, compliance, and overall KM effectiveness.
Does this dashboard support trend analysis?
Yes, the Monthly Trends page shows performance changes over time.
Can this dashboard be customized?
Yes, organizations can add or modify KPIs, charts, and filters easily.
Is this dashboard suitable for large organizations?
Yes, it works well for both small teams and large enterprises.
Does this dashboard require advanced Power BI skills?
No, basic Power BI knowledge is sufficient to use and maintain it.
How often should KM data be updated?
Ideally, data should be updated monthly or as new knowledge usage data becomes available.
Can leadership use this dashboard for decision-making?
Yes, the dashboard is designed specifically to support executive-level insights.
Click to Purchases Knowledge Management Dashboard in Power BI
Visit our YouTube channel to learn step-by-step video tutorials