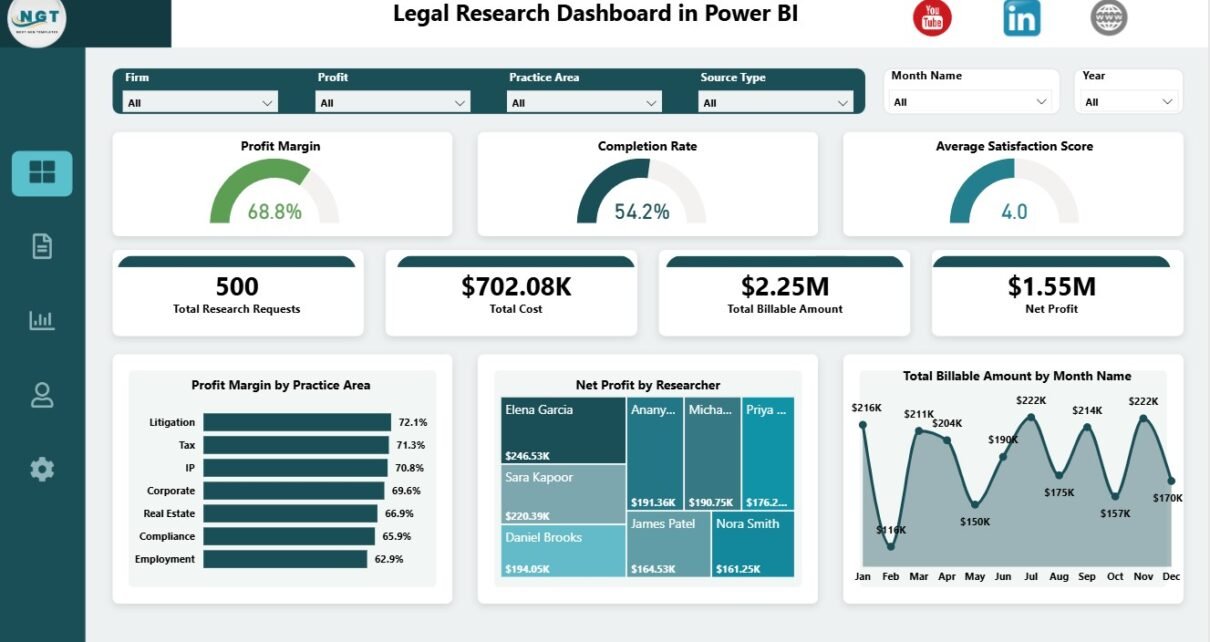
Legal research teams often manage deadlines, billable work, source costs, researcher performance, risk levels, client types, and practice area reporting at the same time. When those records sit in spreadsheets or separate systems, leaders may struggle to see which research requests are profitable, where workload is building, and which practice areas need more attention. The Legal Research Dashboard in Power BI brings those measures into a 5-page interactive PBIX report with 7 KPI cards, 14 analysis visuals, and slicers for fast filtered review.
Click here to purchase the Legal Research Dashboard in Power BI
Legal Research Dashboard in Power BI
Key Features of Legal Research Dashboard in Power BI
- 5 report pages: Overview Page, Workload, Practice, Risk, and Productivity.
- 7 headline KPI cards: Profit Margin, Completion Rate, Average Satisfaction Score, Total Research Requests, Total Cost, Total Billable Amount, and Net Profit.
- Profitability analysis: Review profit margin by practice area, net profit by researcher, and total billable amount by month.
- Workload analysis: Track total research hours by year, total cost by researcher, requests by priority, and profit margin by source type.
- Practice analysis: Compare billable amount by practice area and client type, plus margin by firm.
- Risk analysis: Monitor net profit by priority, requests by risk level, and completed requests by practice area.
- Productivity view: Review total billable amount by researcher in a focused page.
- Editable PBIX file: Use Power BI Desktop to customize visuals, slicers, pages, measures, and data connections.
Dashboard Pages Explanation
1 – Overview Page
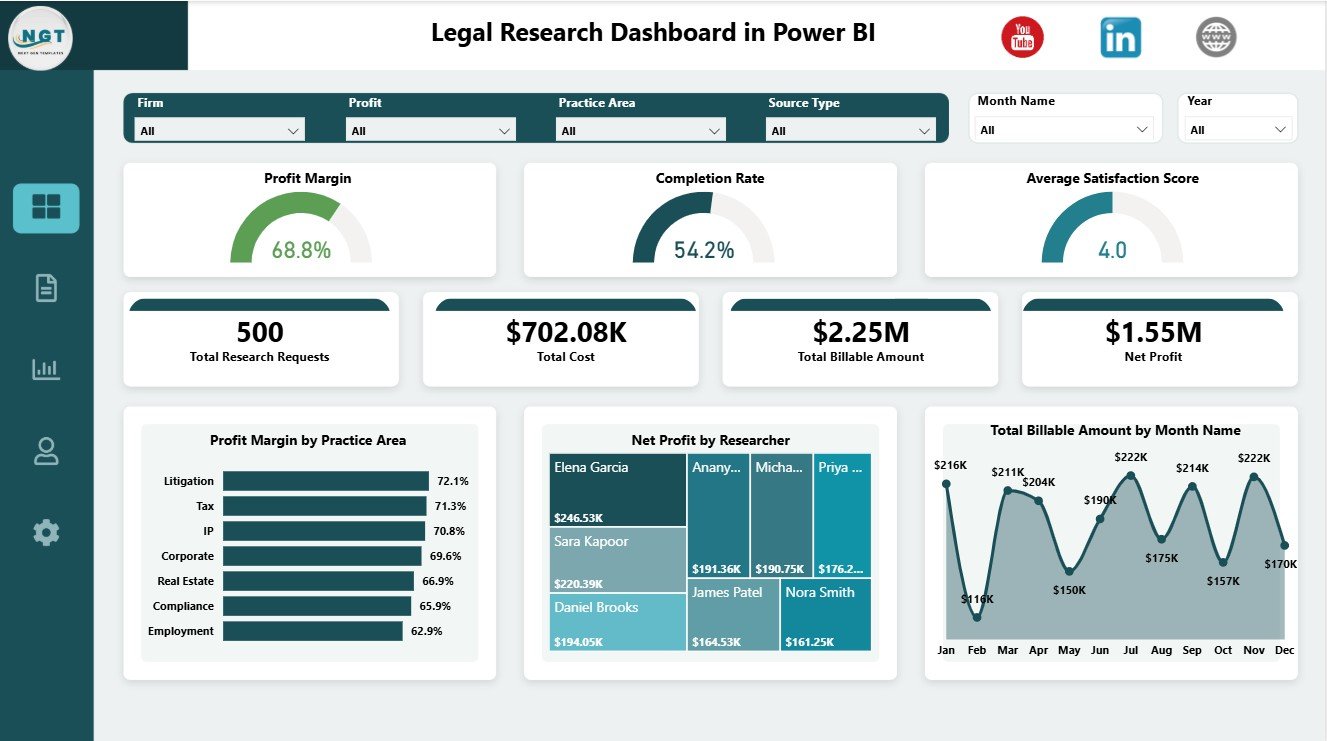
The Overview Page gives a high-level snapshot of legal research performance. At the top, cards display Profit Margin, Completion Rate, Average Satisfaction Score, Total Research Requests, Total Cost, Total Billable Amount, and Net Profit.
Profit Margin by Practice Area: This chart compares profitability across practice areas. It helps partners and legal operations teams see which legal research categories create stronger margin after cost.
Net Profit by Researcher: This visual compares profit contribution by researcher. It helps managers understand productivity, staffing balance, and where coaching or workload redistribution may be useful.
Total Billable Amount by Month Name: This monthly trend shows how billable research value changes across the year. It helps teams identify strong months, slow periods, and seasonal research demand.
Overview Page
2 – Workload
The Workload page focuses on effort, cost, priority, and research source economics. It is useful for research managers who need to review team capacity and understand where high-priority work is concentrated.
Total Research Hours by Year: This chart shows long-term research effort by year. It helps teams understand whether demand is increasing, stable, or declining.
Total Cost by Researcher: This chart compares cost by researcher. It helps managers check resource spend against workload, billable contribution, and expected output.
Total Research Requests by Priority: This visual breaks research requests by priority. It helps leaders understand whether urgent or high-priority research is driving workload pressure.
Profit Margin by Source Type: This chart compares profitability across source categories. It helps teams identify which source types support stronger financial outcomes.
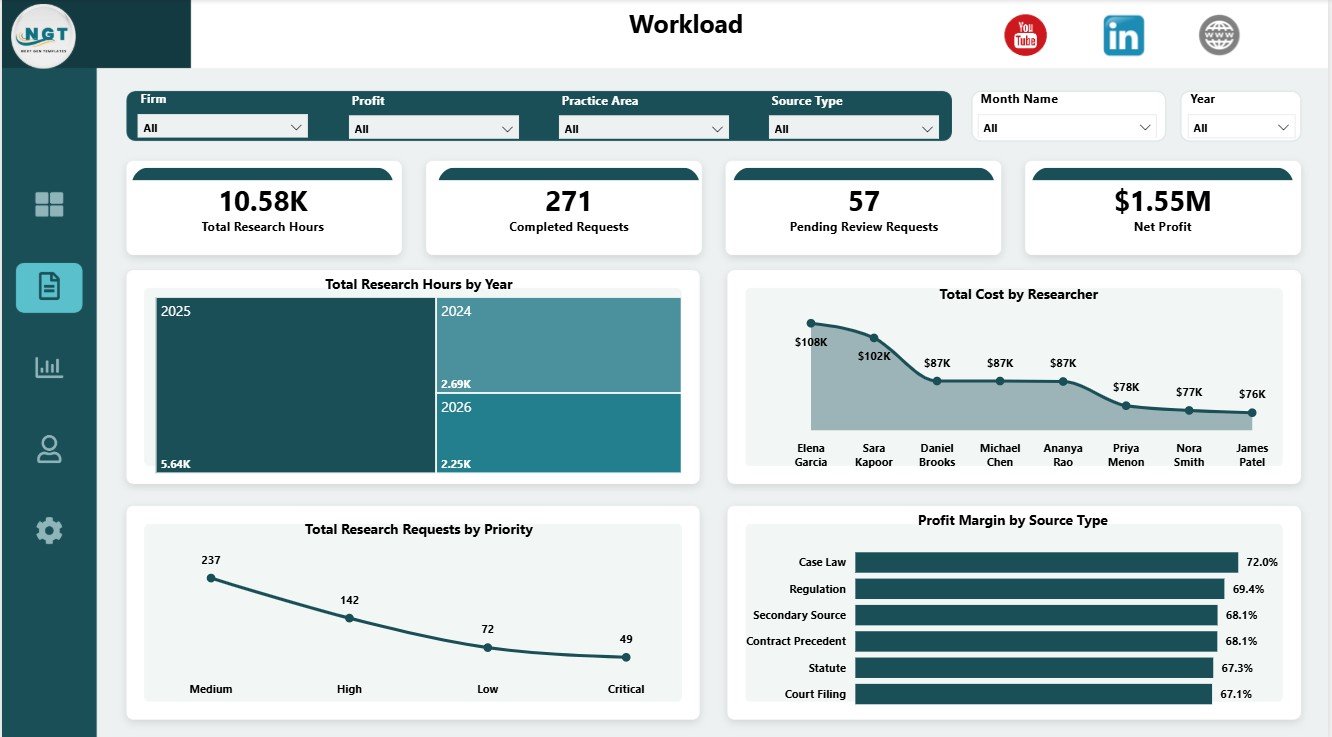
Workload
3 – Practice
The Practice page reviews billable amount and profitability across legal practice dimensions. It gives practice heads a clearer view of which areas, client types, and firms are creating research value.
Total Billable Amount by Practice Area: This chart compares billable research value by practice area. It helps identify which legal domains contribute the largest billing volume.
Total Billable Amount by Client Type: This visual compares billable amount across client types. It helps legal teams understand whether corporate, individual, internal, or other client groups are driving the work.
Profit Margin by Firm: This chart compares margin by firm. It supports firm-level profitability review and helps identify where scope, pricing, or cost control may need attention.
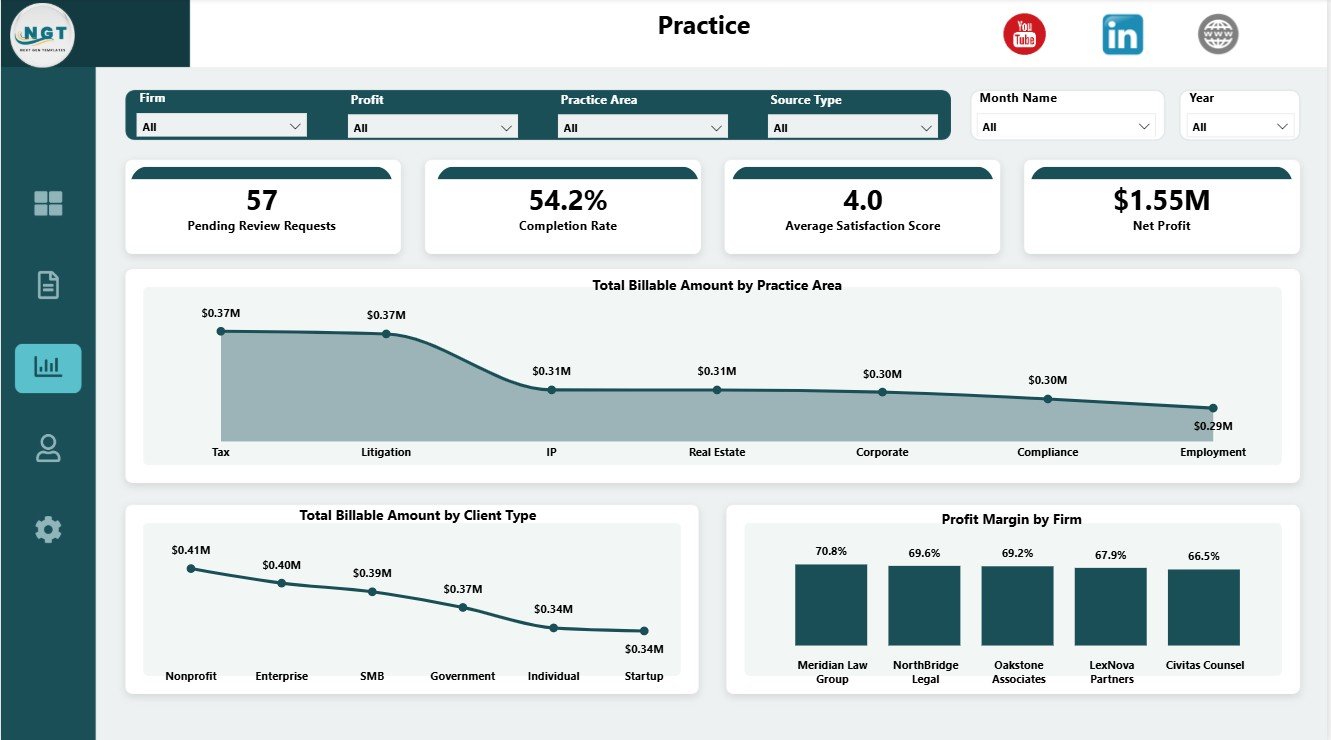
Practice
4 – Risk
The Risk page connects research workload with priority, risk, completion, and practice performance. It is useful when leaders need to review whether high-risk research is being completed efficiently.
Net Profit by Priority: This chart compares net profit by priority level. It helps teams understand whether urgent work is also producing acceptable financial results.
Total Research Requests by Risk Level: This visual shows request volume by risk level. It helps managers see where legal exposure or sensitive research work is concentrated.
Completed Requests by Practice Area: This chart compares completed research work across practice areas. It helps teams identify where completion is strong and where follow-up may be needed.
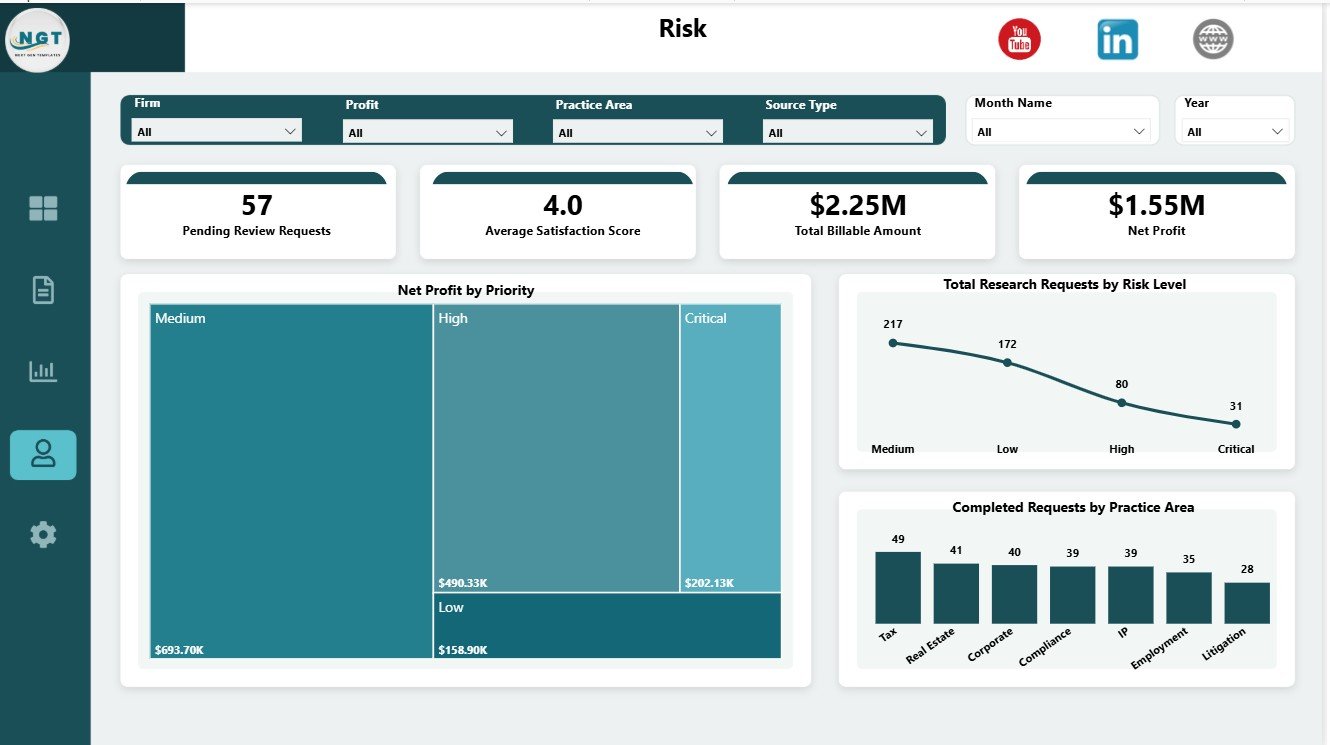
Risk
5 – Productivity
The Productivity page provides a focused view of researcher-level billable contribution. It is helpful for performance review, workload balancing, and identifying the researchers driving the highest billable value.
Total Billable Amount by Researcher: This chart compares billable amount by researcher. It helps managers review contribution and connect researcher output with staffing and training decisions.
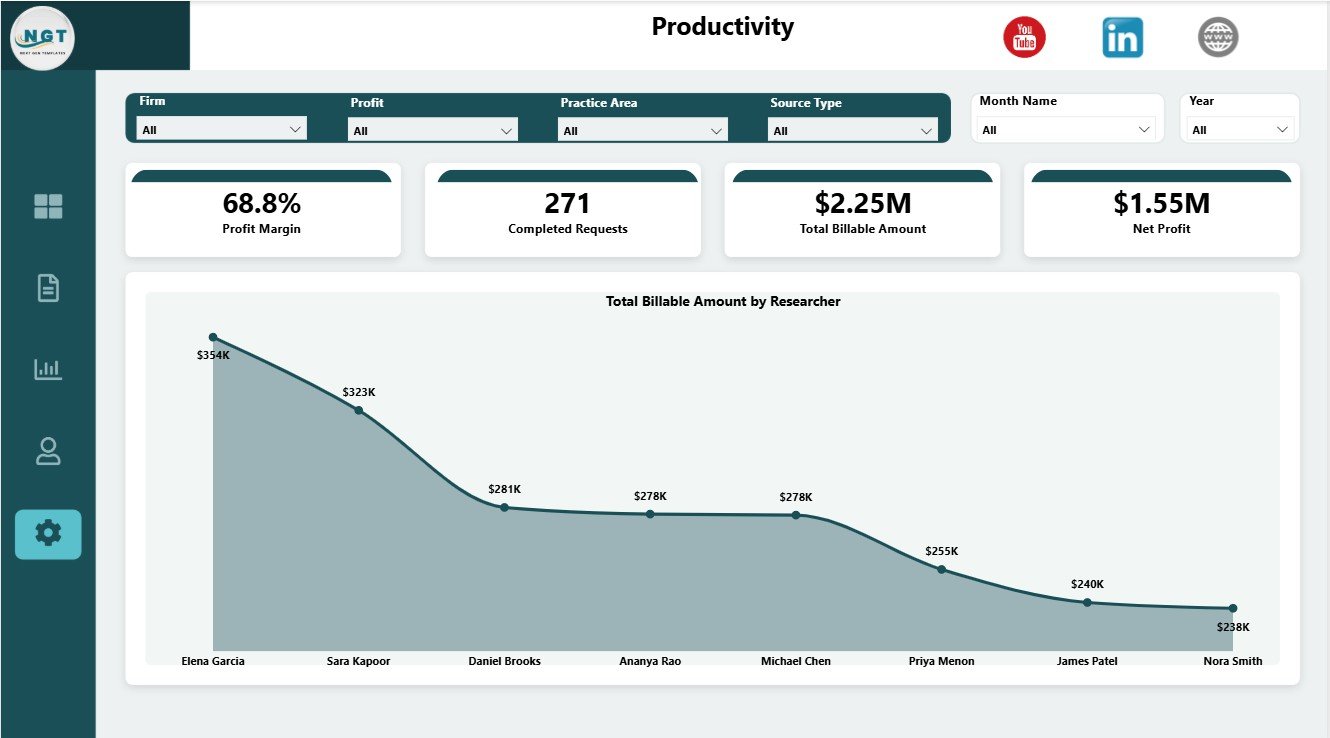
Productivity
Legal Research Dashboard in Power BI vs. Tableau vs. Paid CRM/SaaS – Feature Comparison
| Feature | Legal Research Dashboard in Power BI | Tableau or Qlik Alternative | Paid Legal SaaS |
|---|---|---|---|
| Cost | $17.99 one-time template price | License plus build time | Monthly or annual subscription |
| Platform | Power BI Desktop / Power BI Service | Tableau, Qlik, or another BI platform | Vendor-hosted legal platform |
| Setup time | Open PBIX and replace or connect data | Build or adapt report pages | Implementation and onboarding |
| Real-time team collaboration | Possible through Power BI Service | Possible with cloud plans | Usually included |
| Mobile access | Power BI mobile after publishing | Plan dependent | Usually included |
| Customizable fields | Editable model, visuals, pages, and slicers | Editable with BI skills | Limited by vendor permissions |
| Share with link | Available after publishing to Power BI Service | Available after cloud publishing | Usually login controlled |
| Year-1 cost at 5 users | $17.99 plus any Microsoft licensing | License dependent | Often hundreds or thousands |
| Legal research metrics | Requests, cost, billable amount, profit, margin, risk, workload, practice, and productivity included | Requires build or customization | Depends on vendor module and reporting plan |
For background on Power BI Desktop, Microsoft provides official guidance at Microsoft Learn.
Who Should Use This Template
- Law firms that want a clearer view of research profitability and workload.
- Legal research managers who assign work across multiple researchers.
- Corporate legal departments tracking research requests and completion.
- Compliance teams that need risk-level and practice-area reporting.
- Legal operations analysts preparing monthly leadership summaries.
- Consultants building Power BI reports for legal clients.
Real-World Use Cases
Anika, legal research manager: Anika uses the Workload and Risk pages before weekly planning meetings to review research hours, requests by priority, cost by researcher, and high-risk work.
Marcus, law firm partner: Marcus reviews the Overview and Practice pages before partner meetings to compare billable amount, net profit, margin by practice area, and margin by firm.
Priya, legal operations analyst: Priya filters the report by practice area, source type, and risk level to explain where legal research effort is concentrated and which work streams need process improvement.
Advantages of Legal Research Dashboard in Power BI
- It saves setup time by giving users a ready 5-page Power BI report.
- It connects finance, workload, risk, practice, and productivity in one dashboard.
- It supports fast review through slicers and focused report pages.
- It can be customized in Power BI Desktop for internal datasets or client work.
- It helps legal leaders turn research records into decision-ready visuals.
Opportunities for Improvement
This dashboard is a reporting template, not a complete legal operations platform. Teams with advanced requirements may extend it with live database connections, role-level security, additional DAX measures, Power BI Service scheduled refresh, or separate pages for billing, jurisdiction, authority type, and client-level drilldowns.
Best Practices
- Keep source data fields consistent before refreshing the report.
- Validate total requests, cost, billable amount, net profit, and profit margin after each refresh.
- Use slicers during review meetings to compare practice area, researcher, priority, risk level, and source type.
- Create a short data refresh process if more than one person maintains the dashboard.
- Publish to Power BI Service only after checking access permissions and sensitive legal data rules.
Explore Relevant Templates
You may also like the Legal Research Dashboard in Excel, Legal Research KPI Dashboard in Power BI, Legal Dashboard in Power BI, and Intellectual Property Law Firms Dashboard in Power BI. You can also browse more Power BI dashboard templates.
Frequently Asked Questions
What is included in the Legal Research Dashboard in Power BI?
The template includes 5 Power BI pages: Overview Page, Workload, Practice, Risk, and Productivity, with KPI cards, slicers, and charts for legal research analysis.
Can I replace the sample data with my own data?
Yes. You can replace the sample dataset or connect the PBIX file to your own structured legal research data source.
Do I need Power BI Desktop?
Yes. The file is designed to open in Power BI Desktop, which is available from Microsoft.
Can I customize the dashboard?
Yes. You can edit visuals, measures, slicers, pages, labels, colors, and model connections inside Power BI Desktop.
Is this a legal research database?
No. It is a Power BI reporting dashboard, not a legal research database, AI research tool, billing system, or document repository.
Can I publish it to Power BI Service?
Yes, if your Microsoft account, license, and organizational sharing permissions allow publishing and sharing.
About the Author
Built by PK – Microsoft Certified Professional with 15+ years of Excel, Google Sheets, and Power BI experience. Founder of NextGenTemplates, reaching 300K+ subscribers across YouTube channels. Every template is hand-built and tested before release.
Conclusion
Legal Research Dashboard in Power BI gives legal teams a practical way to review research workload, profitability, practice area contribution, risk, completion, and researcher productivity. Instead of building a report from a blank page, teams can start with a ready PBIX file and adapt it to their own legal research records.
Click here to purchase the Legal Research Dashboard in Power BI
Visit our YouTube channel for step-by-step tutorials: Youtube.com/@PKAnExcelExpert