Managing a shopping mall involves far more than leasing space and collecting rent. Today, mall managers must track operating costs, customer satisfaction, maintenance expenses, event revenue, and store performance—often across multiple locations and categories. However, when data remains scattered across spreadsheets and reports, decision-making becomes slow and unclear.
That is exactly why a Mall Management Dashboard in Power BI becomes a powerful and essential business intelligence tool.
This detailed guide explains what a Mall Management Dashboard in Power BI is, why you need it, how it works, its features, advantages, best practices, and real-world use cases. Moreover, this article includes frequently asked questions with clear answers to help you understand the dashboard completely.
By the end of this article, you will clearly know how a Power BI dashboard transforms mall data into actionable insights and supports smarter operational decisions.
Click to Purchases Mall Management Dashboard in Power BI
What Is a Mall Management Dashboard in Power BI?
A Mall Management Dashboard in Power BI is a centralized, interactive reporting solution designed to monitor and analyze key performance indicators related to mall operations.
Instead of reviewing multiple static reports, mall managers use this dashboard to view customer satisfaction, operating costs, maintenance expenses, rental income, and event revenue in one dynamic interface. Moreover, Power BI allows users to apply slicers, filters, and visuals to explore data quickly.
Because Power BI updates data automatically, the dashboard always reflects the latest operational performance. As a result, mall administrators gain clarity, speed, and accuracy in their decision-making process.
Why Do Mall Managers Need a Power BI Dashboard?
Mall management requires constant monitoring. However, manual reporting consumes time and increases the risk of errors. Therefore, a Power BI dashboard becomes essential.
Here are the key reasons why mall managers need a Mall Management Dashboard in Power BI:
-
First, it consolidates data from multiple sources into one view.
-
Second, it reduces dependency on manual spreadsheets.
-
Third, it improves visibility into costs, revenue, and satisfaction metrics.
-
Moreover, it enables faster and more confident decisions.
-
Finally, it helps identify issues before they escalate.
Because competition in retail continues to increase, malls that rely on real-time insights gain a strong advantage.
How Does a Mall Management Dashboard in Power BI Work?
A Mall Management Dashboard in Power BI works by connecting operational data—usually from Excel files, databases, or ERP systems—to Power BI Desktop.
Once connected, Power BI processes the data and displays it through interactive visuals such as:
-
KPI cards
-
Bar charts
-
Column charts
-
Trend lines
-
Category-based comparisons
Users can apply slicers to filter data by region, store category, mall name, event type, or time period. Consequently, every chart and metric updates instantly.
This approach ensures that managers spend less time preparing reports and more time analyzing performance.
Key Features of Mall Management Dashboard in Power BI
The Mall Management Dashboard in Power BI includes five structured pages, each designed to answer specific business questions. Let us explore each page in detail.
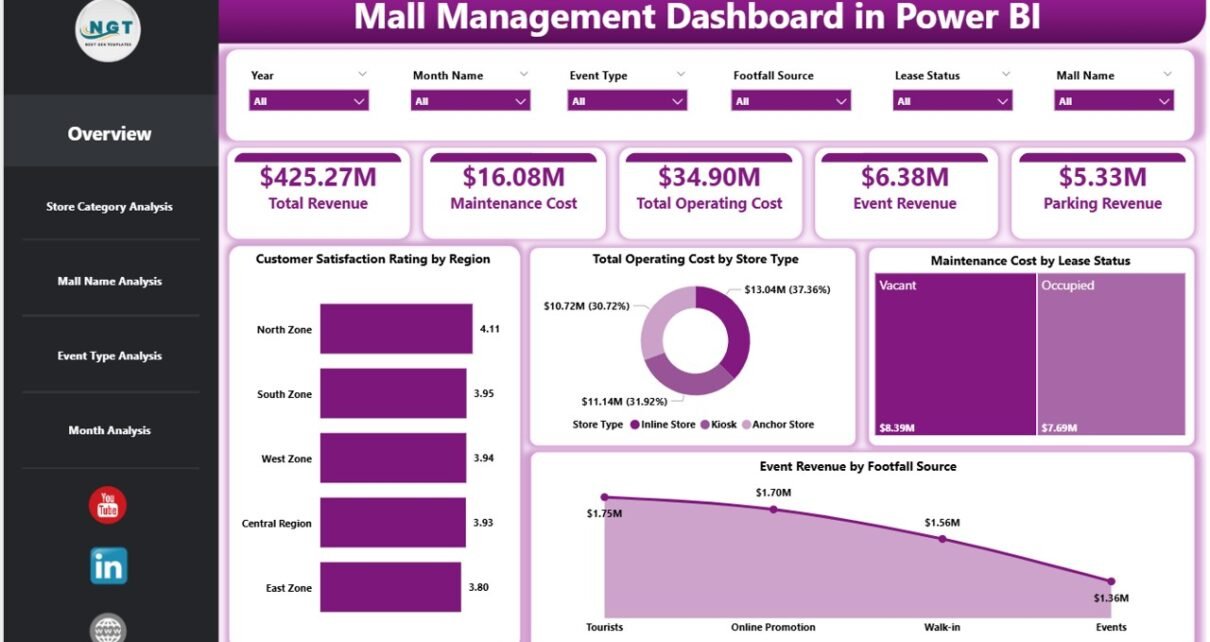
1. What Insights Does the Overview Page Provide?
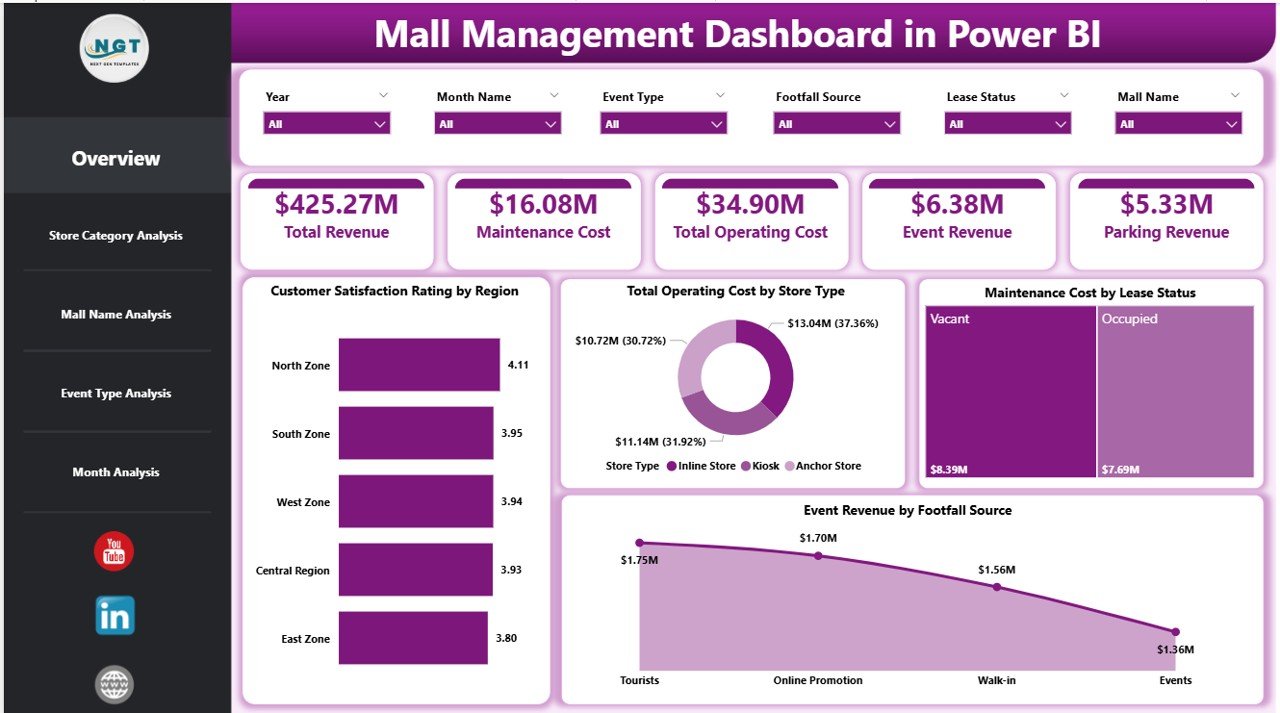
The Overview Page serves as the central snapshot of mall performance.
Main Components of the Overview Page
-
Interactive slicers for filtering data
-
Four KPI cards highlighting key metrics
-
Four analytical charts
Charts Available on the Overview Page
-
Customer Satisfaction Rating by Region
This chart helps identify regions with high or low customer satisfaction. -
Total Operating Cost by Store Type
This visual highlights cost distribution across different store types. -
Maintenance Cost by Lease Status
This chart compares maintenance expenses for leased and non-leased stores. -
Event Revenue by Footfall Source
This insight reveals which footfall sources generate the most event revenue.
Because the overview page summarizes critical metrics, managers can instantly assess overall mall health.
2. How Does Store Category Analysis Improve Decision-Making?
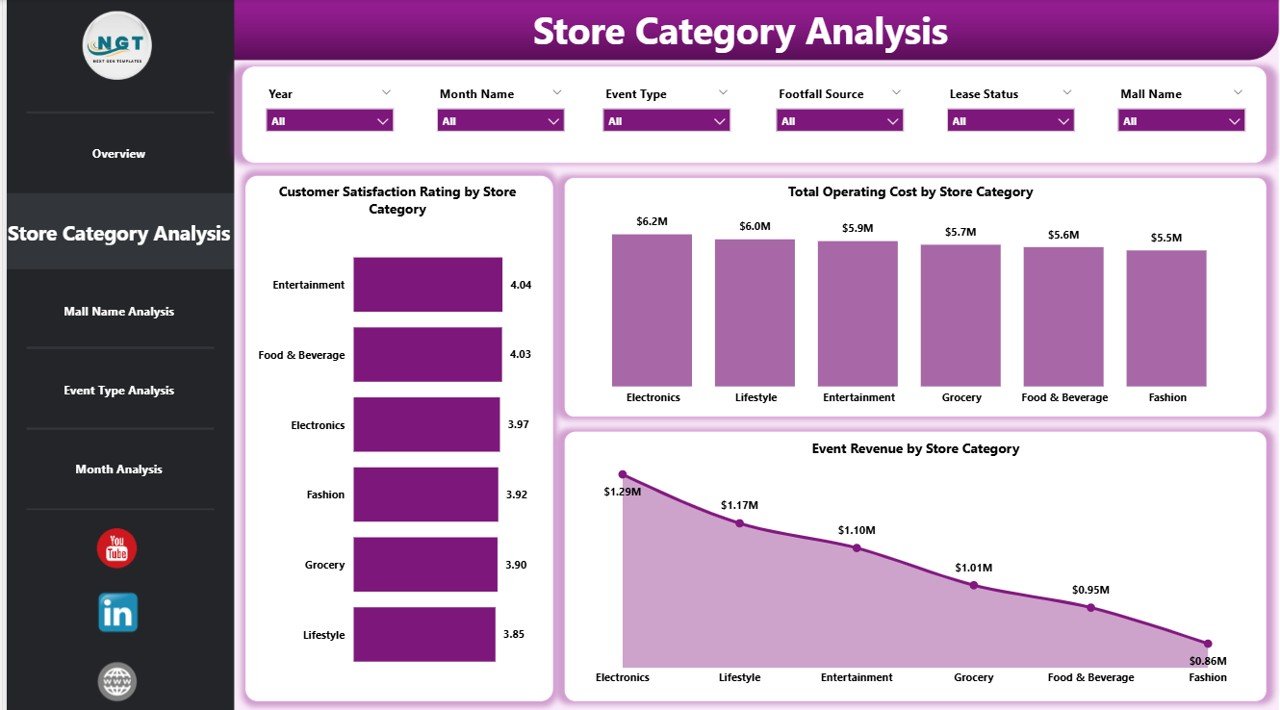
The Store Category Analysis Page focuses on performance by store category.
Why Store Category Analysis Matters
Different store categories generate different levels of revenue, cost, and customer satisfaction. Therefore, analyzing them separately provides clarity.
Charts on the Store Category Analysis Page
-
Customer Satisfaction Rating by Store Category
This chart shows which store categories attract happier customers. -
Total Operating Cost by Store Category
This view helps control category-wise expenses. -
Event Revenue by Store Category
This chart identifies which categories contribute most to event income.
Because of this analysis, mall managers can optimize category mix and improve tenant strategy.
Click to Purchases Mall Management Dashboard in Power BI
3. What Can Mall Name Analysis Reveal?
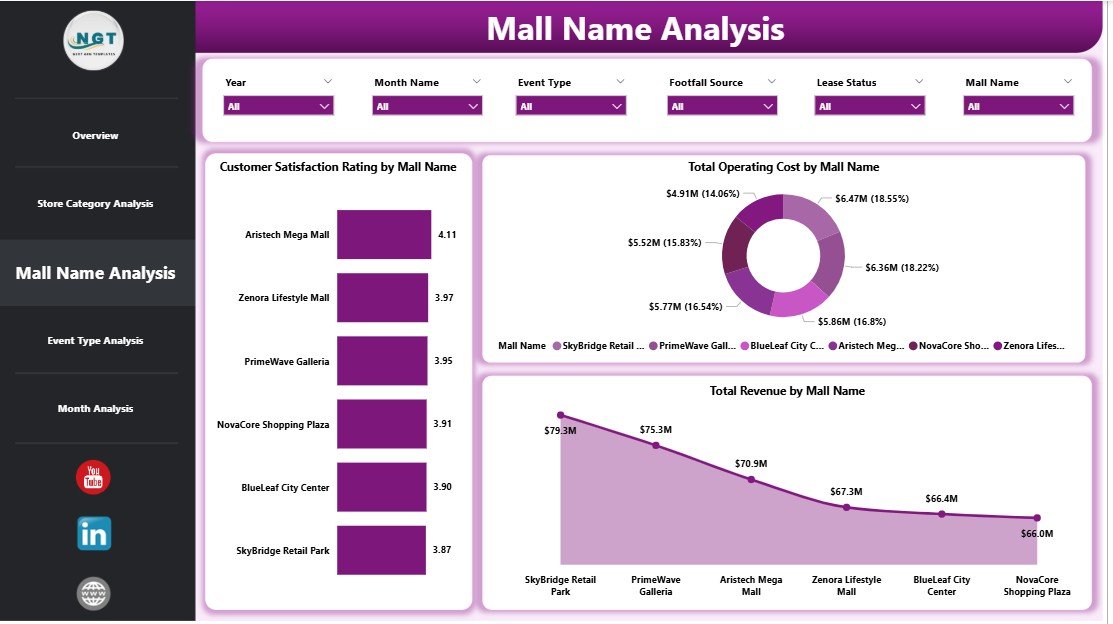
The Mall Name Analysis Page compares performance across multiple malls.
Importance of Mall-Level Analysis
When organizations manage more than one mall, comparing performance becomes critical. Therefore, this page enables benchmarking.
Charts on the Mall Name Analysis Page
-
Customer Satisfaction Rating by Mall Name
This visual highlights customer experience differences across malls. -
Total Operating Cost by Mall Name
This chart identifies cost-efficient and high-cost malls. -
Total Revenue by Mall Name
This view helps track overall financial performance.
As a result, management can replicate best practices from top-performing malls.
4. How Does Event Type Analysis Support Revenue Growth?
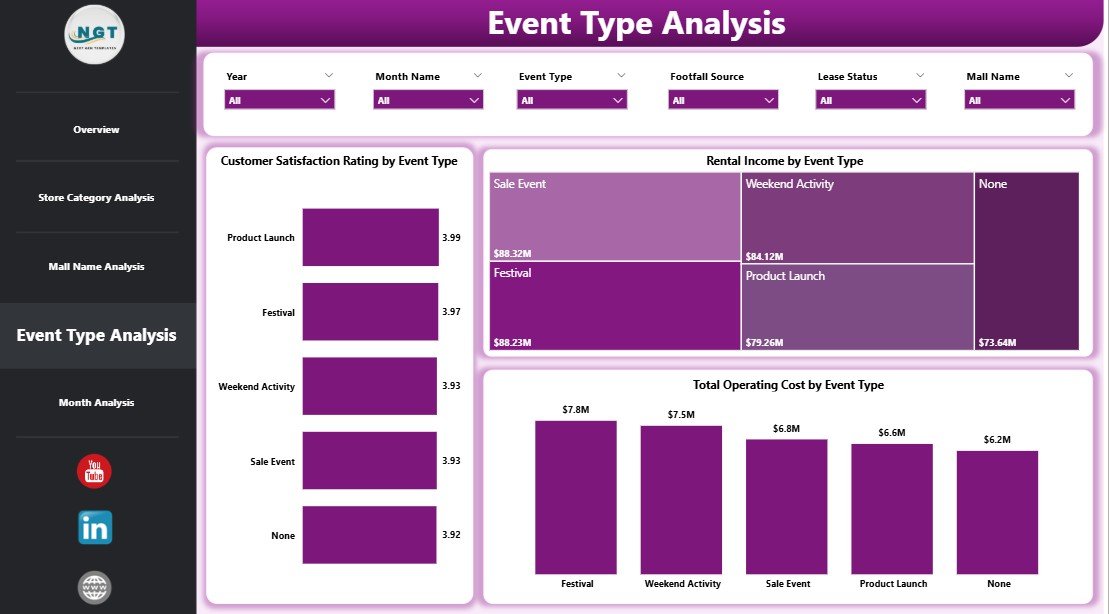
Events play a major role in attracting footfall and generating revenue. Therefore, Event Type Analysis becomes essential.
Charts on the Event Type Analysis Page
-
Customer Satisfaction Rating by Event Type
This chart shows which events delight customers the most. -
Total Operating Cost by Event Type
This insight helps control event-related expenses. -
Rental Income by Event Type
This visual highlights profitable event categories.
Because event planning involves cost and coordination, these insights help maximize returns.
5. Why Are Monthly Trends Critical for Mall Management?
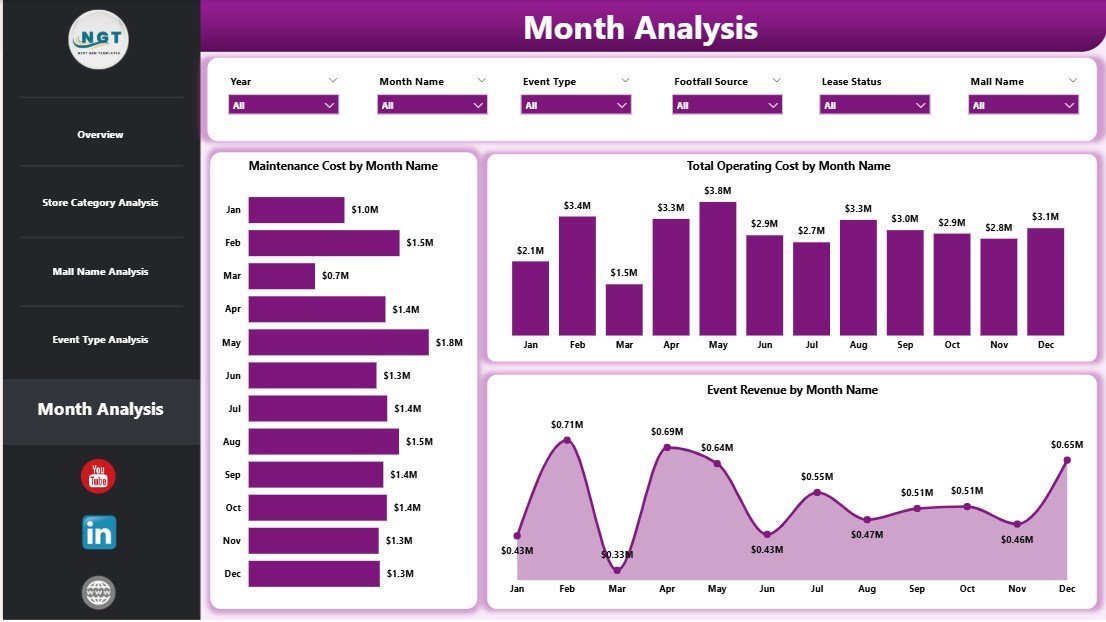
The Monthly Trends Page focuses on time-based analysis.
Why Trend Analysis Matters
Trends reveal patterns that static reports cannot show. Therefore, this page helps anticipate future challenges.
Charts on the Monthly Trends Page
-
Maintenance Cost by Month
This chart tracks maintenance spending trends. -
Total Operating Cost by Month
This visual identifies seasonal cost variations. -
Event Revenue by Month
This chart shows revenue fluctuations throughout the year.
As a result, managers can plan budgets and events more effectively.
Advantages of Mall Management Dashboard in Power BI
A Mall Management Dashboard in Power BI delivers several strategic benefits.
Key Advantages
-
✅ Centralized performance tracking
-
✅ Real-time data updates
-
✅ Interactive filtering and slicing
-
✅ Improved cost control
-
✅ Better event planning
-
✅ Enhanced customer satisfaction insights
-
✅ Reduced reporting time
Because of these advantages, mall operators gain clarity, control, and confidence.
Who Can Benefit from a Mall Management Dashboard in Power BI?
This dashboard serves multiple stakeholders.
Primary Users
-
Mall Managers
-
Operations Teams
-
Finance Teams
-
Leasing Managers
-
Event Coordinators
-
Senior Management
Each role benefits from customized insights while using the same data model.
How to Use the Mall Management Dashboard Effectively?
Click to Purchases Mall Management Dashboard in Power BI
To gain maximum value, users should follow a structured approach.
Recommended Steps
-
Review the Overview Page daily
-
Analyze store categories weekly
-
Compare malls monthly
-
Evaluate event performance after each event
-
Monitor trends for budgeting and forecasting
This routine ensures consistent performance monitoring.
Best Practices for the Mall Management Dashboard in Power BI
Following best practices ensures accuracy and long-term success.
Data Best Practices
-
Use clean and structured source data
-
Standardize naming conventions
-
Validate data before refresh
Dashboard Design Best Practices
-
Keep visuals simple and clear
-
Avoid overcrowding charts
-
Use consistent color themes
Usage Best Practices
-
Train users on slicers and filters
-
Review KPIs regularly
-
Update targets periodically
Because Power BI dashboards evolve, continuous improvement matters.
How Does This Dashboard Support Strategic Decision-Making?
A Mall Management Dashboard in Power BI supports strategic planning by:
-
Identifying cost-saving opportunities
-
Improving tenant mix decisions
-
Enhancing event ROI
-
Boosting customer satisfaction
-
Supporting expansion strategies
Therefore, the dashboard acts as both an operational and strategic tool.
Conclusion: Why Mall Management Dashboard in Power BI Is a Must-Have Tool
Mall management requires precision, visibility, and agility. However, manual reporting limits performance and slows decisions. A Mall Management Dashboard in Power BI solves this challenge by transforming raw data into meaningful insights.
Because it combines cost analysis, revenue tracking, customer satisfaction, and trends in one platform, it empowers mall managers to act quickly and confidently.
In today’s competitive retail environment, malls that embrace Power BI dashboards gain a significant operational advantage.
Frequently Asked Questions About Mall Management Dashboard in Power BI
What data sources can connect to a Mall Management Dashboard in Power BI?
You can connect Excel files, SQL databases, ERP systems, and cloud data sources easily.
Can non-technical users use this dashboard?
Yes, Power BI dashboards use intuitive visuals and slicers, making them easy to use.
How often does the dashboard update?
The dashboard updates based on data refresh settings, which can run daily or in real time.
Can the dashboard handle multiple malls?
Yes, the dashboard supports multi-mall analysis through slicers and filters.
Is Power BI suitable for large malls?
Yes, Power BI handles large datasets efficiently and scales well.
Can KPIs be customized?
Yes, you can modify KPIs, charts, and measures as business needs change.
Does this dashboard improve cost control?
Yes, it highlights operating and maintenance costs clearly, enabling better control.
Visit our YouTube channel to learn step-by-step video tutorials