In today’s fast-paced and stressful world, mental health awareness has become a vital part of overall well-being. Healthcare organizations, therapy centers, and counseling institutions now recognize the importance of measuring and improving their mental health services through data. However, without proper tools, tracking performance, client satisfaction, and profitability can quickly become overwhelming.
That’s where the Mental Health Services Dashboard in Excel comes in — a ready-to-use, interactive Excel template that helps you monitor and analyze your performance metrics effectively. Whether you’re running a therapy center, wellness clinic, or counseling program, this dashboard brings all your key data together in one place, transforming raw numbers into meaningful insights.
Click to Purchases Mental Health Services Dashboard in Excel
What Is a Mental Health Services Dashboard in Excel?
A Mental Health Services Dashboard in Excel is a structured analytical tool designed to consolidate and visualize mental health service data. It helps administrators, therapists, and healthcare professionals evaluate their operations by tracking performance indicators such as:
-
Patient satisfaction levels
-
Session fees and discounts
-
Insurance coverage
-
Profitability by region, therapy area, and specialty
This dashboard eliminates guesswork and enables data-driven decision-making — helping organizations ensure quality care while maintaining operational efficiency.
📊 Why Mental Health Analytics Matter
Mental health services often involve subjective outcomes, but data analysis adds a layer of objectivity. With analytics, mental health providers can:
-
Identify high-performing branches or therapy types
-
Detect service areas needing improvement
-
Evaluate profit and cost structures
-
Track patient satisfaction trends
-
Align performance with goals and regulatory standards
Excel offers the ideal platform for this — accessible, flexible, and easily customizable. This dashboard turns Excel into a powerful analytical tool for healthcare professionals who want control and visibility without investing in expensive software.
Key Features of the Mental Health Services Dashboard in Excel
This Excel file comes with five analytical pages, along with supportive data sheets for detailed analysis and record keeping. Each page offers a unique view into different operational dimensions.
1. Overview Page
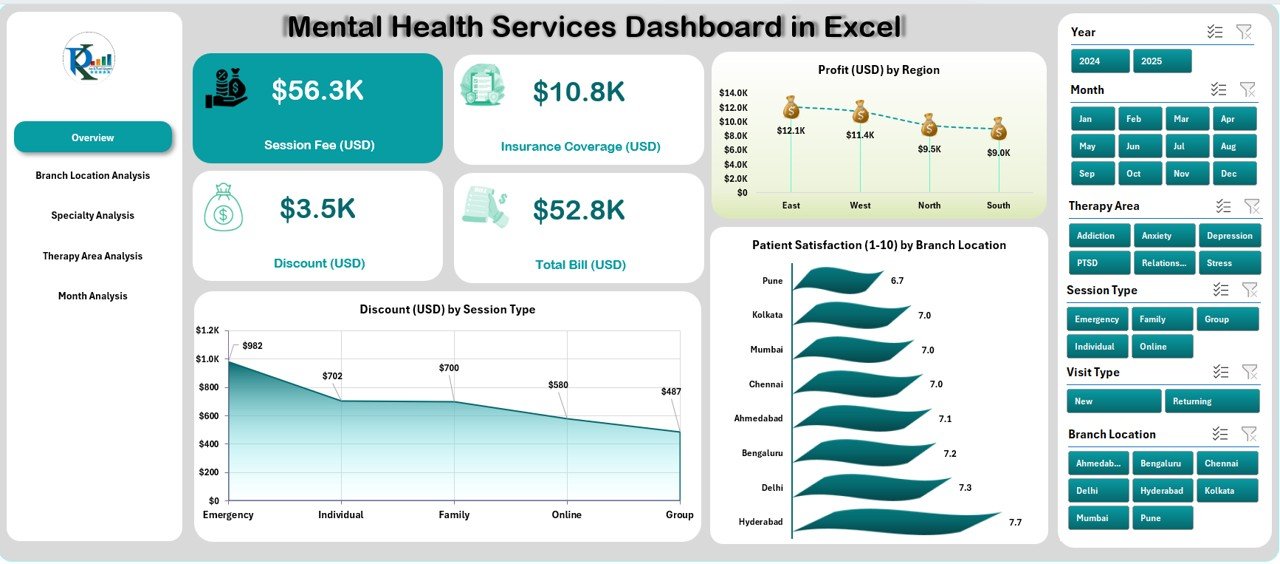
The Overview Page serves as the central hub of the dashboard.
Located alongside a clean page navigator on the left, this sheet provides a quick snapshot of your organization’s key metrics.
What you’ll find here:
-
Four data cards displaying summary figures
Three charts for deeper insights:
- Profit (USD) by Region – Understand which branches generate the most profit.
- Discount (USD) by Session Type – Monitor your discount distribution for various services.
- Patient Satisfaction (1-10) by Branch Location – Measure the quality of patient experiences across locations.
With dropdown filters, users can easily select time periods or regions to visualize performance instantly.
2. Branch Location Analysis
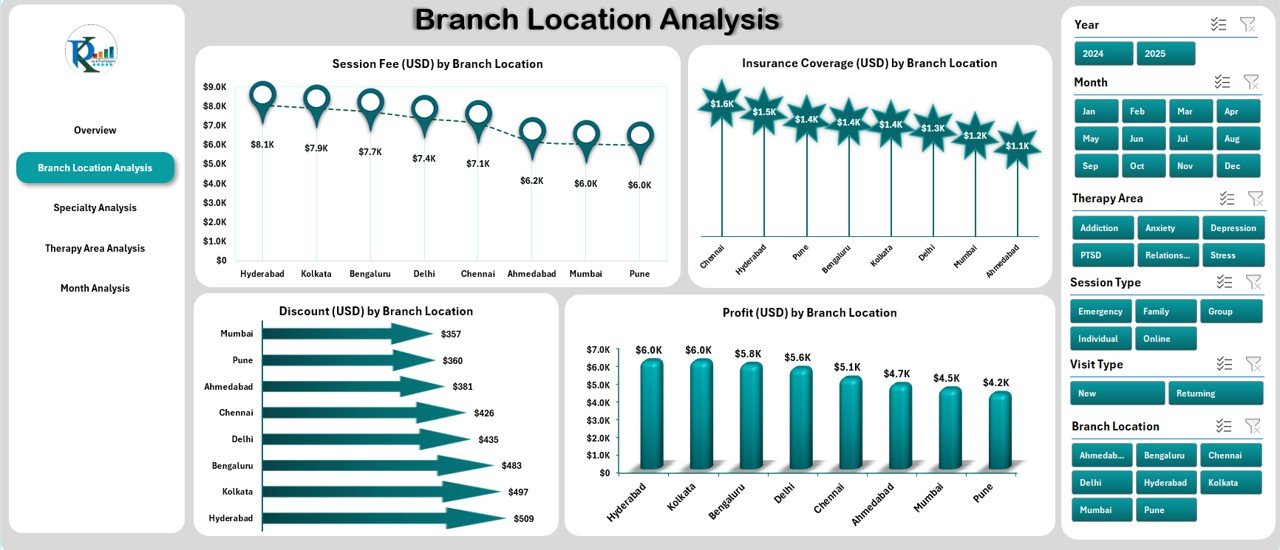
The Branch Location Analysis Page lets you compare performance across multiple centers.
It offers dynamic insights into the operational and financial health of each location.
Charts Displayed:
-
Session Fee (USD) by Branch Location
-
Insurance Coverage (USD) by Branch Location
-
Discount (USD) by Branch Location
-
Profit (USD) by Branch Location
Click to Purchases Mental Health Services Dashboard in Excel
With these visuals, management teams can identify which locations are thriving, which need attention, and where resources should be reallocated.
3. Specialty Analysis
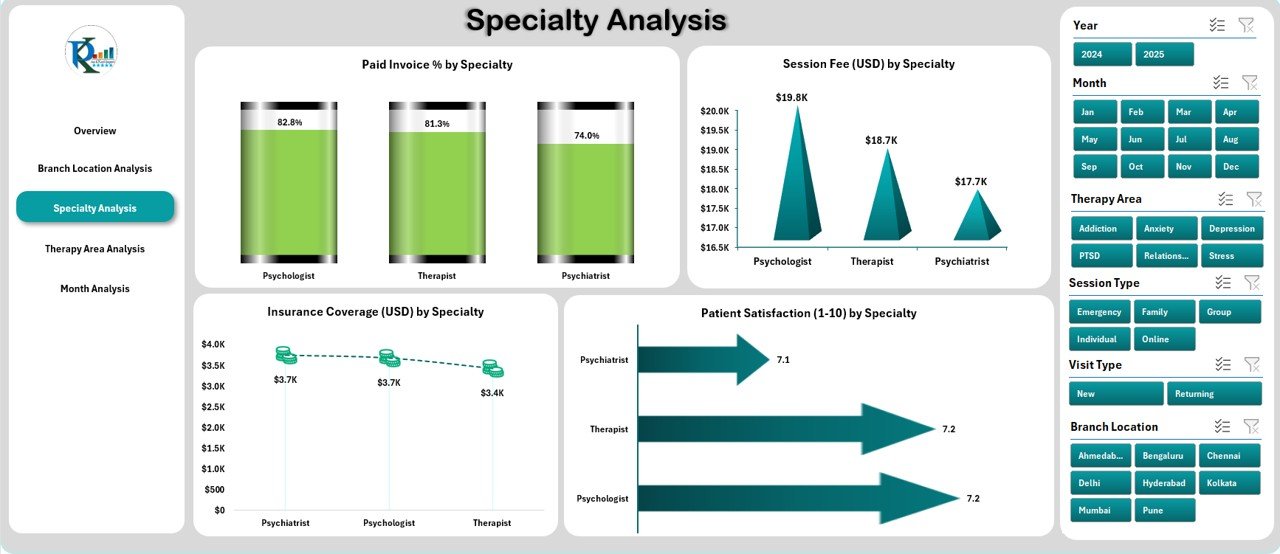
Different specialties — from counseling to psychiatric services — often have varying costs and satisfaction levels. The Specialty Analysis Page helps you compare them effectively.
Charts Displayed:
-
Paid Invoice % by Specialty
-
Session Fee (USD) by Specialty
-
Insurance Coverage (USD) by Specialty
-
Patient Satisfaction (1-10) by Specialty
This page ensures that you can evaluate the performance of different therapy disciplines, identify high-value services, and enhance patient satisfaction through targeted improvements.
4. Therapy Area Analysis
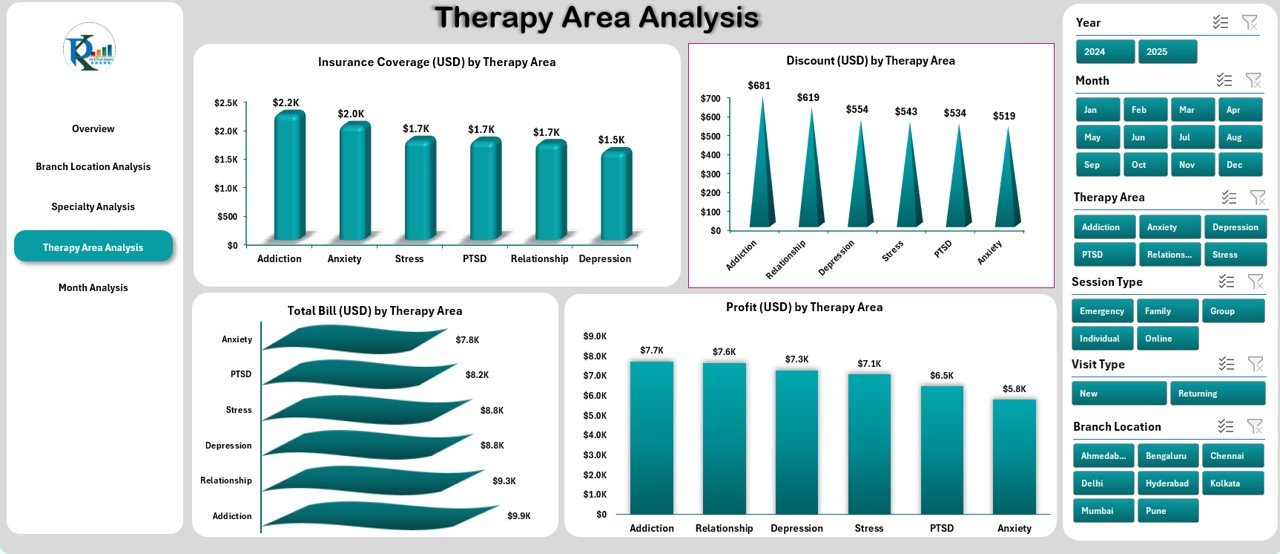
Each therapy area contributes differently to profitability and patient engagement. The Therapy Area Analysis Page provides a detailed breakdown.
Charts Displayed:
-
Insurance Coverage (USD) by Therapy Area
-
Discount (USD) by Therapy Area
-
Total Bill (USD) by Therapy Area
-
Profit (USD) by Therapy Area
These insights empower administrators to see which therapy categories are generating the best returns while maintaining service quality.
5. Month Analysis
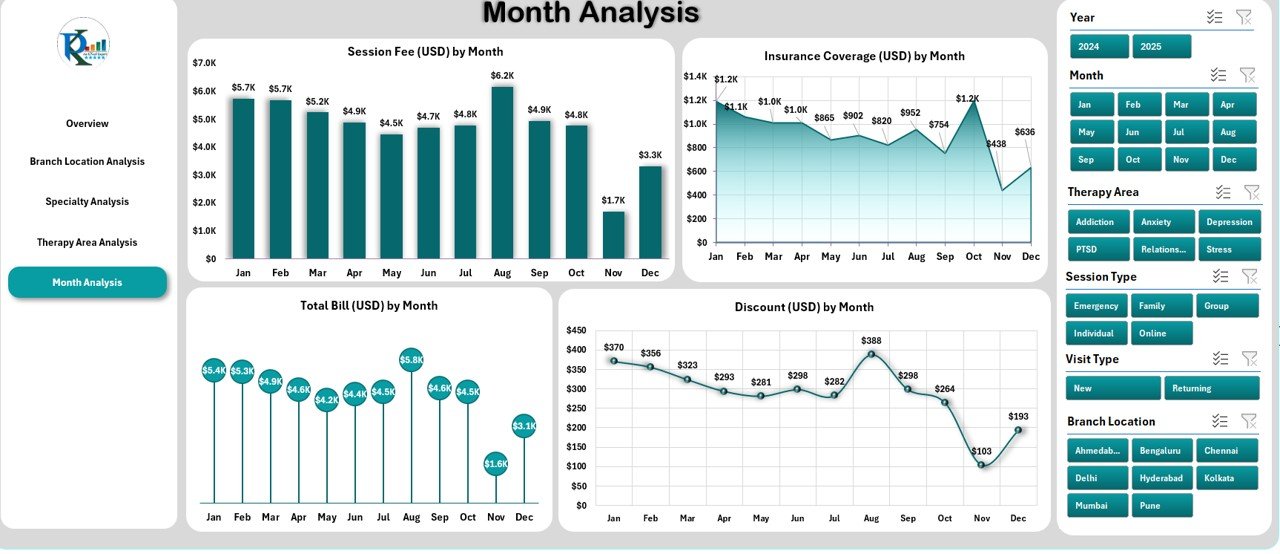
The Month Analysis Page visualizes your data over time. It’s perfect for spotting seasonal trends or performance fluctuations throughout the year.
Charts Displayed:
-
Session Fee (USD) by Month
-
Insurance Coverage (USD) by Month
-
Total Bill (USD) by Month
-
Discount (USD) by Month
This helps clinics understand monthly revenue variations, patient patterns, and the impact of promotions or awareness campaigns.
Supporting Sheets: Data and Backend
Behind every visual is well-structured data.
The Data Sheet stores all raw inputs — including patient records, financial details, and satisfaction ratings — while formulas and lookups power the dashboard visuals.
This design ensures that updates are as simple as pasting new data each month.
🌟 Advantages of Using the Mental Health Services Dashboard in Excel
Let’s explore the top benefits that make this dashboard a game-changer for mental health organizations.
✅ 1. Centralized Data Visualization
Instead of manually compiling reports from multiple files, you can view everything in one dashboard — giving you complete visibility across departments.
✅ 2. Real-Time Performance Tracking
Dynamic charts and dropdown filters allow instant updates as soon as new data is entered.
✅ 3. Improved Decision-Making
The dashboard translates raw data into insights, enabling you to make quick, informed decisions about operations and patient care.
✅ 4. Enhanced Patient Experience
By monitoring satisfaction scores and service outcomes, you can identify what patients appreciate most — and what needs improvement.
✅ 5. Time and Cost Efficiency
Built in Excel, this tool saves you the cost of expensive BI software. It also minimizes reporting time with automation and pre-built analytics.
✅ 6. Easy Customization
Add or remove KPIs, adjust visuals, or modify filters to suit your unique workflow — no coding required.
✅ 7. Professional Presentation
Attractive charts, cards, and slicers create a boardroom-ready report, ideal for presentations and reviews.
📈 Key Metrics Tracked in the Dashboard
Click to Purchases Mental Health Services Dashboard in Excel
Here are some of the most important KPIs included in the Mental Health Services Dashboard:
-
Patient Satisfaction Score (1-10) – Measures patient happiness across therapy sessions.
-
Session Fee (USD) – Tracks the cost of each session type.
-
Insurance Coverage (USD) – Evaluates how much of the total bill is covered by insurance.
-
Discount (USD) – Shows the total discount offered to patients.
-
Profit (USD) – Indicates the net gain per region, specialty, or therapy area.
-
Paid Invoice % – Measures billing and collection efficiency.
-
Total Bill (USD) – Represents overall billing volume per category or period.
These KPIs ensure every operational, financial, and service aspect is monitored continuously.
How the Dashboard Helps Mental Health Organizations
This Excel-based solution goes beyond just visualizing data. It empowers mental health organizations to:
-
Identify gaps between planned and actual performance
-
Track profitability per service or location
-
Detect low satisfaction trends before they escalate
-
Benchmark performance across months, regions, or therapists
-
Strengthen accountability with clear, measurable KPIs
The result is a more efficient, transparent, and patient-focused organization.
🧮 Why Choose Excel for Mental Health Data Analysis?
While there are many data tools available, Excel remains one of the most trusted platforms for healthcare analytics. Here’s why:
-
Accessibility – Most professionals already use Excel.
-
Customization – Easy to modify formulas, charts, and filters.
-
Offline Availability – No internet connection needed.
-
Integration – Works seamlessly with hospital or billing exports (CSV, XML, etc.).
-
Automation – Supports dynamic charts, pivot tables, and slicers.
In short, this dashboard makes the most of Excel’s flexibility while simplifying the complex world of mental health analytics.
How to Use the Mental Health Services Dashboard in Excel
Getting started is incredibly easy. Follow these steps:
-
Open the Excel File — The dashboard opens with the Overview page.
-
Navigate Using the Sidebar — Use the Page Navigator to switch between analysis pages.
-
Import Your Data — Paste your monthly or weekly data into the Data Sheet.
-
Use Filters and Dropdowns — Select the desired period or category to refresh visuals.
-
Review Insights — Analyze key trends in satisfaction, profit, and insurance coverage.
With these steps, even non-technical users can produce detailed reports in minutes.
Opportunities for Improvement in Mental Health Data Management
While this dashboard offers comprehensive analytics, every organization can still enhance its approach to data-driven healthcare. Here are some areas to focus on:
-
Automate Data Entry: Use macros or scripts to pull data directly from billing systems.
-
Track Therapist Performance: Add KPIs like patient retention or average session rating.
-
Add Forecasting Tools: Predict future patient loads or financial outcomes.
-
Integrate with Power BI: For organizations needing advanced visuals and online dashboards.
-
Enhance Security: Use password protection for patient-related sheets.
Implementing these upgrades ensures your mental health analytics system stays modern, secure, and actionable.
Best Practices for the Mental Health Services Dashboard in Excel
To make the most out of your dashboard, follow these proven best practices:
🔹 1. Maintain Clean and Consistent Data
Ensure every data entry follows a uniform format. Consistency prevents formula errors and ensures accurate charts.
🔹 2. Regularly Update the Data Sheet
Refresh your dashboard weekly or monthly to keep insights relevant and actionable.
🔹 3. Use Conditional Formatting
Highlight high-risk areas such as low satisfaction or reduced profit to focus attention quickly.
🔹 4. Protect Sensitive Information
Since mental health data is confidential, always use Excel’s password protection features.
🔹 5. Create Backup Copies
Maintain historical versions to track progress over time and prevent data loss.
🔹 6. Review KPIs Regularly
Modify or add KPIs based on changing goals or new therapy types.
By following these practices, your dashboard will remain accurate, reliable, and secure.
Real-World Applications of This Dashboard
Here are a few examples of how different professionals use the Mental Health Services Dashboard in Excel:
-
Clinic Managers: To monitor profitability and insurance coverage trends.
-
Therapists: To understand satisfaction levels across therapy types.
-
Healthcare Administrators: To align staff performance with patient outcomes.
-
Financial Officers: To analyze session fees, discounts, and invoices.
-
Policy Makers: To identify community-level service gaps through location analysis.
This versatility makes the dashboard suitable for private practices, multi-branch clinics, and hospital departments alike.
🧾 Conclusion
The Mental Health Services Dashboard in Excel is not just a reporting tool — it’s a complete analytics solution for therapy centers and wellness organizations. By combining data visualization, performance tracking, and decision support, it helps transform healthcare operations into transparent, measurable, and patient-focused systems.
With its interactive charts, user-friendly layout, and real-time performance metrics, this dashboard ensures that mental health professionals spend less time managing data and more time delivering quality care.
❓ Frequently Asked Questions (FAQs)
1. What is the purpose of the Mental Health Services Dashboard in Excel?
The purpose of this dashboard is to help organizations monitor key metrics like patient satisfaction, profit, and insurance coverage in a single interactive Excel file.
2. Who can use this dashboard?
It’s ideal for mental health clinics, therapy centers, hospitals, and counseling services that want to improve performance tracking and data visibility.
3. Is this dashboard suitable for non-technical users?
Yes! The interface is intuitive — users only need to update the data sheet, and the visuals refresh automatically.
4. Can I customize the KPIs or charts?
Absolutely. You can add new KPIs, change formulas, or adjust visuals to match your organization’s requirements.
5. How secure is patient data in Excel?
Excel allows password protection and restricted access features to ensure confidentiality of sensitive information.
6. Can the dashboard integrate with other tools?
Click to Purchases Mental Health Services Dashboard in Excel
Visit our YouTube channel to learn step-by-step video tutorials
Watch the step-by-step video tutorial: