The metaverse is no longer a futuristic idea. Instead, it has already become a rapidly growing digital ecosystem where businesses, developers, and creators build immersive virtual experiences. However, as metaverse projects expand, managing development performance becomes increasingly complex. Teams must track productivity, costs, timelines, quality metrics, and innovation progress—all at the same time.
That is exactly why a Metaverse Development KPI Dashboard in Excel becomes an essential performance management tool.
This ready-to-use dashboard provides a structured, visual, and data-driven approach to monitor key performance indicators (KPIs) related to metaverse development. Rather than relying on scattered spreadsheets or manual status updates, teams gain a centralized view of actuals, targets, trends, and comparisons.
In this detailed article, you will learn what a Metaverse Development KPI Dashboard in Excel is, how it works, its worksheet structure, advantages, best practices, and frequently asked questions. By the end, you will clearly understand how this dashboard helps development teams make smarter and faster decisions.
Click to Purchases Metaverse Development KPI Dashboard in Excel
What Is a Metaverse Development KPI Dashboard in Excel?
A Metaverse Development KPI Dashboard in Excel is a ready-to-use analytical dashboard designed to track and evaluate performance metrics related to metaverse projects.
Instead of manually analyzing numbers across multiple files, this dashboard consolidates KPI data into a single Excel workbook. As a result, project managers, technical leads, and business stakeholders can instantly assess development performance.
Moreover, because the dashboard is built in Excel, it remains accessible, flexible, and easy to customize—without requiring advanced tools or programming knowledge.
Why Do Metaverse Development Teams Need a KPI Dashboard?
Metaverse development involves multiple moving parts. Teams work on 3D assets, virtual environments, blockchain integration, user experience, performance optimization, and testing. Because of this complexity, performance tracking becomes challenging.
Without a structured dashboard, teams often face:
-
Poor visibility into KPI performance
-
Delayed issue detection
-
Manual and error-prone reporting
-
Lack of historical comparison
-
Difficulty aligning targets with outcomes
Therefore, a KPI dashboard becomes critical.
With a Metaverse Development KPI Dashboard in Excel, teams gain clarity, control, and consistency across all development metrics.
How Does the Metaverse Development KPI Dashboard in Excel Work?
The dashboard works by separating data input and analysis. Users enter actual, target, and previous year values in dedicated sheets. Then, the dashboard automatically calculates performance indicators, trends, and comparisons.
Additionally, the dashboard uses dropdowns, conditional formatting, and charts to simplify interpretation. Because of this design, users can analyze KPIs without writing complex formulas every time.
Most importantly, the dashboard supports both MTD (Month-to-Date) and YTD (Year-to-Date) analysis, which helps teams monitor short-term and long-term performance.
Click to Purchases Metaverse Development KPI Dashboard in Excel
What Worksheets Are Included in the Metaverse Development KPI Dashboard?
This dashboard contains seven structured worksheets, each designed for a specific purpose.
What Is the Home Sheet Used For?
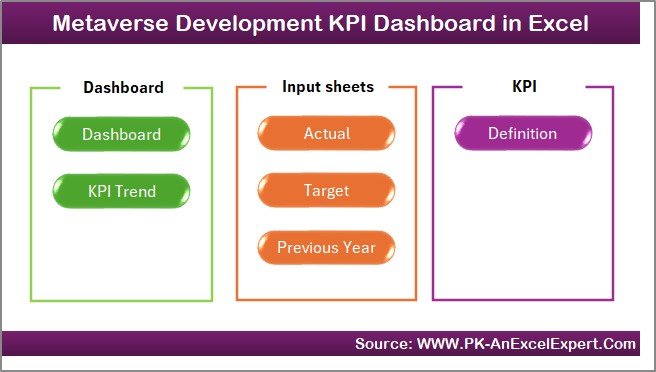
The Home Sheet acts as the navigation hub of the dashboard.
Key Features of the Home Sheet
-
Acts as an index page
-
Contains six navigation buttons
-
Allows instant access to all major sheets
Instead of scrolling through tabs, users can jump directly to the required section. As a result, usability improves significantly.
Click to Purchases Metaverse Development KPI Dashboard in Excel
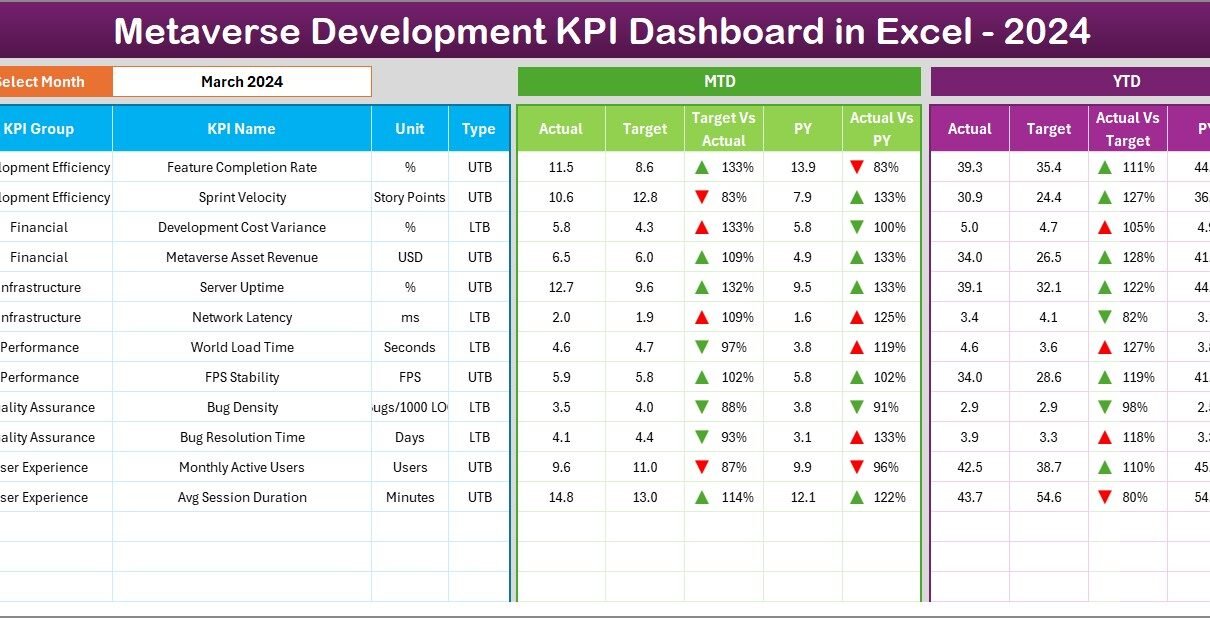
What Is the Dashboard Sheet and Why Is It Important?
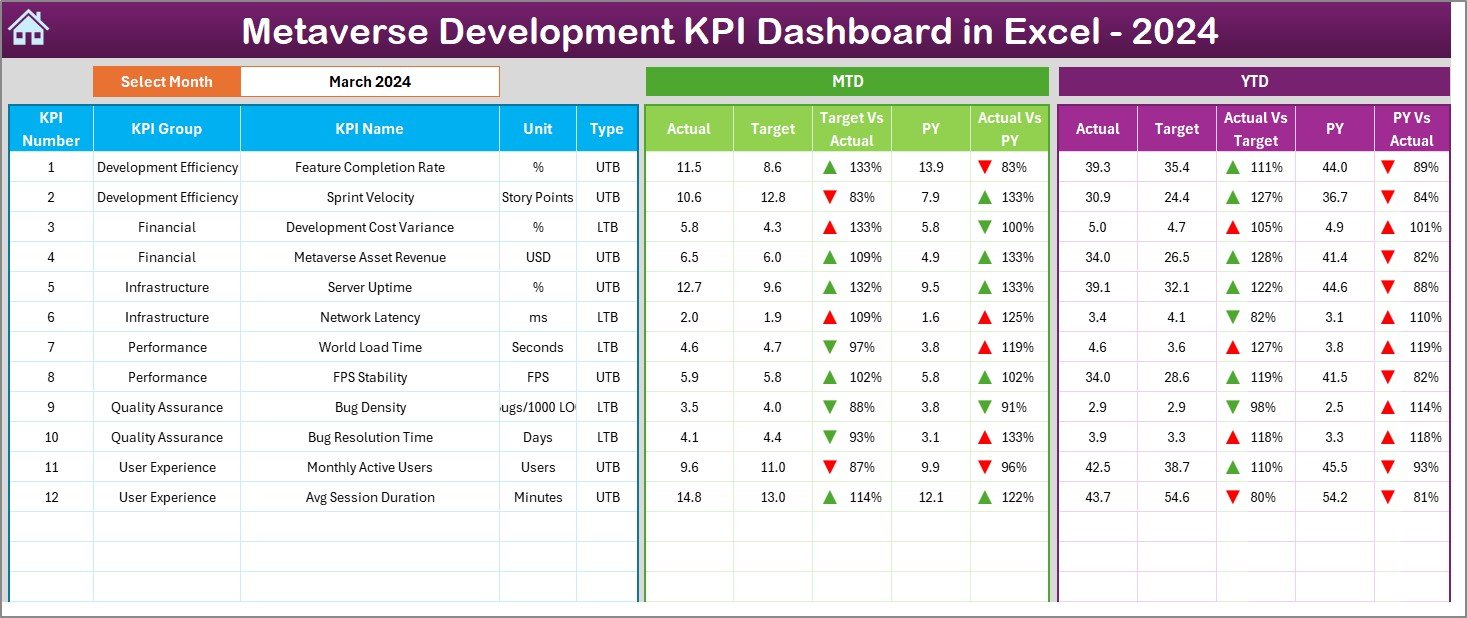
The Dashboard Sheet is the core analytical page of the workbook.
How Does Month Selection Work?
On cell D3, users can select the reporting month from a dropdown. Once selected, the entire dashboard updates automatically for that month.
This feature ensures quick and focused analysis.
What KPI Information Is Displayed on the Dashboard Sheet?
The dashboard displays both MTD and YTD performance metrics, including:
MTD Metrics
-
Actual
-
Target
-
Previous Year
-
Target vs Actual (%)
-
Previous Year vs Actual (%)
YTD Metrics
-
Actual
-
Target
-
Previous Year
-
Target vs Actual (%)
-
Previous Year vs Actual (%)
How Does Conditional Formatting Improve Analysis?
The dashboard uses up and down arrows with color indicators:
-
Green ▲ indicates positive performance
-
Red ▼ indicates negative performance
Because of this visual approach, users can instantly identify underperforming KPIs without scanning numbers.
What Is the KPI Trend Sheet Used For?
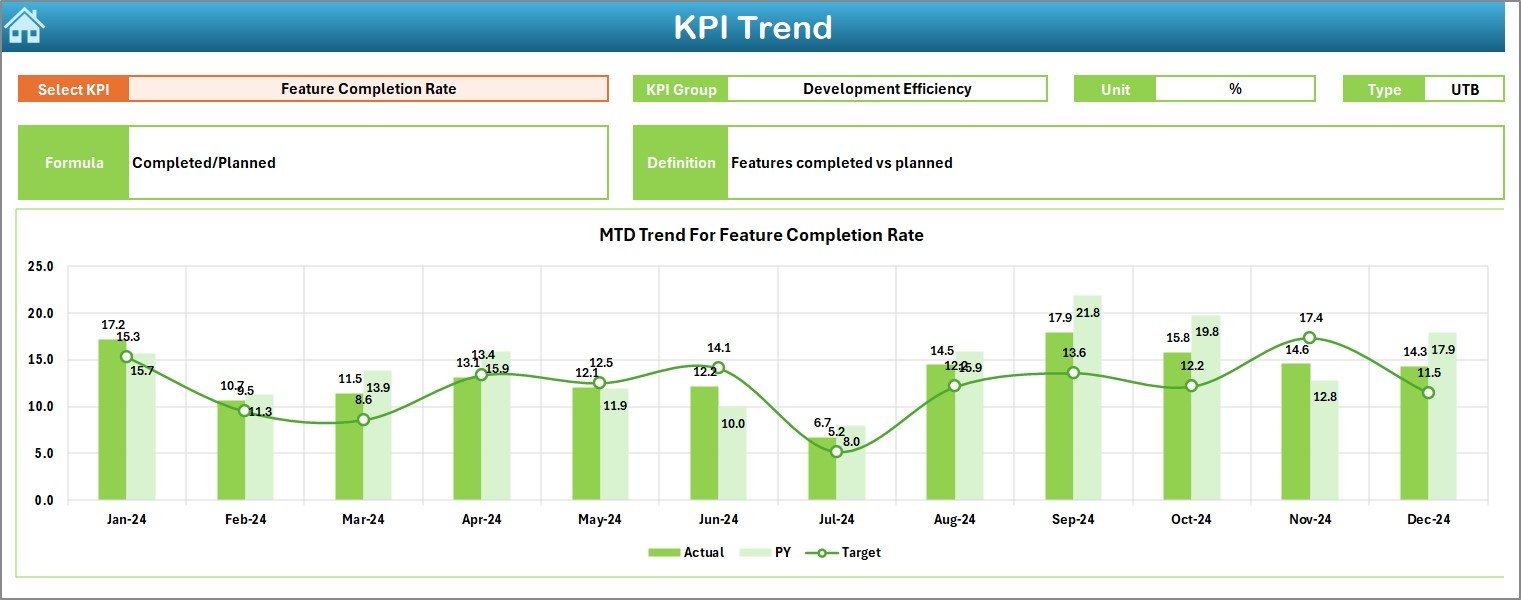
The KPI Trend Sheet focuses on deeper KPI-level analysis.
How Can Users Select a KPI?
On cell C3, users can select a KPI name from a dropdown. Once selected, all related information updates automatically.
What KPI Details Are Displayed?
For the selected KPI, the dashboard shows:
-
KPI Group
-
Unit of Measurement
-
KPI Type (Lower the Better or Upper the Better)
-
KPI Formula
-
KPI Definition
This context helps users understand what the KPI measures and how it is calculated.
Click to Purchases Metaverse Development KPI Dashboard in Excel
What Charts Are Available on the KPI Trend Sheet?
The KPI Trend Sheet displays two trend charts:
-
MTD Trend Chart
-
Actual
-
Target
-
Previous Year
-
-
YTD Trend Chart
-
Actual
-
Target
-
Previous Year
-
Because these charts show performance over time, users can easily detect patterns, seasonality, or recurring issues.
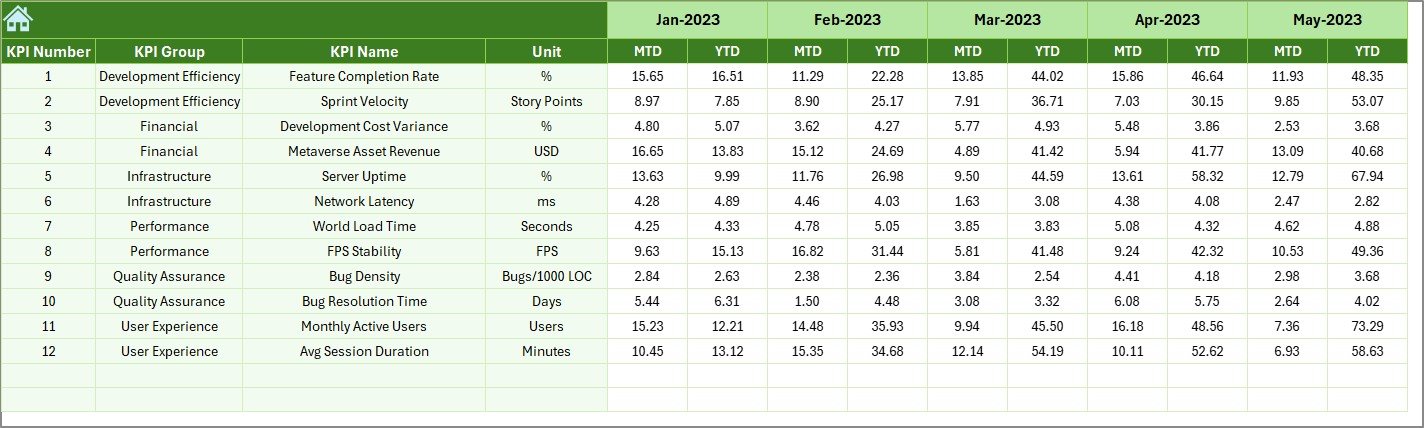
What Is the Actual Numbers Input Sheet?
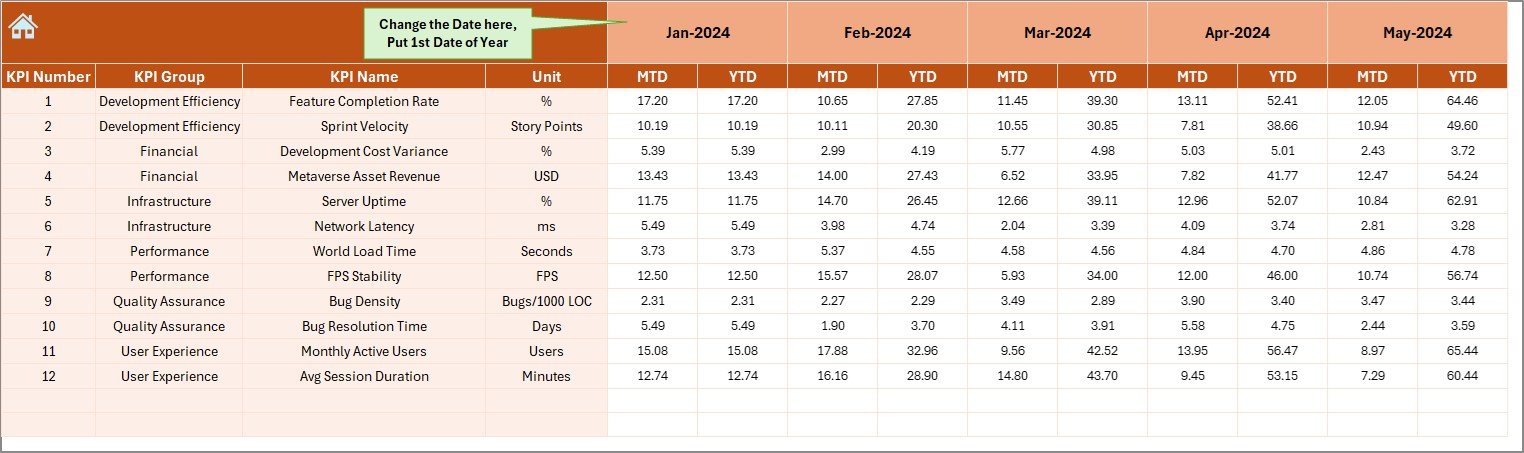
The Actual Numbers Input Sheet is where users enter real performance data.
How Does Month Configuration Work?
On cell E1, users enter the first month of the year. After that, users can change months easily.
What Data Must Be Entered?
Users must enter:
-
KPI Name
-
MTD Actual Value
-
YTD Actual Value
Accurate data entry ensures reliable analysis across the dashboard.
What Is the Target Sheet Used For?
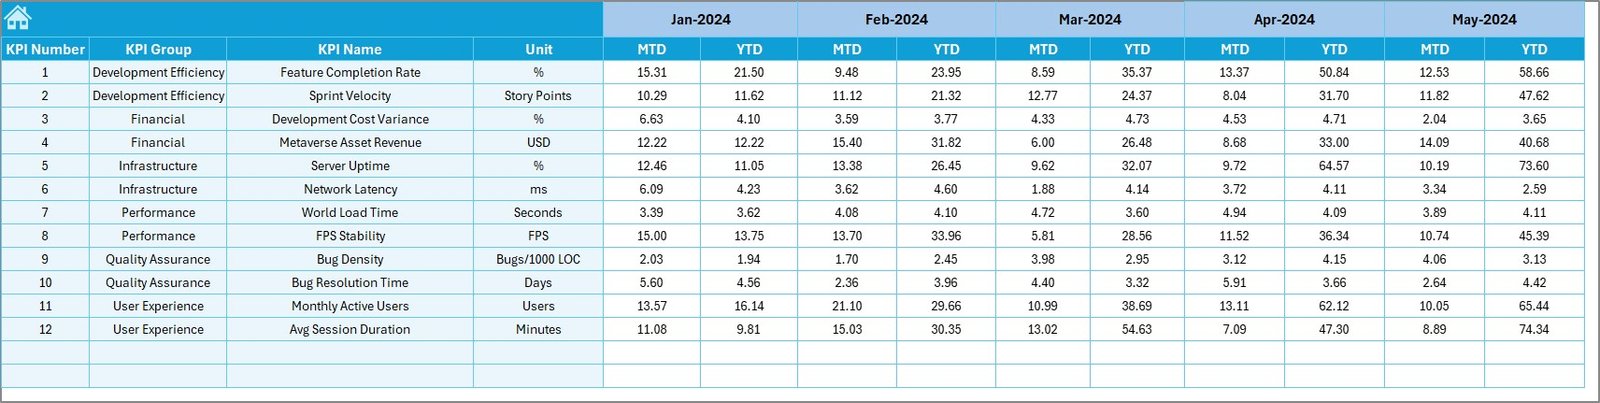
The Target Sheet stores planned KPI values.
What Data Is Required?
For each KPI and month, users must enter:
-
MTD Target
-
YTD Target
Because targets define success criteria, this sheet plays a critical role in performance evaluation.
What Is the Previous Year Number Sheet?
The Previous Year Number Sheet allows historical comparison.
Why Is Previous Year Data Important?
Previous year data helps teams:
-
Measure growth
-
Identify long-term trends
-
Evaluate improvement initiatives
Users enter data in the same structure as current year inputs, which ensures consistent comparisons.
Click to Purchases Metaverse Development KPI Dashboard in Excel
What Is the KPI Definition Sheet Used For?
The KPI Definition Sheet defines the foundation of the dashboard.
What Information Does This Sheet Contain?
-
KPI Name
-
KPI Group
-
Unit
-
Formula
-
KPI Definition
Because this sheet standardizes KPI logic, it ensures clarity and alignment across teams.
Advantages of Metaverse Development KPI Dashboard in Excel
Using this dashboard offers multiple strategic benefits.
1. Centralized KPI Management
All development KPIs remain in one structured workbook.
2. Faster Performance Insights
Visual indicators highlight issues instantly.
3. Improved Decision-Making
MTD and YTD metrics support timely actions.
4. Clear Target Tracking
Teams always know whether they meet goals.
5. Historical Performance Comparison
Previous year analysis reveals progress and gaps.
6. Easy Customization
Excel allows quick KPI additions and changes.
7. No Advanced Tools Required
Teams can use the dashboard without Power BI or coding.
Click to Purchases Metaverse Development KPI Dashboard in Excel
Best Practices for the Metaverse Development KPI Dashboard in Excel
To maximize dashboard value, follow these best practices.
1. Keep KPI Definitions Clear
Avoid ambiguous KPI names or formulas.
2. Maintain Consistent Units
Use consistent measurement units across periods.
3. Update Data Regularly
Monthly updates ensure accurate insights.
4. Validate Inputs Before Review
Always double-check actual and target values.
5. Use Trends for Root Cause Analysis
Do not rely only on current values.
6. Review KPI Types Carefully
Correct UTB and LTB classification improves interpretation.
How Does This Dashboard Support Metaverse Project Success?
This dashboard helps teams:
-
Monitor development velocity
-
Track delivery efficiency
-
Identify performance bottlenecks
-
Improve planning accuracy
-
Align technical execution with business goals
As a result, metaverse projects stay on track and scalable.
Click to Purchases Metaverse Development KPI Dashboard in Excel
Conclusion: Why Should You Use a Metaverse Development KPI Dashboard in Excel?
A Metaverse Development KPI Dashboard in Excel transforms raw development data into actionable insights. Instead of working blindly, teams gain clarity, consistency, and control.
Because it combines structured inputs, dynamic visuals, and KPI best practices, this dashboard becomes a powerful performance management solution for metaverse development teams.
Ultimately, it helps organizations build better virtual experiences—faster and smarter.
Frequently Asked Questions (FAQs)
What is a Metaverse Development KPI Dashboard in Excel?
It is a ready-to-use Excel dashboard that tracks development KPIs using MTD and YTD analysis.
Who can use this dashboard?
Project managers, developers, product owners, and business leaders.
Does the dashboard support multiple KPIs?
Yes, users can track and expand KPIs easily.
Is Excel sufficient for metaverse KPI tracking?
Yes, Excel provides flexibility and accessibility for KPI monitoring.
Can I customize KPIs and targets?
Yes, all KPIs, targets, and formulas are customizable.
How often should data be updated?
Monthly updates provide the best balance of accuracy and effort.
Click to Purchases Metaverse Development KPI Dashboard in Excel
Visit our YouTube channel to learn step-by-step video tutorials