Urban transportation systems continue to expand rapidly. As cities grow, metro rail projects play a crucial role in reducing congestion, lowering pollution, and improving mobility. However, metro rail projects involve massive investments, complex timelines, multiple contractors, and diverse funding sources. Therefore, project teams need a reliable, real-time, and visual monitoring system.
That is exactly where a Metro Rail Projects Dashboard in Power BI becomes a powerful and practical solution.
In this detailed, SEO-friendly article, you will learn what a Metro Rail Projects Dashboard in Power BI is, why it is important, how it works, its page-wise structure, key features, advantages, best practices, and frequently asked questions. Moreover, the language stays clear, simple, and business-focused so that planners, engineers, project managers, and decision-makers can easily understand and use it.
What Is a Metro Rail Projects Dashboard in Power BI?
Click to Purchases Metro Rail Projects Dashboard in Power BI
A Metro Rail Projects Dashboard in Power BI is an interactive data visualization and reporting tool designed to monitor, analyze, and control metro rail project performance in a single platform.
Instead of relying on multiple Excel sheets, static reports, and manual reviews, this dashboard consolidates project data into one dynamic Power BI file. As a result, stakeholders can track budget utilization, project progress, station completion, contractor performance, funding sources, phases, and monthly trends in real time.
Moreover, Power BI slicers allow users to filter data by city, zone, segment type, contractor, phase, funding source, and month, which significantly improves clarity and decision-making.
Why Do Metro Rail Projects Need a Power BI Dashboard?
Metro rail projects involve high capital expenditure and long execution timelines. Therefore, even small delays or cost overruns can result in significant financial impact.
Without a centralized dashboard:
-
Project data remains scattered
-
Cost overruns go unnoticed
-
Progress tracking becomes slow
-
Reporting consumes excessive time
-
Decision-making becomes reactive
However, when teams use a Metro Rail Projects Dashboard in Power BI, they gain instant visibility into project health. Consequently, they can act faster, reduce risks, and improve governance.
How Does a Metro Rail Projects Dashboard in Power BI Work?
A Metro Rail Projects Dashboard in Power BI works by connecting project data to a structured data model and visual layer.
Step-by-Step Working Logic
-
First, project data gets captured in Excel, databases, or ERP systems
-
Then, Power BI imports and transforms the data
-
After that, KPIs, measures, and calculations get applied
-
Finally, interactive visuals display insights across multiple pages
Because Power BI refreshes data easily, teams can always view the latest project status.
What Are the Key Pages in a Metro Rail Projects Dashboard in Power BI?
This dashboard includes five well-structured pages, each designed to answer specific business questions. Let us explore them one by one.
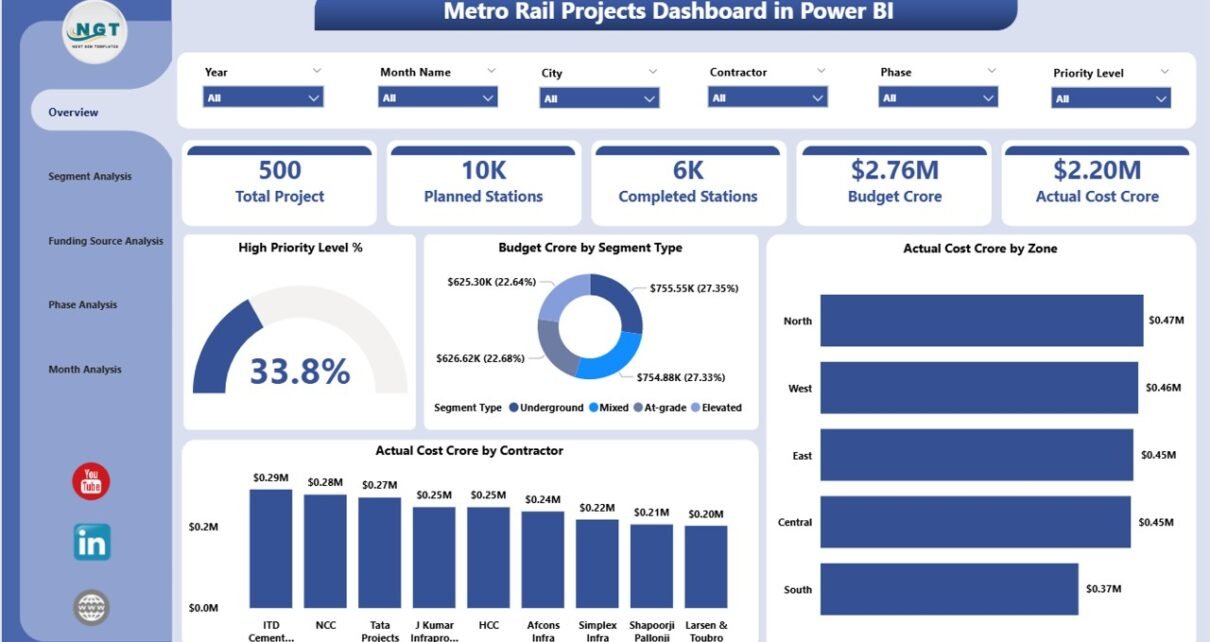
1. Overview Page: What Is the Overall Health of the Metro Rail Project?
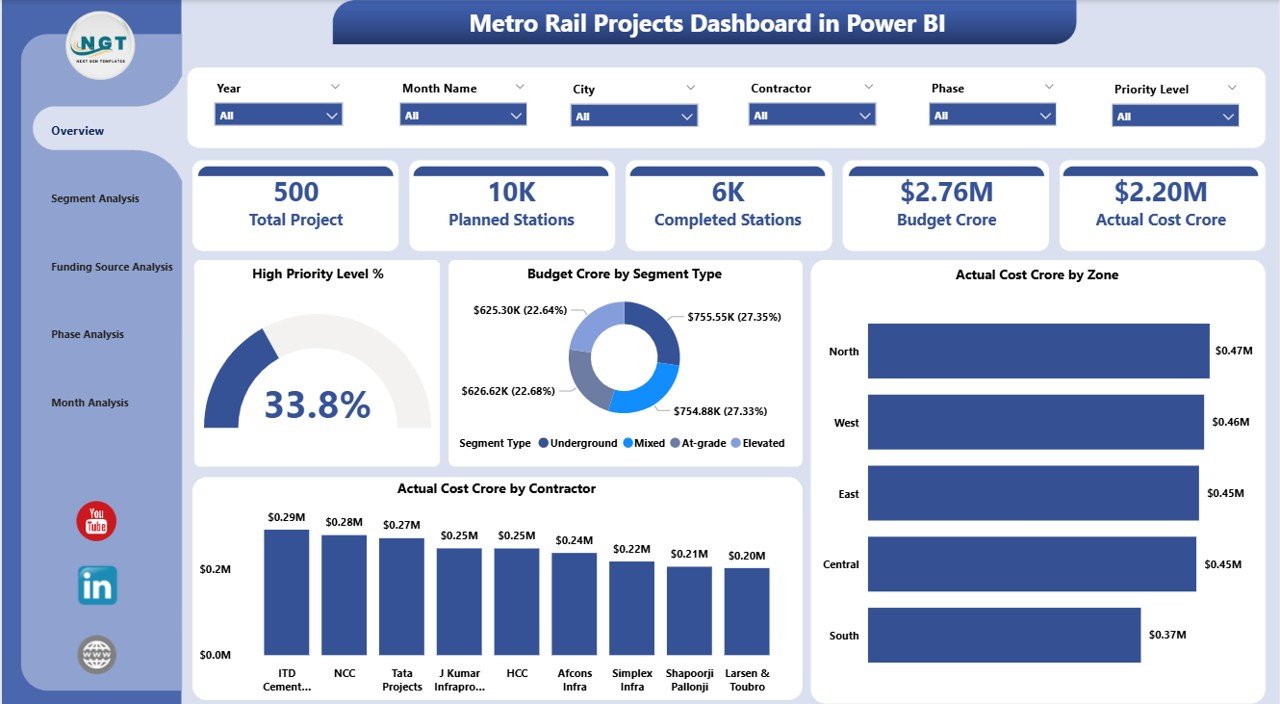
The Overview Page acts as the executive summary of the entire dashboard. It provides a high-level snapshot of project performance.
Key Features of the Overview Page
-
Interactive Slicers for filtering data by city, zone, contractor, or segment
-
4 KPI Cards to highlight critical metrics at a glance
-
4 Visual Charts for cost and priority insights
Visuals Included on the Overview Page
-
High Priority Level % – Shows the percentage of high-priority project components
-
Budget (Crore) by Segment Type – Displays planned budget allocation across segments
-
Actual Cost (Crore) by Zone – Highlights cost consumption zone-wise
-
Actual Cost (Crore) by Contractor – Shows contractor-level spending
Because this page presents summary insights, leadership teams can quickly assess whether the project stays on track.
Click to Purchases Metro Rail Projects Dashboard in Power BI
2. Segment Analysis Page: How Do Different Segment Types Perform?
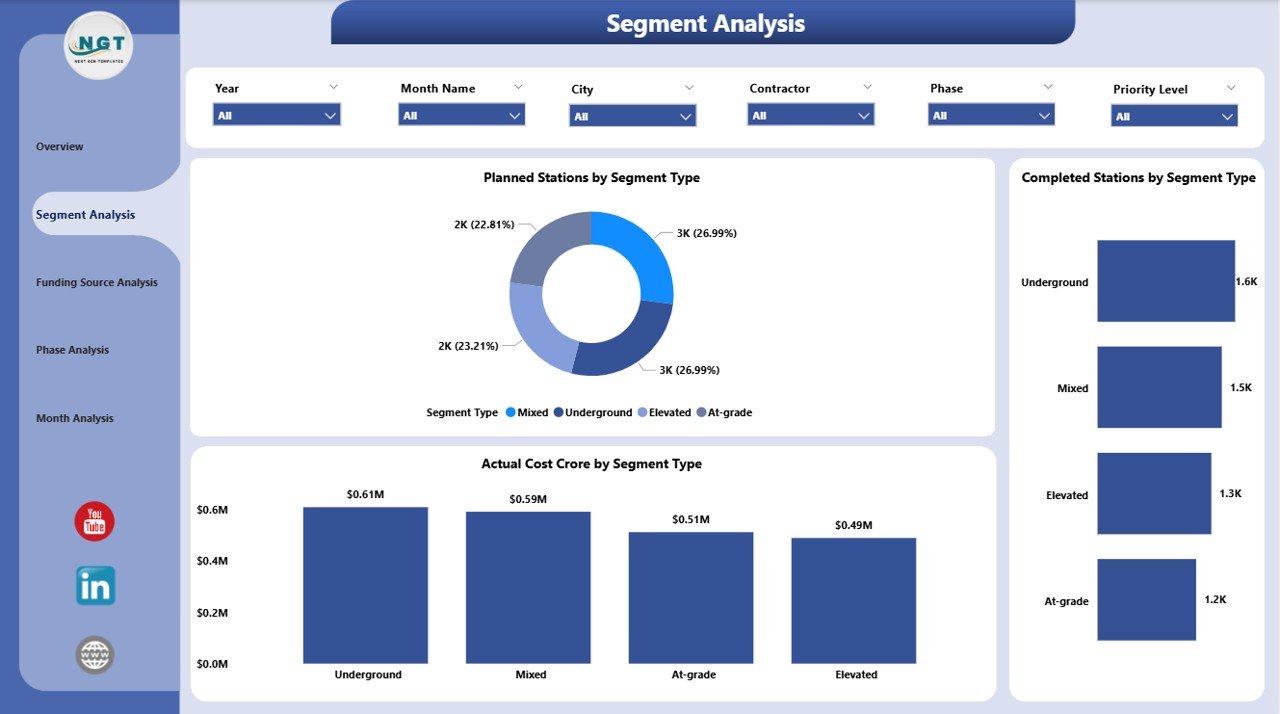
The Segment Analysis Page focuses on performance by segment type, such as elevated, underground, or at-grade sections.
Why Segment Analysis Matters
Different segment types involve different risks, costs, and execution challenges. Therefore, segment-level visibility becomes essential.
Key Visuals on the Segment Analysis Page
-
Planned Stations by Segment Type – Displays planned station distribution
-
Completed Stations by Segment Type – Shows execution progress
-
Actual Cost (Crore) by Segment Type – Highlights cost variation
With slicers applied, users can easily compare planned versus completed stations and identify problem areas.
3. Funding Source Analysis Page: How Do Funding Sources Impact Project Execution?
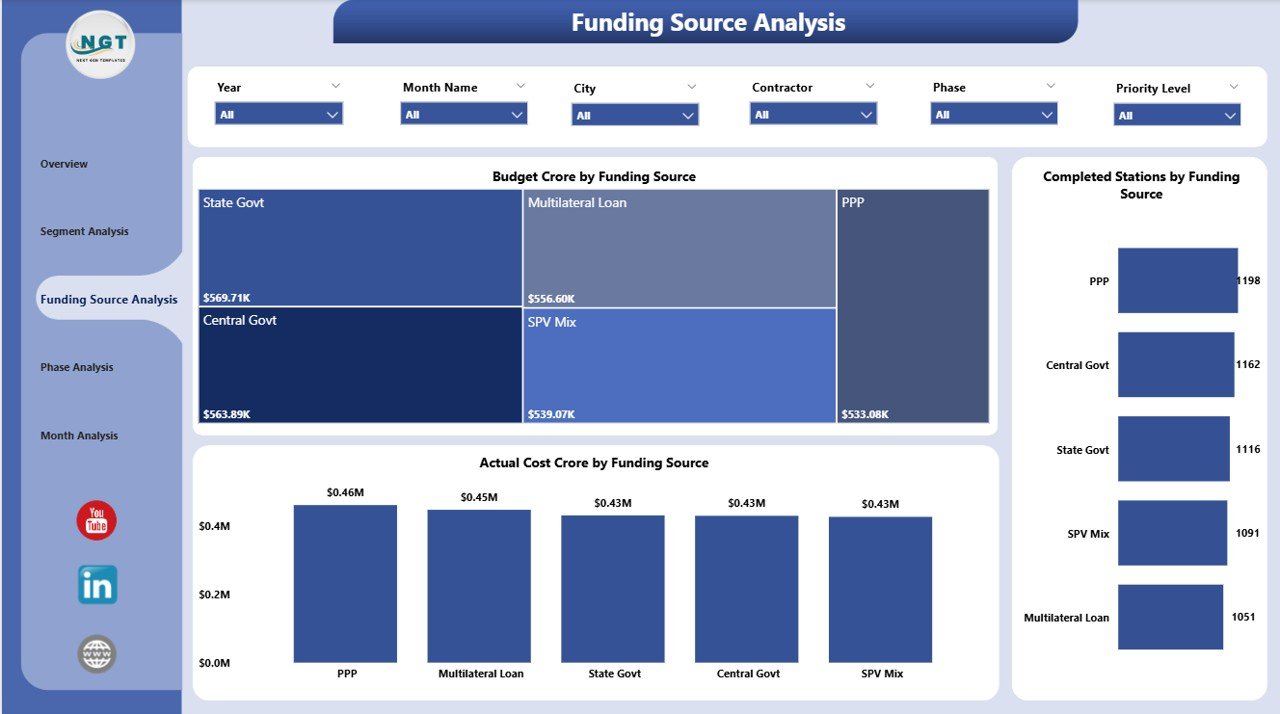
Metro rail projects often receive funding from multiple sources such as government bodies, international agencies, and private investors. Therefore, monitoring funding utilization becomes critical.
Purpose of the Funding Source Analysis Page
This page helps teams understand how budgets and costs distribute across funding sources and cities.
Key Visuals on the Funding Source Analysis Page
-
Budget (Crore) by Funding Source
-
Completed Stations by Funding Source
-
Actual Cost (Crore) by Funding Source
-
Budget Annual by City
-
Capex Budget by City
-
High Priority Projects by City
As a result, finance teams can ensure transparency and compliance while optimizing fund utilization.
4. Phase Analysis Page: How Does Each Project Phase Perform?
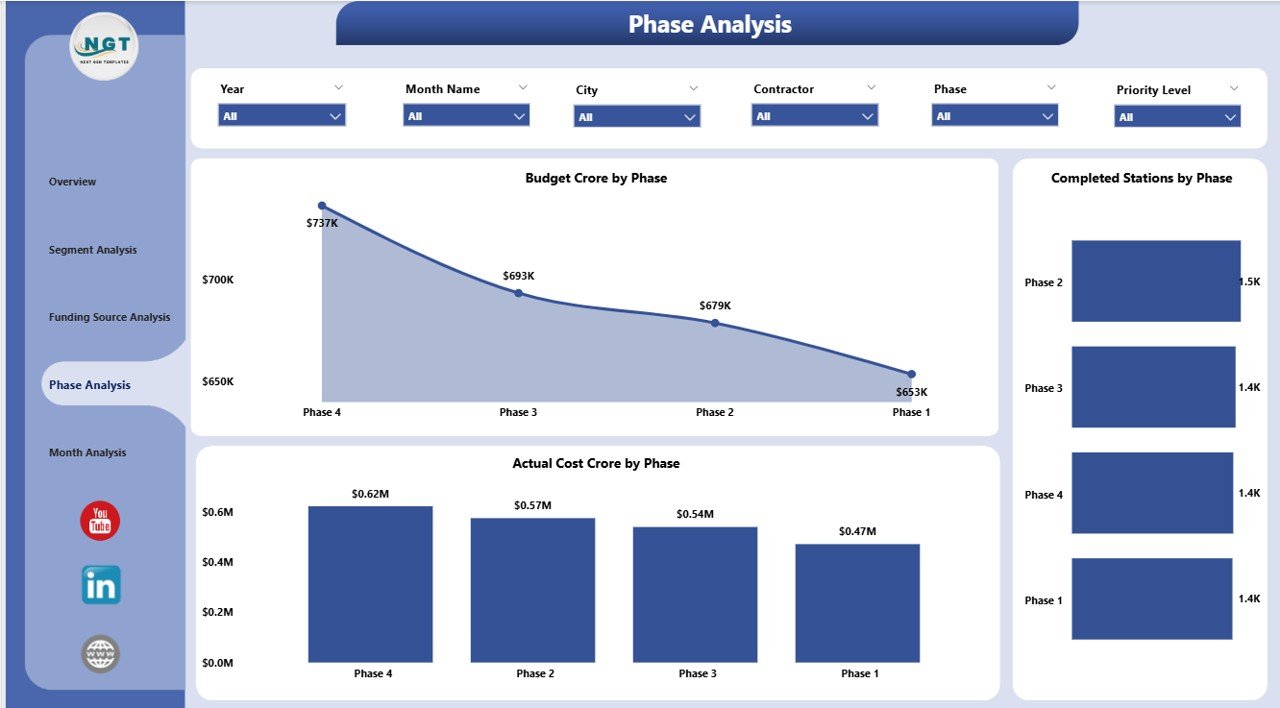
Metro rail projects usually execute in phases. Therefore, phase-wise tracking becomes essential for timeline and cost control.
What Does the Phase Analysis Page Show?
This page focuses on budget, progress, and cost across project phases.
Key Visuals on the Phase Analysis Page
-
Budget (Crore) by Phase
-
Completed Stations by Phase
-
Actual Cost (Crore) by Phase
Because of this structure, project managers can easily identify phases that require immediate attention.
Click to Purchases Metro Rail Projects Dashboard in Power BI
5. Monthly Trends Page: How Does Project Performance Change Over Time?
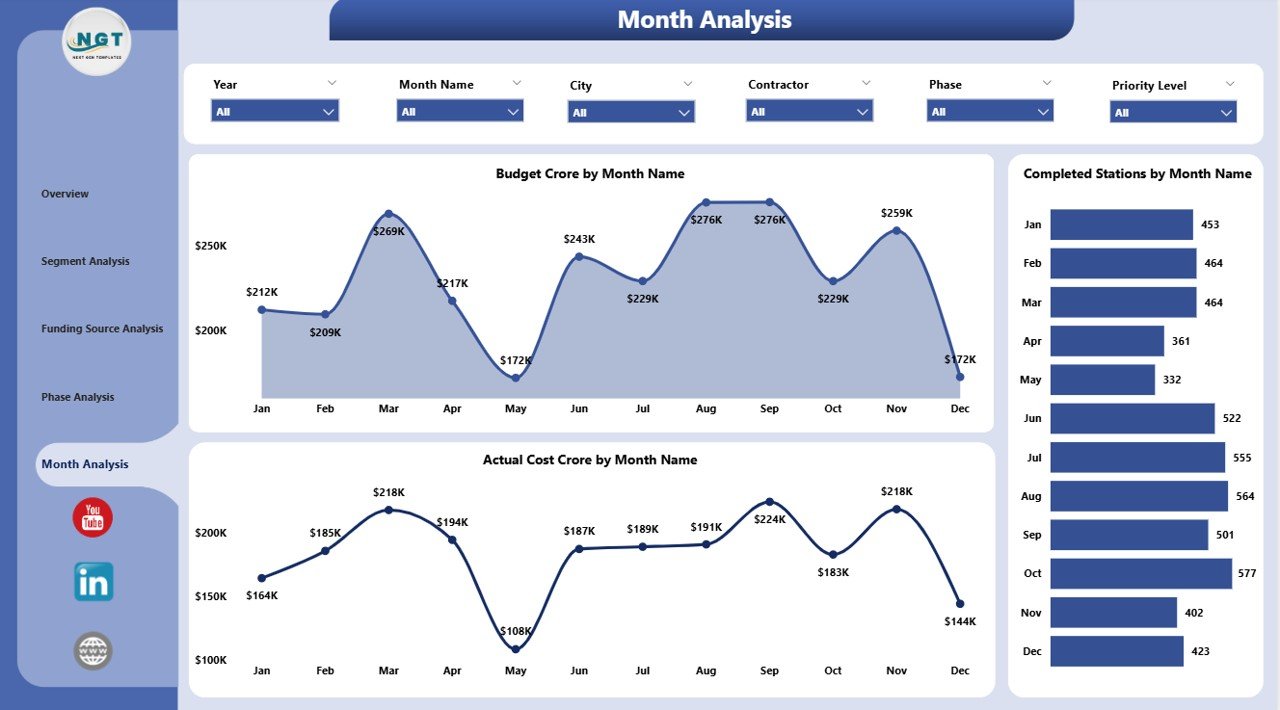
The Monthly Trends Page provides time-based insights, which help teams track momentum and detect patterns.
Why Monthly Trends Matter
Monthly tracking allows teams to:
-
Identify delays early
-
Monitor spending velocity
-
Align execution with targets
Key Visuals on the Monthly Trends Page
-
Budget (Crore) by Month
-
Completed Stations by Month
-
Actual Cost (Crore) by Month
Therefore, leadership can evaluate whether performance improves or declines over time.
What Are the Advantages of a Metro Rail Projects Dashboard in Power BI?
A Metro Rail Projects Dashboard in Power BI delivers multiple strategic and operational benefits.
Key Advantages
-
📊 Centralized Project Visibility – All data in one place
-
⏱ Faster Decision-Making – Real-time insights reduce delays
-
💰 Better Cost Control – Early identification of overruns
-
📍 Improved Accountability – Contractor and zone-level tracking
-
📈 Enhanced Transparency – Clear reporting for stakeholders
-
🔄 Dynamic Filtering – Slicers provide instant drill-down
Because of these advantages, metro authorities can manage projects more efficiently.
Who Can Use a Metro Rail Projects Dashboard in Power BI?
This dashboard supports multiple stakeholders across the project lifecycle.
Primary Users
-
Metro Rail Project Directors
-
Planning and Engineering Teams
-
Finance and Budget Controllers
-
Government Authorities
-
Consultants and PMOs
-
Contractors and Vendors
Each user group benefits from tailored insights without technical complexity.
Best Practices for the Metro Rail Projects Dashboard in Power BI
To get maximum value from this dashboard, teams should follow proven best practices.
1. Use Clean and Structured Data
Always maintain standardized data formats for dates, costs, zones, and segments.
2. Refresh Data Regularly
Ensure timely data refresh so decisions rely on current information.
3. Define Clear KPIs
Align KPIs with project goals such as budget adherence and completion targets.
4. Limit Visual Overload
Use focused visuals to avoid confusion and improve clarity.
5. Apply Consistent Naming Conventions
Maintain uniform naming for phases, segments, and funding sources.
6. Enable Role-Based Access
Control data visibility based on user roles to improve security.
7. Review Dashboard Monthly
Conduct regular review meetings using dashboard insights.
By following these best practices, teams can maintain accuracy and trust in the dashboard.
How Does Power BI Improve Governance in Metro Rail Projects?
Click to Purchases Metro Rail Projects Dashboard in Power BI
Power BI strengthens governance by ensuring data-driven oversight.
-
It improves reporting accuracy
-
It reduces manual intervention
-
It enhances audit readiness
-
It supports compliance tracking
Therefore, organizations can meet regulatory and funding requirements with confidence.
Conclusion: Why Is a Metro Rail Projects Dashboard in Power BI Essential?
A Metro Rail Projects Dashboard in Power BI transforms complex project data into clear, actionable insights. Instead of relying on fragmented reports, teams gain a centralized view of budgets, costs, progress, and trends.
Because of its structured pages, dynamic slicers, and visual clarity, this dashboard supports better planning, stronger cost control, faster decision-making, and improved transparency.
As metro rail projects continue to grow in scale and complexity, adopting a Power BI dashboard no longer remains optional. Instead, it becomes a strategic necessity.
Frequently Asked Questions (FAQs)
What is a Metro Rail Projects Dashboard in Power BI used for?
It helps track budget, cost, progress, funding, phases, and trends for metro rail projects in one interactive report.
Can this dashboard handle multiple cities and zones?
Yes, slicers allow users to filter data by city, zone, contractor, and segment type.
Do I need coding skills to use this dashboard?
No, Power BI dashboards are user-friendly and require no coding for daily use.
Can data come from Excel files?
Yes, Excel commonly acts as the primary data source for this dashboard.
How often should the dashboard be updated?
Teams should update data monthly or weekly based on reporting needs.
Is Power BI suitable for large infrastructure projects?
Yes, Power BI scales well and supports complex infrastructure reporting.
Can this dashboard support executive reporting?
Absolutely. The Overview Page provides high-level insights ideal for leadership.
Visit our YouTube channel to learn step-by-step video tutorials