In the fast-paced world of digital finance, mobile banking has become the backbone of customer convenience and financial innovation. With millions of transactions happening every day, financial institutions need accurate, real-time insights to ensure smooth operations, track performance, and maintain customer satisfaction.
That’s where the Mobile Banking Dashboard in Excel comes in — a powerful, ready-to-use Excel template designed to help banks and financial teams monitor key banking metrics efficiently.
This dashboard provides a clear view of transaction patterns, service fees, satisfaction ratings, and regional performance — all in one place, without the need for coding or complex BI tools.
Click to Purchases Mobile Banking Dashboard in Excel
What Is a Mobile Banking Dashboard in Excel?
A Mobile Banking Dashboard in Excel is an interactive analytics tool that tracks performance indicators related to mobile banking operations. It consolidates data on transactions, fees, success rates, and user satisfaction into a single, visually appealing Excel file.
Built with dropdowns, slicers, and automated charts, this dashboard helps banking professionals analyze Month-to-Date (MTD) and Year-to-Date (YTD) data in real time.
By transforming complex datasets into visual insights, it enables smarter decisions for improving efficiency, reliability, and customer experience in mobile banking services.
Key Features of the Mobile Banking Dashboard
This Excel dashboard is organized into five analytical pages along with a support sheet and a data sheet. Each page focuses on a specific aspect of mobile banking operations.
Let’s explore them one by one.
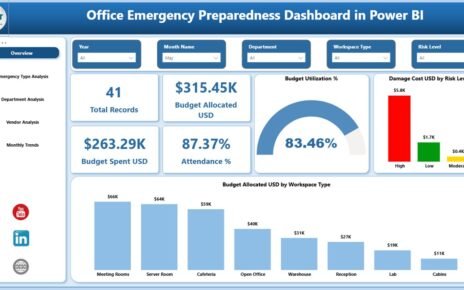
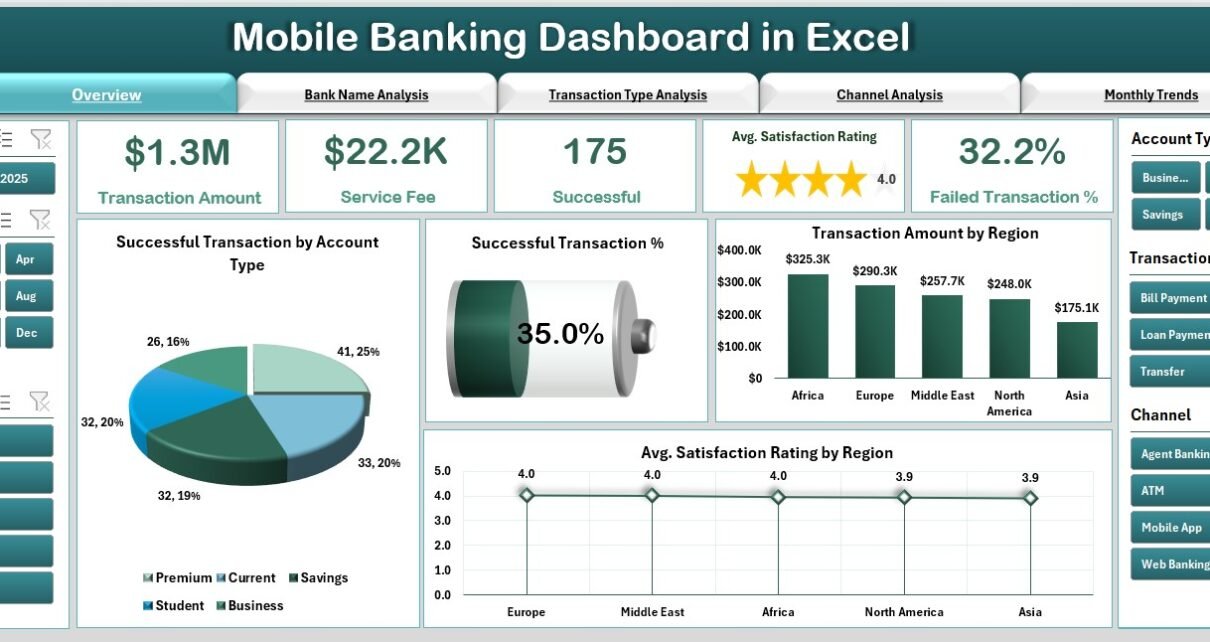
1️⃣ Overview Page – The Central Performance Hub
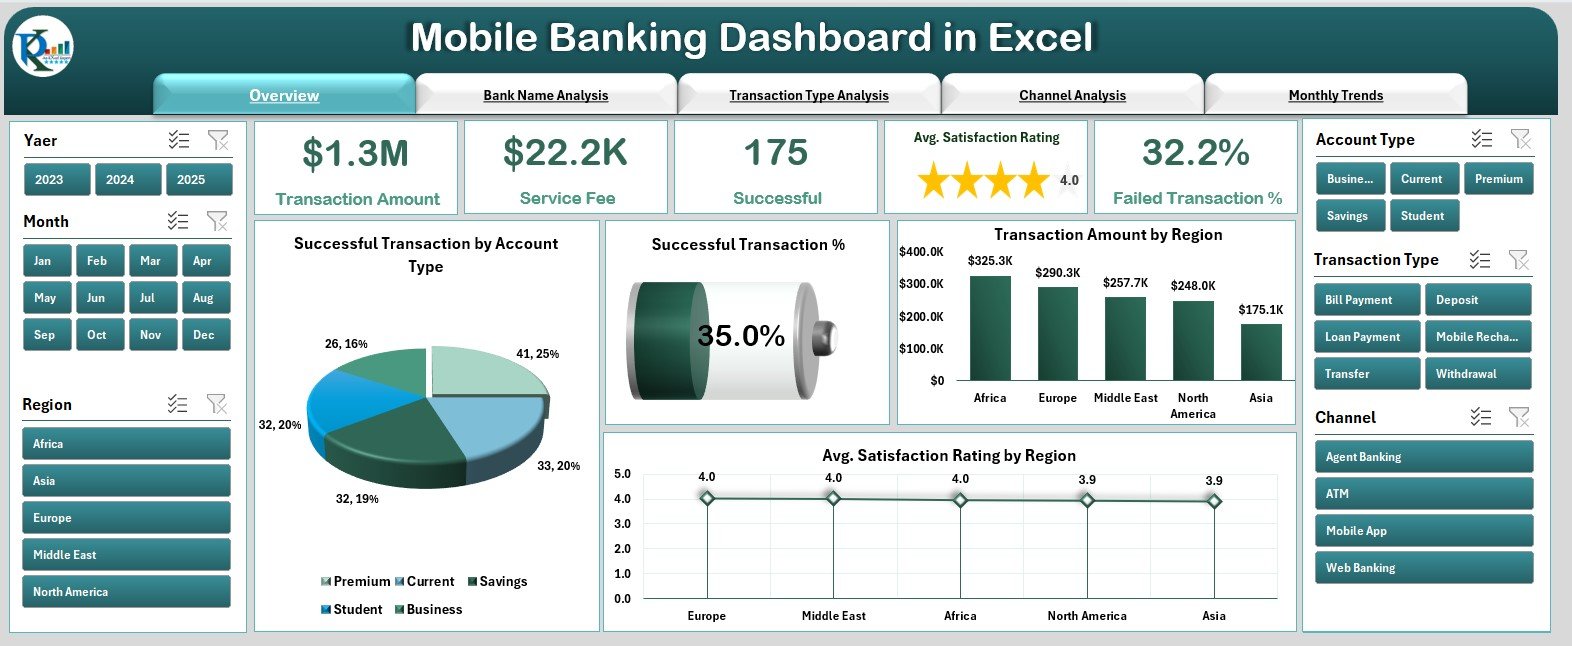
The Overview Page acts as the primary dashboard where all critical performance indicators are displayed.
Features include:
-
Page Navigator: Located on the left side, it allows quick navigation between analytical pages.
-
Right-Side Slicer Panel: Enables users to filter data by month, region, or KPI group.
-
Five KPI Cards: Show high-level metrics such as total transactions, total amount processed, average satisfaction rating, successful transaction rate, and service fee percentage.
Charts on this page:
-
✅ Success Transactions by Account Type
-
💰 Total Successful Transactions
-
🌍 Transaction Amount by Region
-
⭐ Average Satisfaction Rating by Region
This page gives management a clear snapshot of operational efficiency and customer sentiment at a glance.
Click to Purchases Mobile Banking Dashboard in Excel
2️⃣ Bank Name Analysis – Compare Bank-Wise Performance
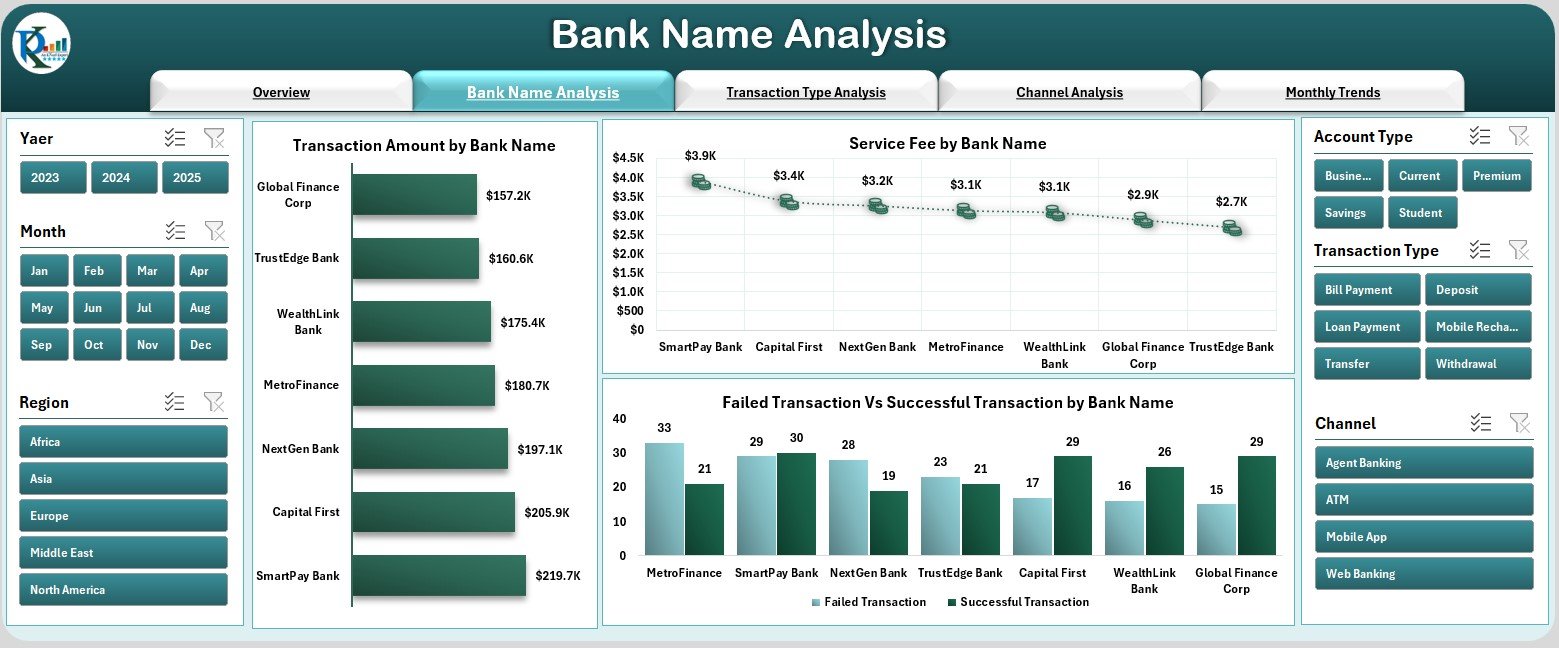
The Bank Name Analysis Page focuses on comparing performance across different banks or financial entities linked to your mobile banking ecosystem.
Charts include:
-
💵 Transaction Amount by Bank Name
-
💳 Service Fee by Bank Name
-
📉 Failed vs Successful Transactions by Bank Name
With these visuals, you can quickly identify high-performing banks, detect operational inefficiencies, and assess service fee distributions.
3️⃣ Transaction Type Analysis – Understand User Behavior
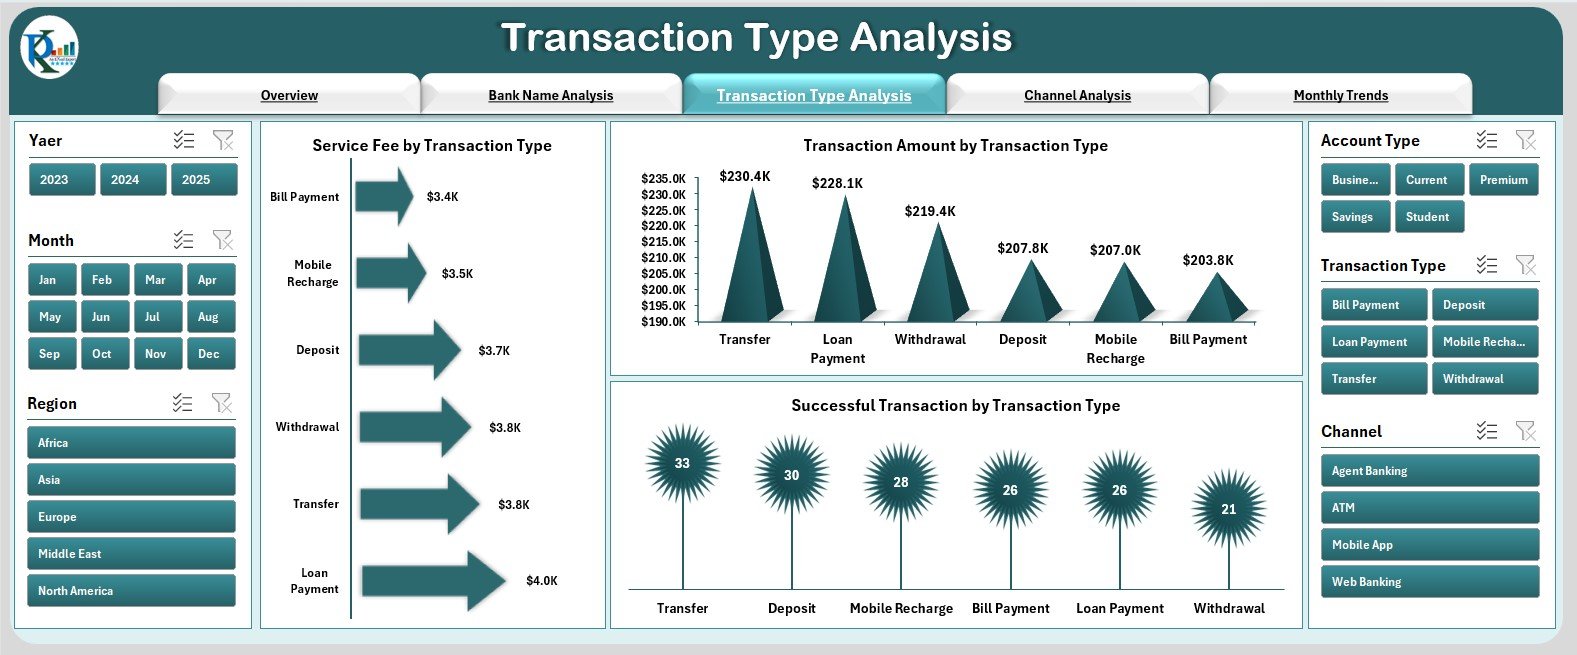
This page helps analyze transaction patterns based on transaction types (like transfers, bill payments, recharges, deposits, etc.).
Charts included:
-
💰 Service Fee by Transaction Type
-
🔄 Transaction Amount by Transaction Type
-
📊 Successful Transactions by Transaction Type
This analysis highlights which transaction categories generate the most volume or revenue and which require optimization.
4️⃣ Channel Analysis – Evaluate Channel Efficiency
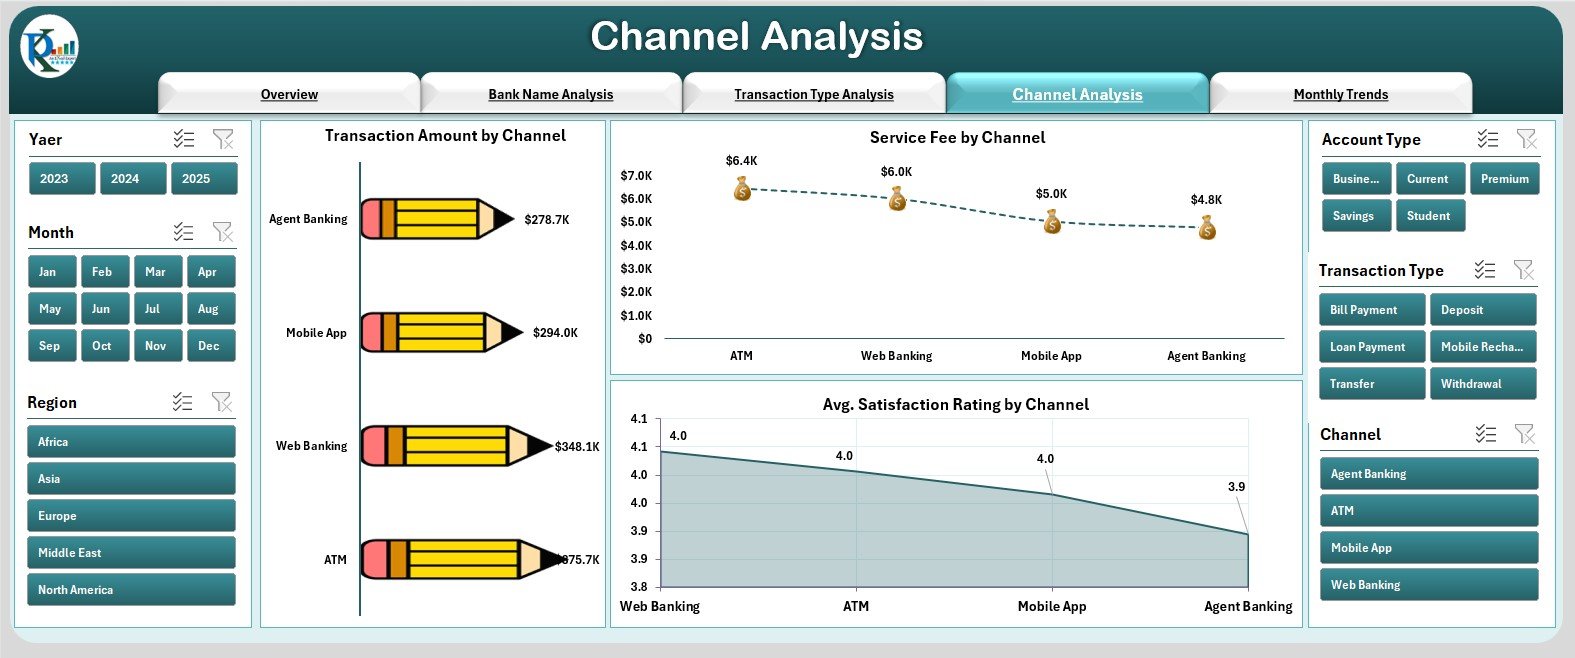
Modern mobile banking uses multiple digital channels like mobile apps, SMS, USSD, or web portals. The Channel Analysis Page helps assess how each performs.
Charts include:
-
📱 Transaction Amount by Channel
-
💵 Service Fee by Channel
-
⭐ Average Satisfaction Rating by Channel
By reviewing these insights, banks can identify which channels are most popular and which ones need technical or service improvements.
5️⃣ Monthly Trends – Track Progress Over Time
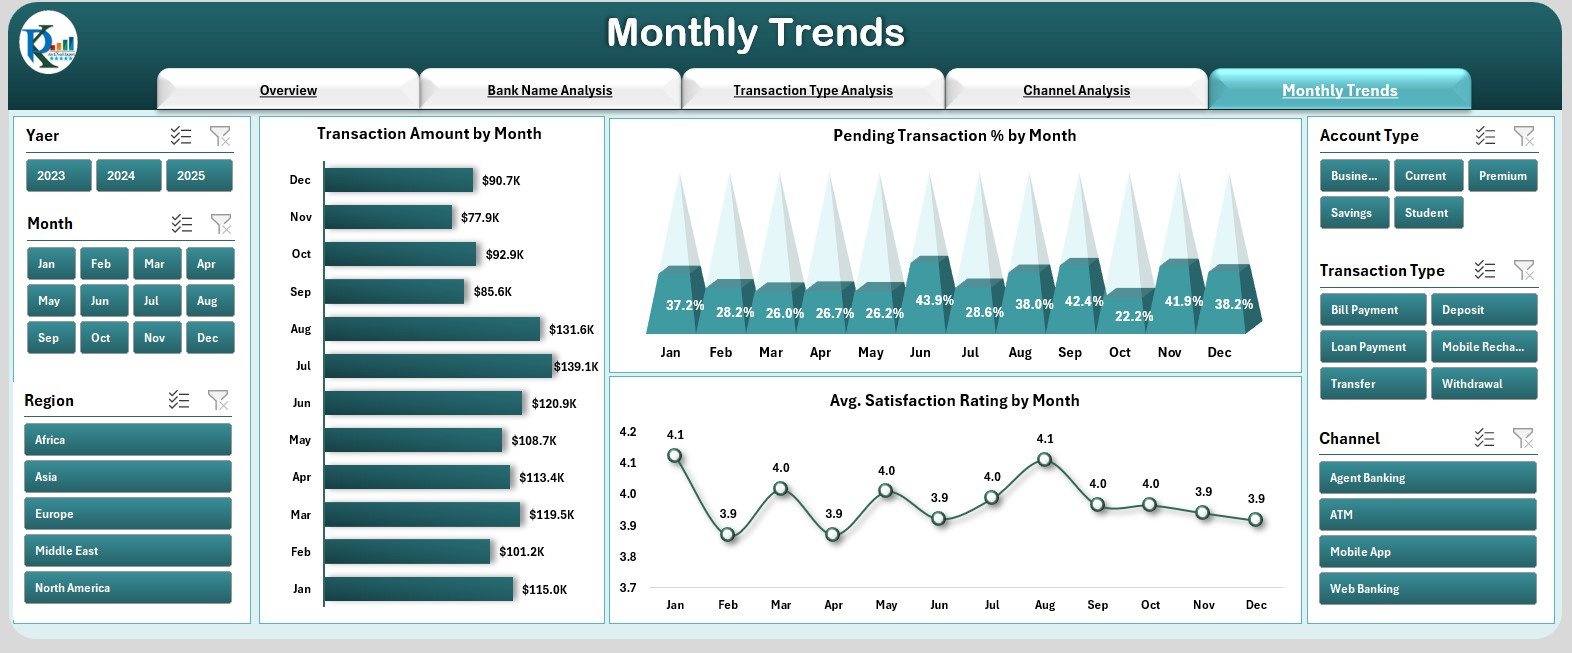
The Monthly Trends Page offers a longitudinal view of key metrics to identify seasonality or performance changes over time.
Charts included:
-
📅 Transaction Amount by Month
-
⚠️ Pending Transaction % by Month
-
🌟 Average Satisfaction Rating by Month
Trend analysis helps management understand monthly variations, plan resources better, and track improvement initiatives.
Support Sheet
This sheet contains all background calculations, formulas, and supporting lookups that drive the visual elements of the dashboard.
Data Sheet
The Data Sheet is the foundation of this dashboard — it contains all raw transactional and KPI data. Updating this sheet refreshes the entire dashboard automatically.
Click to Purchases Mobile Banking Dashboard in Excel
Benefits of the Mobile Banking Dashboard in Excel
This dashboard empowers financial teams with actionable insights that enhance customer service and operational performance.
1️⃣ Real-Time Decision Making
Monitor live KPIs such as transaction volume, success rates, and satisfaction metrics.
2️⃣ Simplified Reporting
Consolidate multiple banking metrics into one automated Excel report.
3️⃣ Improved Transparency
Every stakeholder — from operations to management — can access consistent data.
4️⃣ Cost-Effective Analytics
No expensive software needed — Excel handles everything.
5️⃣ Visual Storytelling
Charts, slicers, and indicators make complex data easy to interpret.
6️⃣ Enhanced Customer Experience
Track customer satisfaction trends to improve service delivery.
Key KPIs to Track in Mobile Banking
A robust mobile banking dashboard should monitor KPIs across different operational dimensions.
Transaction KPIs
-
Total Transactions (Count) – Measures total number of processed transactions.
-
Success Rate (%) – Compares successful transactions to total initiated ones.
-
Failed Transactions (%) – Identifies service reliability issues.
-
Pending Transactions (%) – Tracks incomplete or delayed transactions.
Financial KPIs
-
Transaction Amount (USD) – Total value of processed transactions.
-
Service Fee (USD) – Measures fee income from transactions.
-
Average Transaction Value (USD) – Calculates mean value per transaction.
Customer Experience KPIs
-
Average Satisfaction Rating – Measures overall customer sentiment.
-
Complaint Rate (%) – Indicates quality of service delivery.
-
Response Time (Minutes) – Tracks average resolution time for issues.
Channel Efficiency KPIs
-
Transactions by Channel – Distribution across mobile app, USSD, web, etc.
-
Revenue by Channel – Determines which platform generates maximum income.
Advantages of the Mobile Banking Dashboard
Implementing this dashboard offers measurable benefits for financial institutions.
1. 360° Performance View
Get a comprehensive picture of all mobile banking operations across channels, banks, and regions.
2. Predictive Insights
Identify early trends in satisfaction or transaction delays to take proactive action.
3. Streamlined Operations
Locate process bottlenecks and improve turnaround times.
4. Better Resource Allocation
Use data insights to prioritize upgrades in high-traffic channels.
5. Enhanced Customer Trust
Consistent monitoring ensures reliability and improves customer confidence.
Click to Purchases Mobile Banking Dashboard in Excel
Best Practices for Using the Dashboard
To maximize the value of your Mobile Banking Dashboard in Excel, follow these best practices:
1️⃣ Keep Data Updated
Ensure monthly data entry in the Data Sheet for accurate reports.
2️⃣ Validate Input Accuracy
Verify figures for transaction amounts and success rates before analysis.
3️⃣ Maintain a Clean Data Structure
Use consistent naming conventions for banks, regions, and channels.
4️⃣ Leverage Conditional Formatting
Highlight key metrics such as low satisfaction or high failure rates for instant visibility.
5️⃣ Regularly Review Trends
Analyze performance monthly to identify emerging issues early.
6️⃣ Integrate Feedback Loops
Use customer feedback data to strengthen the satisfaction rating metrics.
7️⃣ Secure Data Access
Since this dashboard contains sensitive banking data, restrict access appropriately.
How the Dashboard Supports Decision-Making
The Mobile Banking Dashboard in Excel supports multiple teams:
-
Operations Teams: Identify and fix transactional bottlenecks.
-
Finance Departments: Monitor revenue, service fees, and growth trends.
-
Customer Experience Teams: Track satisfaction scores and complaint trends.
-
Management: Use summarized insights for board reporting and strategy planning.
By consolidating all KPIs in one dashboard, decisions become faster, data-driven, and more accurate.
Implementation Steps
-
Prepare Data – Collect transaction data by month, type, region, and bank.
-
Input Data – Fill the Excel Data Sheet with actual figures.
-
Set Up Page Navigator – Link each page for smooth navigation.
-
Add Slicers – Use Excel slicers for dynamic filtering by month or KPI group.
-
Build Charts – Use combo charts for comparing MTD, YTD, and satisfaction trends.
-
Apply Conditional Formatting – Use color indicators to show performance levels.
-
Test and Validate – Review calculations to ensure accuracy.
-
Review Monthly – Update data and review performance against benchmarks.
Conclusion
The Mobile Banking Dashboard in Excel is a comprehensive, easy-to-use solution for monitoring digital banking operations. It empowers banks to track success rates, analyze regional trends, and measure customer satisfaction — all from a single Excel file.
With its structured design, powerful charts, and interactive filters, this dashboard simplifies financial analytics and enhances data-driven decision-making.
Whether you’re a banking professional, analyst, or financial manager, this tool helps you stay ahead in the digital finance era — ensuring smoother operations and happier customers.
Click to Purchases Mobile Banking Dashboard in Excel
Frequently Asked Questions (FAQs)
1. What is the purpose of the Mobile Banking Dashboard in Excel?
It helps banks analyze mobile transaction data, monitor KPIs, and improve performance through clear visuals.
2. Can I customize the charts and KPIs?
Yes. You can easily modify KPIs, units, and chart types to fit your banking metrics.
3. Does it support MTD and YTD analysis?
Absolutely. The dashboard compares Month-to-Date and Year-to-Date performance.
4. Do I need Power BI for this?
No. This dashboard is built completely in Excel — no external software required.
5. How often should I update the data?
Monthly updates are recommended to keep the reports fresh and accurate.
Click to Purchases Mobile Banking Dashboard in Excel
Visit our YouTube channel to learn step-by-step video tutorials