Mobile gaming has become one of the fastest-growing segments in the global entertainment industry. As a result, game studios, publishers, and marketing teams must track performance data accurately and consistently. However, when data stays scattered across reports and tools, decision-making becomes slow and unclear. Therefore, teams need a structured and visual reporting system.
That is exactly why a Mobile Gaming Dashboard in Excel plays a critical role.
In this detailed article, you will learn what a Mobile Gaming Dashboard in Excel is, why it matters, how it works, its page-wise structure, key metrics, advantages, best practices, and frequently asked questions. By the end of this guide, you will clearly understand how this ready-to-use Excel dashboard helps gaming businesses improve revenue, user engagement, and marketing efficiency.
Click to Purchases Mobile Gaming Dashboard in Excel
What Is a Mobile Gaming Dashboard in Excel?
A Mobile Gaming Dashboard in Excel is a centralized performance tracking and analytics tool designed to monitor key mobile game metrics in one place. It converts raw gaming data into meaningful visuals, charts, and KPIs that help teams make informed decisions.
Instead of reviewing multiple spreadsheets or static reports, teams use this interactive dashboard to analyze revenue, user behavior, acquisition channels, and game performance trends. Moreover, because Excel remains widely used and flexible, teams can easily customize and scale the dashboard.
Most importantly, this dashboard supports data-driven strategies across game development, monetization, and marketing.
Why Do Mobile Gaming Companies Need a Dashboard in Excel?
Mobile gaming generates massive amounts of data every day. However, without proper analysis, that data remains useless. Therefore, a Mobile Gaming Dashboard in Excel becomes essential.
Here is why it matters:
-
It provides real-time visibility into game performance
-
It helps track revenue and monetization trends
-
It improves marketing ROI analysis
-
It simplifies decision-making for stakeholders
-
It reduces manual reporting effort
As a result, gaming companies can respond faster to market changes and player behavior.
How Does a Mobile Gaming Dashboard in Excel Work?
A Mobile Gaming Dashboard in Excel works by connecting structured data tables with dynamic visuals. First, teams input or import data into a Data Sheet. Then, Excel formulas, pivot tables, and charts process that data.
After that, slicers and filters allow users to explore metrics by game name, genre, platform, acquisition channel, or month. Consequently, decision-makers can instantly view insights without manual calculations.
Because Excel supports automation and customization, the dashboard remains flexible and scalable.
Key Features of the Mobile Gaming Dashboard in Excel
This ready-to-use Mobile Gaming Dashboard in Excel includes powerful features that enhance usability and analysis.
Page Navigator for Easy Navigation
The dashboard includes a Page Navigator located on the left side. This feature allows users to switch between different analytical pages quickly. Therefore, users do not waste time scrolling or searching for sheets.
Right-Side Slicers for Interactive Analysis
Each analytical page includes right-side slicers. These slicers allow users to filter data dynamically by key dimensions such as game name, genre, channel, or time period. As a result, analysis becomes faster and more intuitive.
Multi-Page Analytical Structure
The dashboard contains five dedicated analytical pages, each focusing on a specific aspect of mobile gaming performance. Additionally, support sheets ensure smooth data management.
Page-Wise Structure of the Mobile Gaming Dashboard in Excel
Click to Purchases Mobile Gaming Dashboard in Excel
Let us now explore each page of the dashboard in detail.
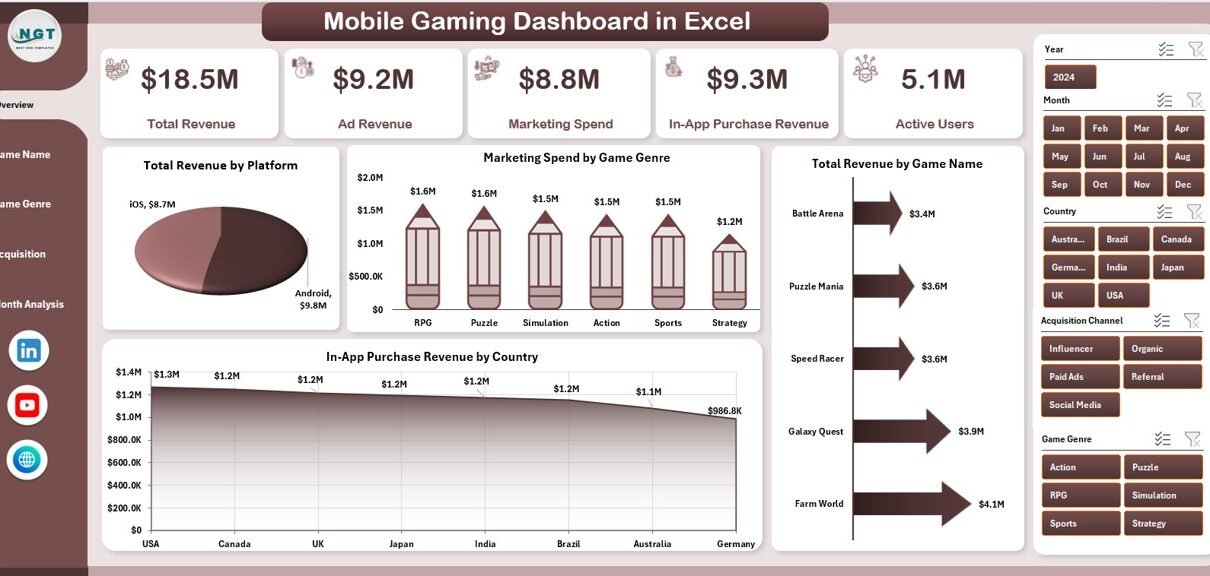
1. Overview Page: How Do You Get a Snapshot of Overall Performance?
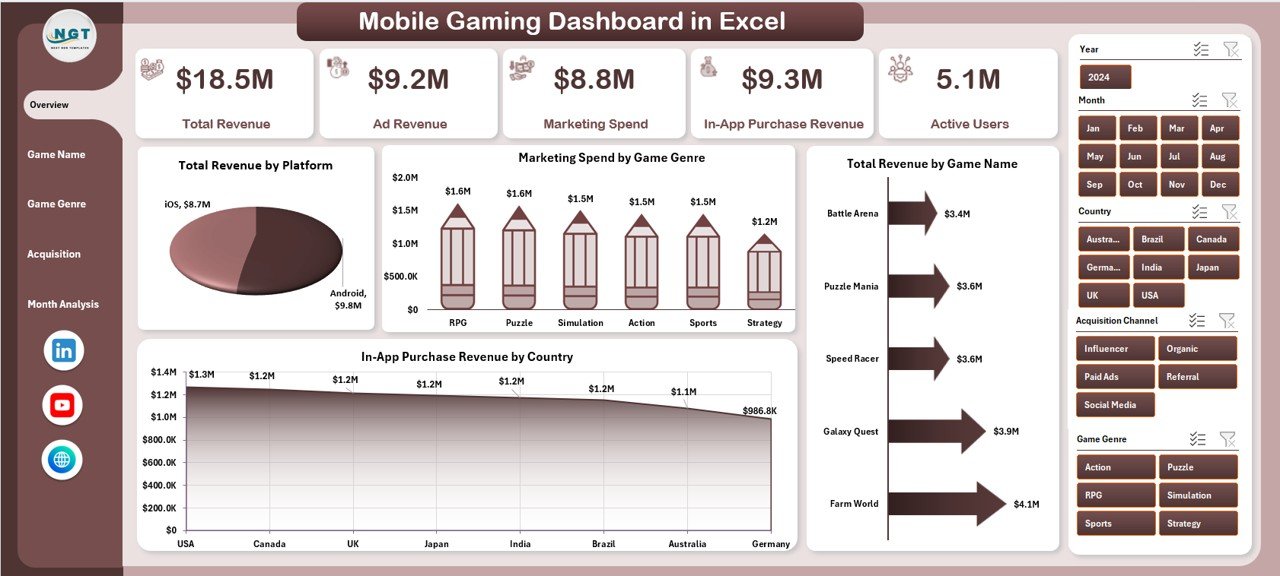
The Overview Page serves as the main landing page of the dashboard. It provides a high-level summary of key metrics and trends.
Key Components of the Overview Page
-
Right-side slicer for filtering data
-
Four KPI cards for quick insights
-
Four performance charts
Charts Included on the Overview Page
-
Total Revenue by Platform
This chart helps compare revenue across different platforms such as Android and iOS. -
Marketing Spend by Game Genre
This visual shows how marketing budgets distribute across genres. -
Total Revenue by Game Name
This chart highlights top-performing and underperforming games. -
In-App Purchases Revenue by Country
This chart reveals geographic revenue trends.
Because this page shows all critical metrics at once, decision-makers can quickly assess overall performance.
2. Game Name Analysis: Which Games Perform the Best?
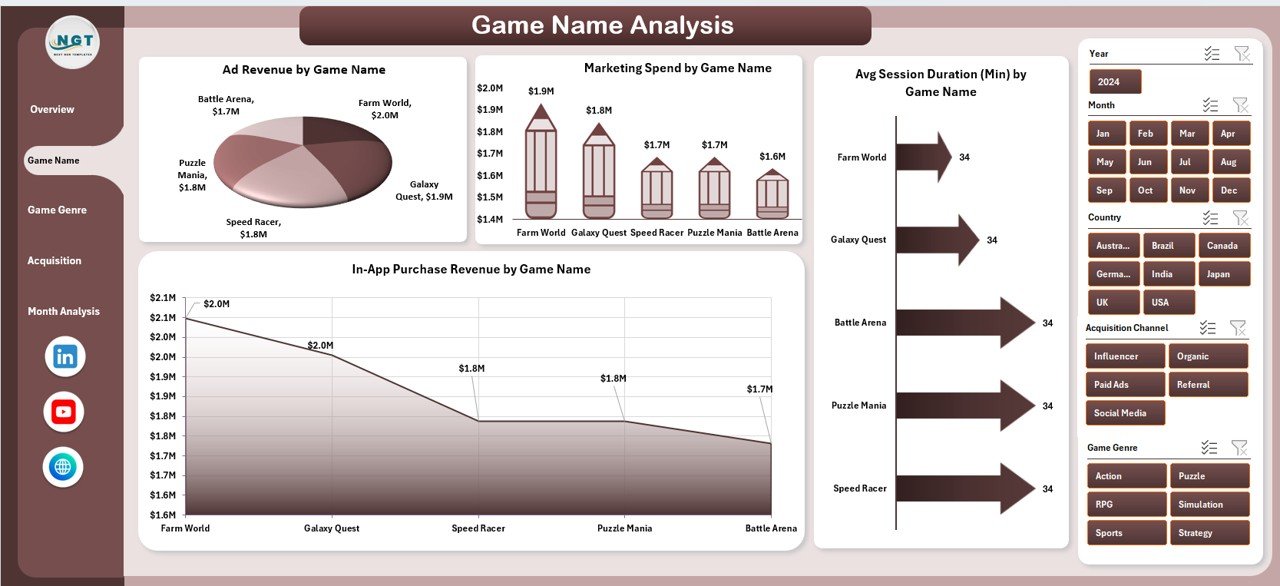
The Game Name Analysis page focuses on performance comparison across individual games.
Key Features of Game Name Analysis
-
Right-side slicer for selecting specific games
-
Four detailed charts
Charts Included in Game Name Analysis
-
Ad Revenue by Game Name
This chart shows which games generate the highest ad revenue. -
Marketing Spend by Game Name
This visual helps analyze budget allocation per game. -
Average Session Duration by Game Name
This metric indicates player engagement levels. -
In-App Purchases Revenue by Game Name
This chart highlights monetization strength per game.
As a result, teams can identify which games deserve more investment or optimization.
3. Game Genre Analysis: Which Genres Drive Growth?
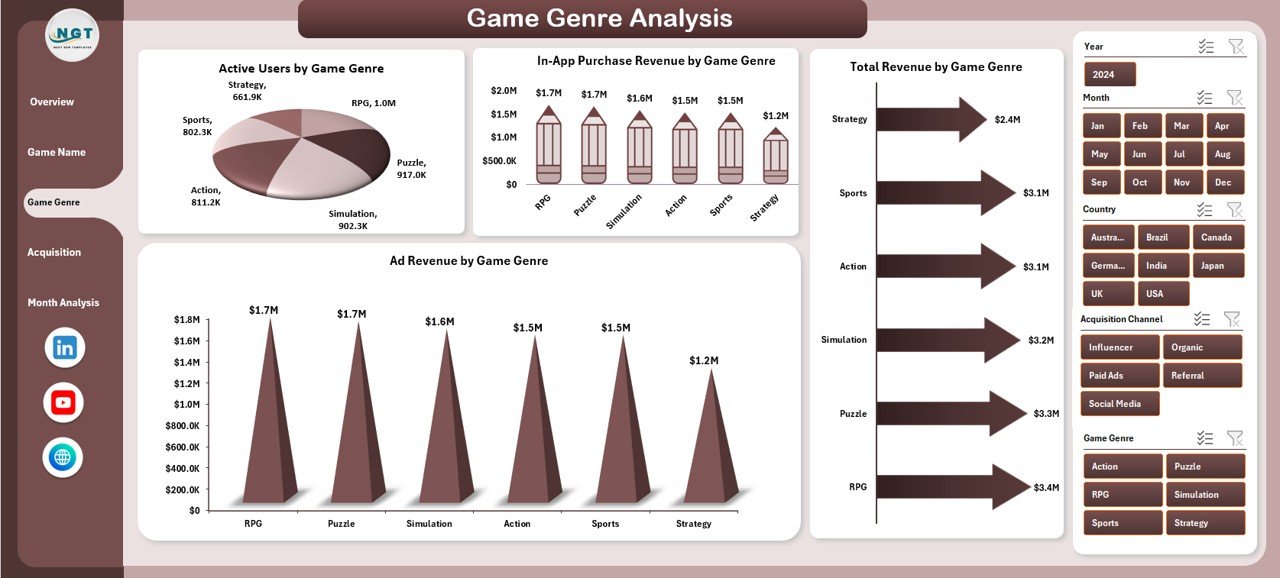
The Game Genre Analysis page evaluates performance across different game genres.
Key Elements of Game Genre Analysis
-
Right-side slicer for genre selection
-
Four genre-based charts
Charts Included in Game Genre Analysis
-
Active Users by Game Genre
This chart shows player distribution across genres. -
In-App Purchases Revenue by Game Genre
This visual highlights monetization trends by genre. -
Total Revenue by Game Genre
This chart combines ad and in-app revenue for comparison. -
Ad Revenue by Game Genre
This metric reveals ad performance by genre.
Therefore, teams can focus development and marketing on high-performing genres.
4. Acquisition Channel Analysis: Which Channels Bring Quality Users?
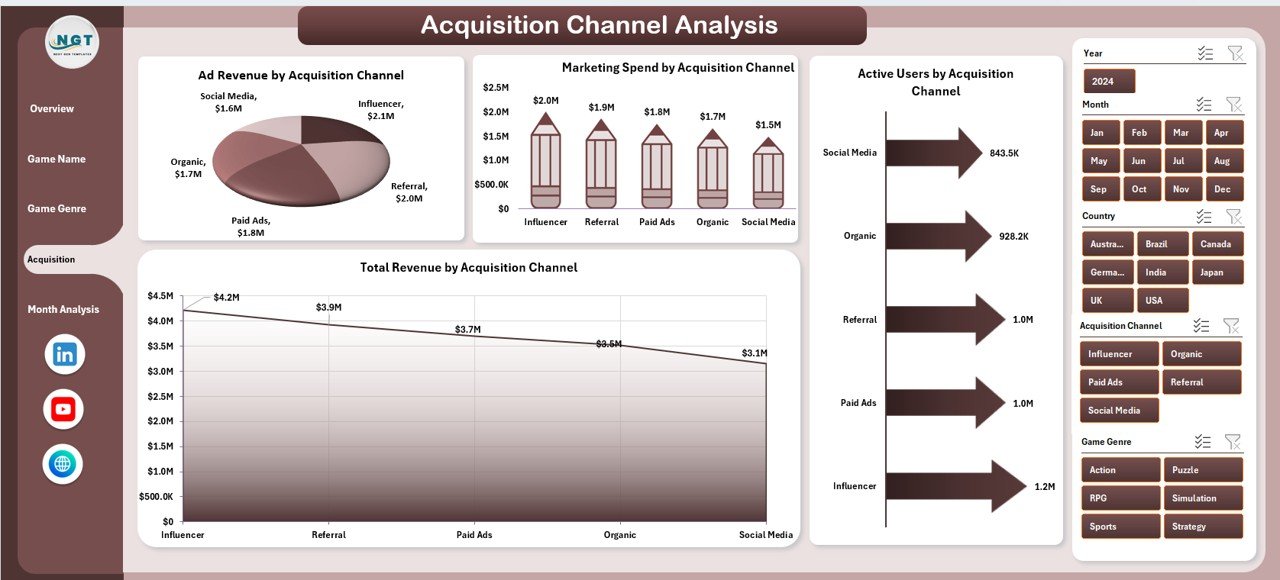
The Acquisition Channel Analysis page focuses on user acquisition performance.
Key Features of Acquisition Channel Analysis
-
Right-side slicer for channel filtering
-
Four acquisition-focused charts
Charts Included in Acquisition Channel Analysis
-
Ad Revenue by Acquisition Channel
This chart compares revenue generated through different channels. -
Marketing Spend by Acquisition Channel
This visual helps track budget efficiency. -
Active Users by Acquisition Channel
This metric shows which channels attract more users. -
Total Revenue by Acquisition Channel
This chart evaluates overall channel effectiveness.
As a result, marketing teams can optimize campaigns and reduce wasted spend.
5. Month Analysis: How Does Performance Change Over Time?
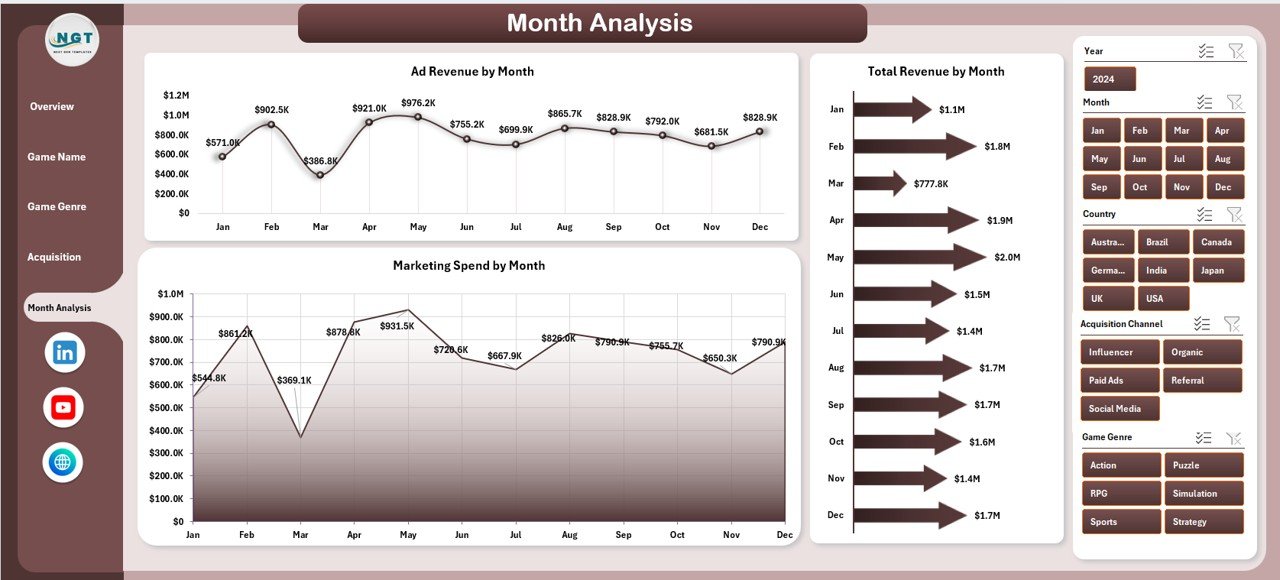
The Month Analysis page helps track performance trends across time.
Key Elements of Month Analysis
-
Right-side slicer for month selection
-
Three time-based charts
Charts Included in Month Analysis
-
Ad Revenue by Month
This chart tracks advertising revenue trends. -
Total Revenue by Month
This visual shows overall growth or decline. -
Marketing Spend by Month
This chart highlights seasonal spending patterns.
Because trends become visible, teams can plan future strategies more effectively.
Support Sheets in the Dashboard
Data Sheet
The Data Sheet acts as the backbone of the dashboard. It stores raw transactional and aggregated data used for analysis. Therefore, accurate data entry remains crucial.
Key Metrics Tracked in a Mobile Gaming Dashboard in Excel
Click to Purchases Mobile Gaming Dashboard in Excel
A Mobile Gaming Dashboard in Excel typically tracks the following metrics:
-
Total Revenue
-
Ad Revenue
-
In-App Purchases Revenue
-
Active Users
-
Average Session Duration
-
Marketing Spend
-
Revenue by Platform
-
Revenue by Country
-
Revenue by Game Name
-
Revenue by Genre
-
Revenue by Acquisition Channel
Together, these metrics provide a complete view of gaming performance.
Advantages of Mobile Gaming Dashboard in Excel
Using a Mobile Gaming Dashboard in Excel offers several clear advantages.
Centralized Performance Tracking
All critical gaming metrics stay in one place. As a result, teams avoid confusion and duplication.
Easy Customization
Excel allows users to modify charts, KPIs, and layouts without technical expertise.
Cost-Effective Solution
Unlike expensive BI tools, Excel dashboards require no additional software investment.
Faster Decision-Making
Interactive slicers and visuals provide instant insights. Therefore, decisions become quicker and more accurate.
Improved Collaboration
Because Excel files remain easy to share, teams collaborate more effectively.
Best Practices for the Mobile Gaming Dashboard in Excel
To get the best results, follow these best practices.
Keep Data Clean and Structured
Always validate data before updating the dashboard. Clean data ensures accurate insights.
Use Consistent Naming Conventions
Maintain consistent game names, genres, and channels to avoid reporting errors.
Limit the Number of KPIs per Page
Too many metrics create confusion. Therefore, focus on the most important KPIs.
Update Data Regularly
Frequent updates keep insights relevant and actionable.
Protect Formula Cells
Lock critical formulas to prevent accidental changes.
Who Can Benefit from a Mobile Gaming Dashboard in Excel?
This dashboard suits multiple roles within the gaming ecosystem:
-
Mobile Game Developers
-
Game Publishers
-
Marketing Teams
-
Product Managers
-
Business Analysts
-
Studio Owners
Each role gains clarity and confidence through structured insights.
Conclusion: Why Should You Use a Mobile Gaming Dashboard in Excel?
A Mobile Gaming Dashboard in Excel transforms raw gaming data into actionable insights. It helps teams track revenue, user behavior, marketing efficiency, and growth trends in one interactive file.
Because it remains flexible, cost-effective, and easy to use, this dashboard suits both small studios and large publishers. Therefore, if you want better visibility, faster decisions, and improved performance, this dashboard becomes an essential tool.
Frequently Asked Questions (FAQs)
What is a Mobile Gaming Dashboard in Excel used for?
A Mobile Gaming Dashboard in Excel tracks revenue, users, marketing spend, and performance trends in one interactive view.
Can beginners use a Mobile Gaming Dashboard in Excel?
Yes, beginners can use it easily because slicers and visuals simplify analysis.
How often should the dashboard be updated?
You should update the dashboard weekly or monthly, depending on business needs.
Can I customize this dashboard for my games?
Yes, Excel allows full customization of charts, KPIs, and layouts.
Is Excel suitable for large gaming datasets?
Yes, Excel handles large datasets efficiently when structured properly.
Does this dashboard support decision-making?
Yes, it provides clear insights that support strategic and operational decisions.
Visit our YouTube channel to learn step-by-step video tutorials