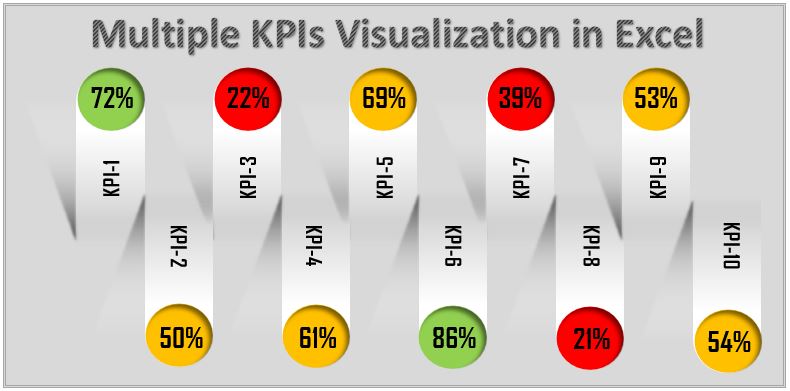
The biotechnology industry is one of the most data-driven fields, where tracking and improving performance metrics is essential. A well-organized
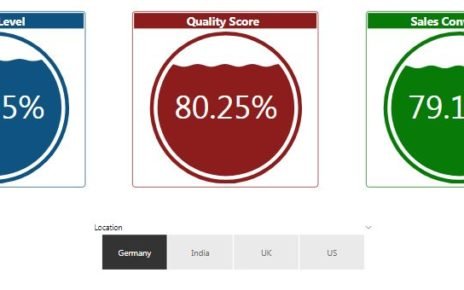
Liquid Fill Gauge is very beautiful Custom visual for Power BI. You can use this chart to display metrics like
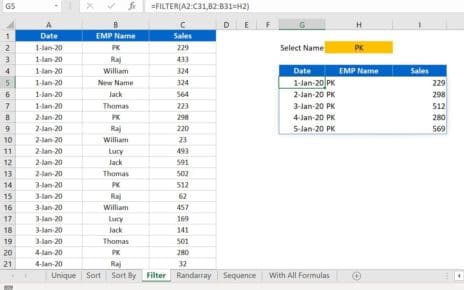
In this article, we have explained 6 Dynamic Array function in Microsoft Excel. Dynamic Array functions are available with Office