In the fast-moving digital age, organizations need more than just data—they need actionable insights. This is where a Digital Transformation KPI Dashboard in Power BI becomes essential. A well-designed dashboard allows business leaders to track their digital progress, monitor key performance indicators (KPIs), and make informed decisions in real-time.
In this article, we will explore everything you need to know about building and using a Digital Transformation KPI Dashboard in Power BI. We’ll also highlight the advantages, best practices, and answer frequently asked questions.
Click to Purchases Digital Transformation KPI Dashboard in Power BI
What is a Digital Transformation KPI Dashboard?
A Digital Transformation KPI Dashboard is a visual reporting tool built in Power BI that tracks metrics related to digital initiatives. These KPIs measure how well your organization is progressing in adopting digital technologies, automating processes, and improving customer experience.
These dashboards centralize performance data and make it easy to analyze trends, spot bottlenecks, and align efforts with strategic goals.
Key Features of the Power BI Digital Transformation Dashboard
The Digital Transformation KPI Dashboard in Power BI includes three main pages:
Summary Page
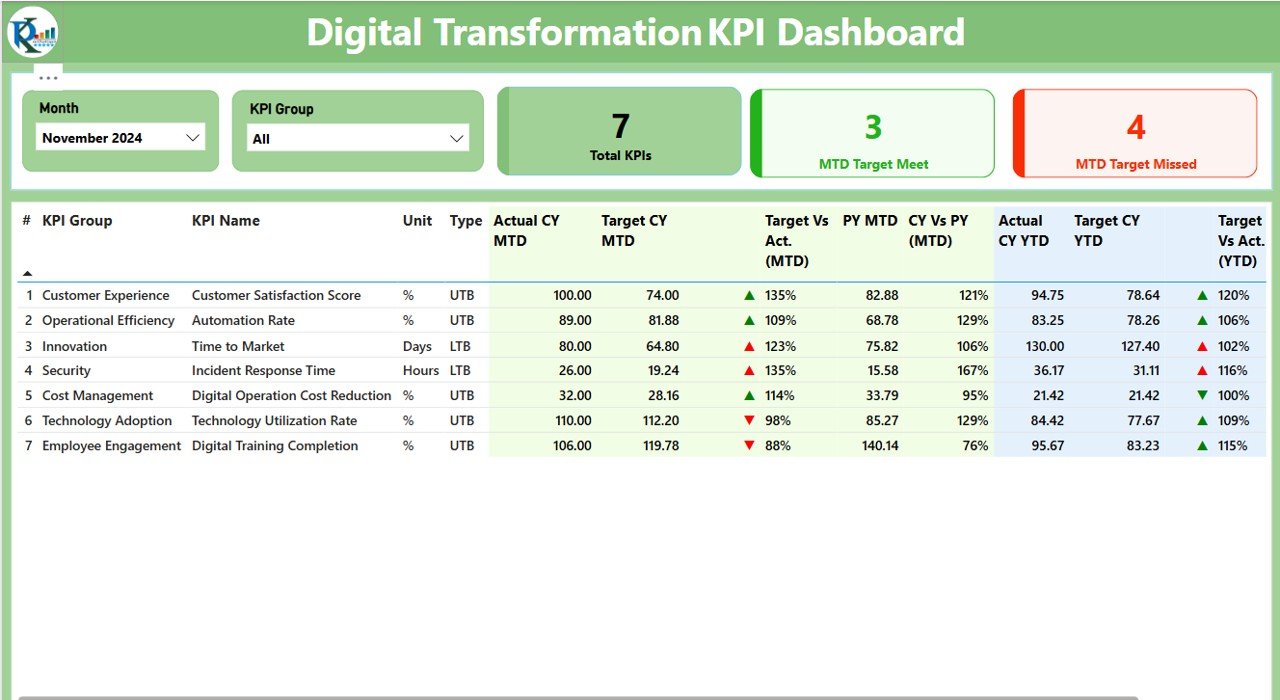
This is the core page of the dashboard. Here’s what you’ll find:
- Month and KPI Group Slicer: Filter the report by specific months or KPI groups.
Three Highlight Cards:
- Total KPIs Count
- MTD (Month-to-Date) Target Met Count
- MTD Target Missed Count
Detailed KPI Table:
- KPI Number: Unique identifier for each KPI
- KPI Group: Category (e.g., Customer, Process, Financial)
- KPI Name: Descriptive name of the KPI
- Unit: Measurement unit (e.g., %, Hours, Count)
- Type: LTB (Lower The Better) or UTB (Upper The Better)
- Actual CY MTD & Target CY MTD: Current year’s actual and target MTD values
- MTD Icon: ▼ (Red) or ▲ (Green) for visual cue
- Target vs Actual (MTD %)
- PY MTD: Previous year’s MTD value
- CY vs PY (MTD %)
- Actual CY YTD & Target CY YTD: Year-to-date values
- YTD Icon: ▼ or ▲ for performance indicator
- Target vs Actual (YTD %)
- PY YTD & CY vs PY (YTD %)
KPI Trend Page
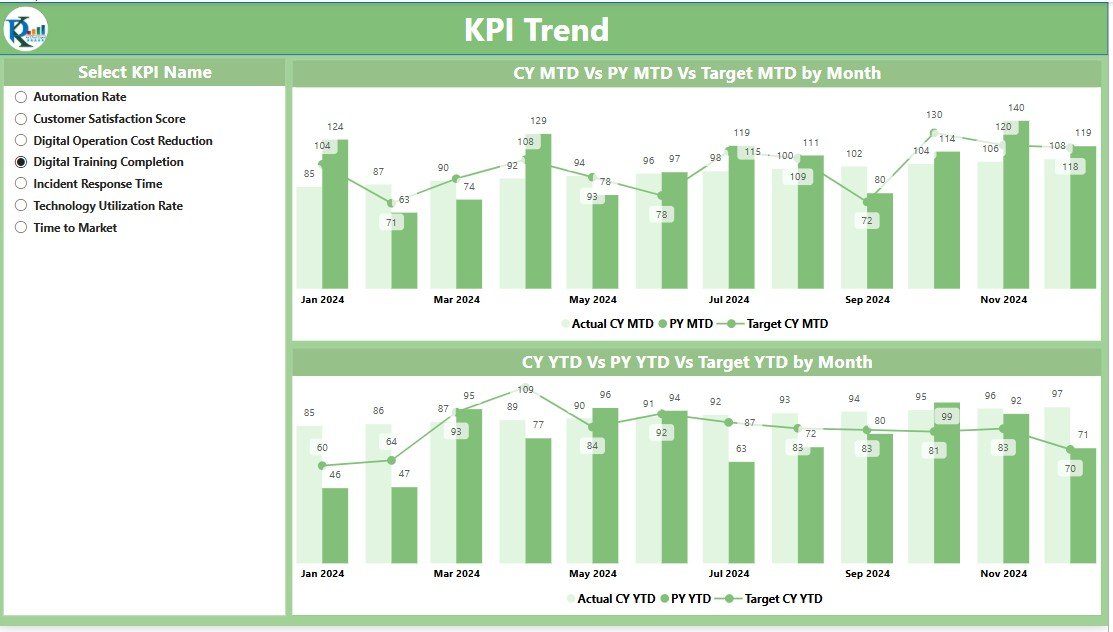
This page provides visual insights using two combo charts:
- MTD Chart: Compares CY Actual, PY Actual, and Target
- YTD Chart: Compares CY Actual, PY Actual, and Target
Users can filter these charts using the KPI slicer on the left panel.
Click to Purchases Digital Transformation KPI Dashboard in Power BI
KPI Definition Page
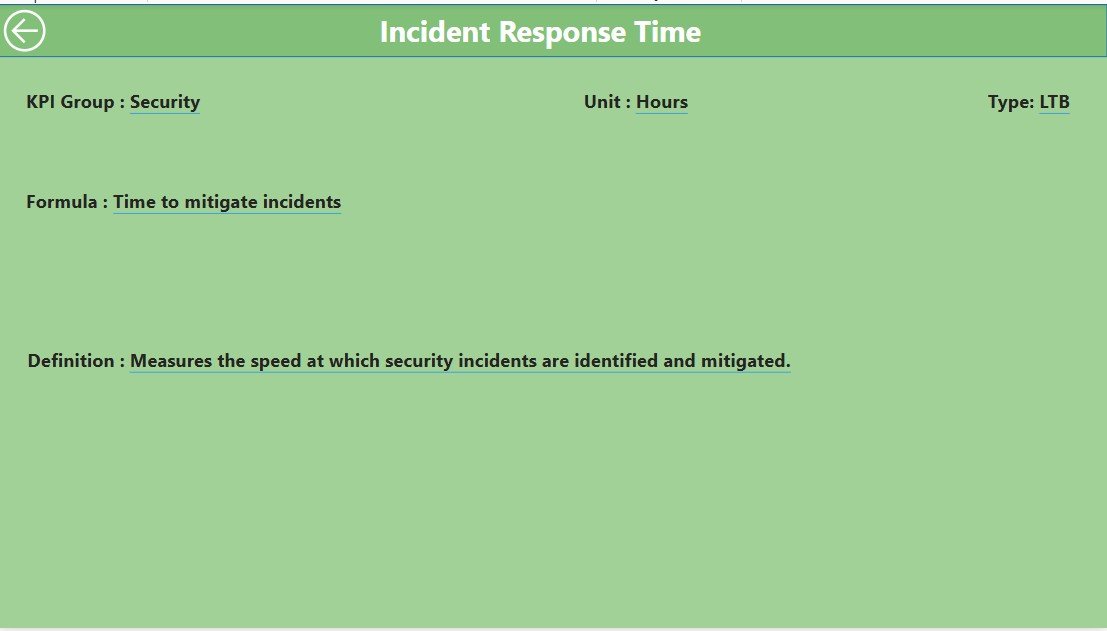
A hidden drill-through page. Clicking on a KPI from the summary page allows you to:
- View the formula used
- Read a short definition of the KPI
To return to the main page, simply use the “Back” button in the top-left corner.
How is the Data Managed?
Click to Purchases Digital Transformation KPI Dashboard in Power BI
The data source is an Excel file with three worksheets:
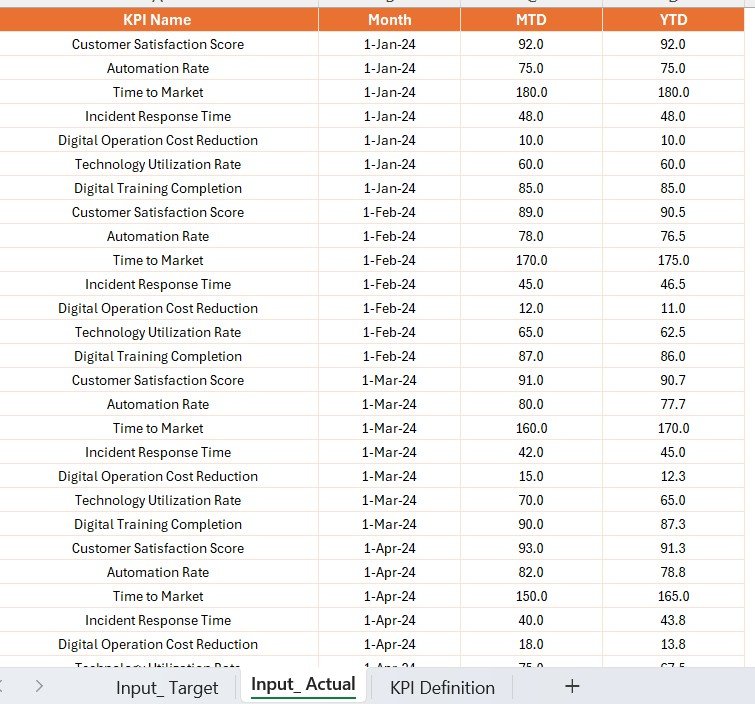
1. Input_Actual Sheet Tab

Enter actual performance data:
- KPI Name
- Month (use first day of the month)
- MTD values
- YTD values
2. Input_Target Sheet Tab
Enter your target performance numbers:
- KPI Name
- Month
- MTD targets
- YTD targets
3. KPI Definition Sheet Tab
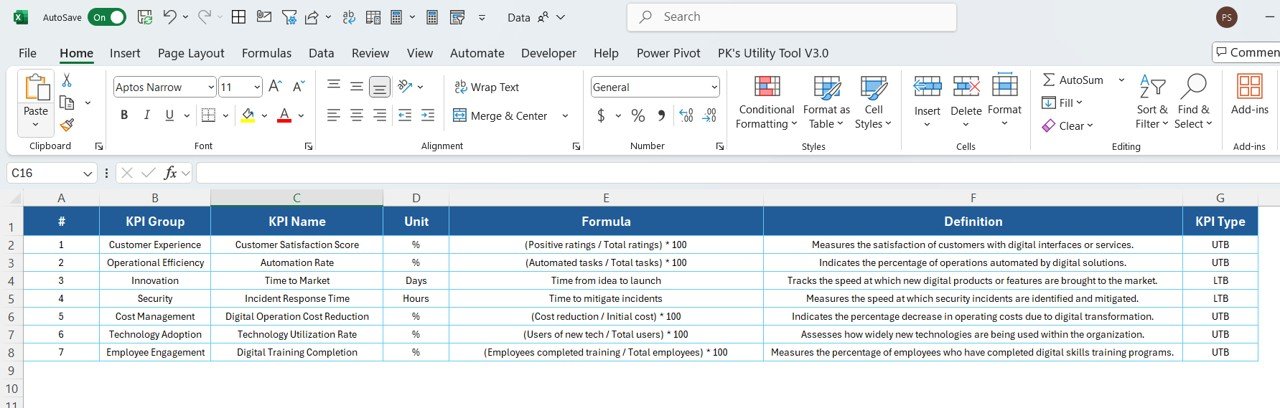
Define each KPI clearly:
- KPI Number
- KPI Group
- KPI Name
- Unit
- Formula
- Definition
- Type (LTB or UTB)
This structured data input ensures consistency, reliability, and easy integration with Power BI.
Click to Purchases Digital Transformation KPI Dashboard in Power BI
Why Should You Use a Digital Transformation KPI Dashboard?
Digital transformation is not a one-time event. It requires continuous tracking and refinement. A KPI dashboard empowers teams by:
- Providing real-time visibility into transformation initiatives
- Encouraging data-driven decisions
- Helping leaders measure ROI of digital investments
- Spotting performance gaps early
Advantages of Digital Transformation KPI Dashboard
🎯 Focused Visibility
You see what matters the most—on one screen. No need to dig through complex reports.
⏰ Faster Decision Making
Real-time insights help decision-makers respond faster to digital opportunities and threats.
🌀 Continuous Improvement
Track performance over time and adjust strategies to keep transformation efforts on course.
🌍 Alignment with Business Goals
Ensure everyone is working toward common objectives using clear, trackable metrics.
Best Practices for the Digital Transformation KPI Dashboard
To get the most out of your dashboard, follow these best practices:
1. Choose the Right KPIs
Not all KPIs matter. Pick those that align with your digital transformation goals.
2. Use Consistent Units and Formats
Maintain uniformity to avoid confusion when comparing metrics.
3. Visualize with Purpose
Use icons, charts, and colors strategically. Red/Green arrows are great for status indicators.
4. Simplify Navigation
Add slicers and buttons to make the dashboard user-friendly and intuitive.
5. Automate Data Refresh
Connect Power BI to your Excel sheets and schedule regular updates.
6. Ensure Data Accuracy
Incorrect numbers can mislead decisions. Double-check your Excel entries.
7. Update KPI Definitions Periodically
Digital priorities change. Make sure your KPI definitions evolve too.
Real-Life Use Cases
🚀 Tech Startups
Monitor software deployment cycles, customer onboarding rates, and automation goals.
💼 Enterprises
Track system migration progress, cloud adoption metrics, and digital upskilling.
🏦 Banks & Financial Institutions
Measure online transaction volumes, cybersecurity response time, and mobile app uptime.
Monthly and Yearly Reporting Made Simple
Thanks to the MTD and YTD comparison features:
- Managers can review performance month-by-month
- Executives get a yearly overview at a glance
No manual calculations, just clear visual insights with a few clicks.
Conclusion
The Digital Transformation KPI Dashboard in Power BI is more than just a reporting tool—it’s your digital command center. It empowers organizations to track what matters, visualize progress, and act fast.
By using Excel as the backend and Power BI for visualization, you get flexibility, simplicity, and power all in one. Start small, iterate often, and make data your superpower!
Frequently Asked Questions
👀 What types of KPIs are best for digital transformation?
Focus on KPIs related to digital adoption, automation, customer experience, and innovation speed.
⏳ How often should the dashboard be updated?
Ideally, update it weekly or monthly. Use Power BI’s data refresh to automate the process.
🚀 Can I customize the KPI dashboard for different departments?
Yes. Use slicers and filters in Power BI to tailor views for each team (e.g., IT, HR, Finance).
💼 Is Power BI suitable for large enterprises?
Absolutely. Power BI scales easily, connects to various data sources, and is secure for enterprise use.
✏️ What skills are needed to maintain this dashboard?
Basic Excel knowledge and Power BI familiarity are enough. Most tasks are point-and-click operations.
Click to Purchases Digital Transformation KPI Dashboard in Power BI
Visit our YouTube channel to learn step-by-step video tutorials