NFT marketplaces have transformed the digital economy. Artists, collectors, developers, and investors now trade digital assets across global platforms every second. However, as transaction volumes grow and competition increases, managing marketplace performance becomes more complex.
That is exactly why an NFT Marketplaces KPI Dashboard in Excel becomes a powerful performance monitoring solution.
Instead of tracking sales, users, and revenue across multiple reports, this ready-to-use dashboard brings everything into one structured Excel file. As a result, marketplace owners and analysts gain clear visibility into performance, trends, and gaps.
In this detailed article, you will learn what an NFT Marketplaces KPI Dashboard in Excel is, how it works, its worksheet structure, advantages, best practices, and frequently asked questions. By the end, you will clearly understand how this dashboard supports smarter decisions in the fast-moving NFT ecosystem.
Click to Purchases NFT Marketplaces KPI Dashboard in Excel
What Is an NFT Marketplaces KPI Dashboard in Excel?
An NFT Marketplaces KPI Dashboard in Excel is a centralized reporting tool designed to track key performance indicators related to NFT marketplace operations.
Instead of relying on scattered spreadsheets or manual calculations, this dashboard consolidates all KPI data into a single Excel workbook. Consequently, users can analyze performance using MTD and YTD metrics, target comparisons, and historical trends.
Moreover, because the dashboard runs entirely in Excel, it remains easy to use, flexible, and customizable—without requiring advanced analytics tools.
Why Do NFT Marketplaces Need a KPI Dashboard?
NFT marketplaces generate large volumes of data every month. Transactions, active users, minting activity, and revenue metrics constantly change. Without a structured dashboard, teams often struggle to maintain clarity.
Common challenges include:
-
Lack of performance visibility
-
Manual and time-consuming reporting
-
Difficulty tracking targets
-
Poor historical comparison
-
Delayed strategic decisions
Therefore, a KPI dashboard becomes essential.
With an NFT Marketplaces KPI Dashboard in Excel, teams gain instant insights and maintain control over marketplace performance.
How Does the NFT Marketplaces KPI Dashboard in Excel Work?
The dashboard separates data input from analysis. Users enter actual, target, and previous year values in dedicated input sheets. Then, the dashboard automatically calculates KPI performance and updates visuals.
Additionally, dropdowns, conditional formatting, and trend charts simplify analysis. Because of this design, users can monitor performance without writing complex formulas repeatedly.
Most importantly, the dashboard supports both MTD (Month-to-Date) and YTD (Year-to-Date) tracking, which ensures short-term and long-term performance monitoring.
What Worksheets Are Included in the NFT Marketplaces KPI Dashboard?
This dashboard contains seven well-structured worksheets, each designed for a specific purpose.
What Is the Home Sheet Used For?
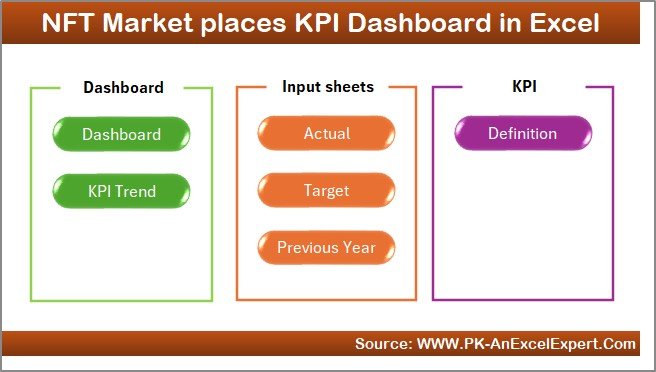
The Home Sheet acts as the navigation center of the dashboard.
Key Features of the Home Sheet
-
Serves as an index page
-
Contains six navigation buttons
-
Enables quick access to all key sheets
As a result, users move through the dashboard efficiently without confusion.
Click to Purchases NFT Marketplaces KPI Dashboard in Excel
What Is the Dashboard Sheet and Why Is It Important?
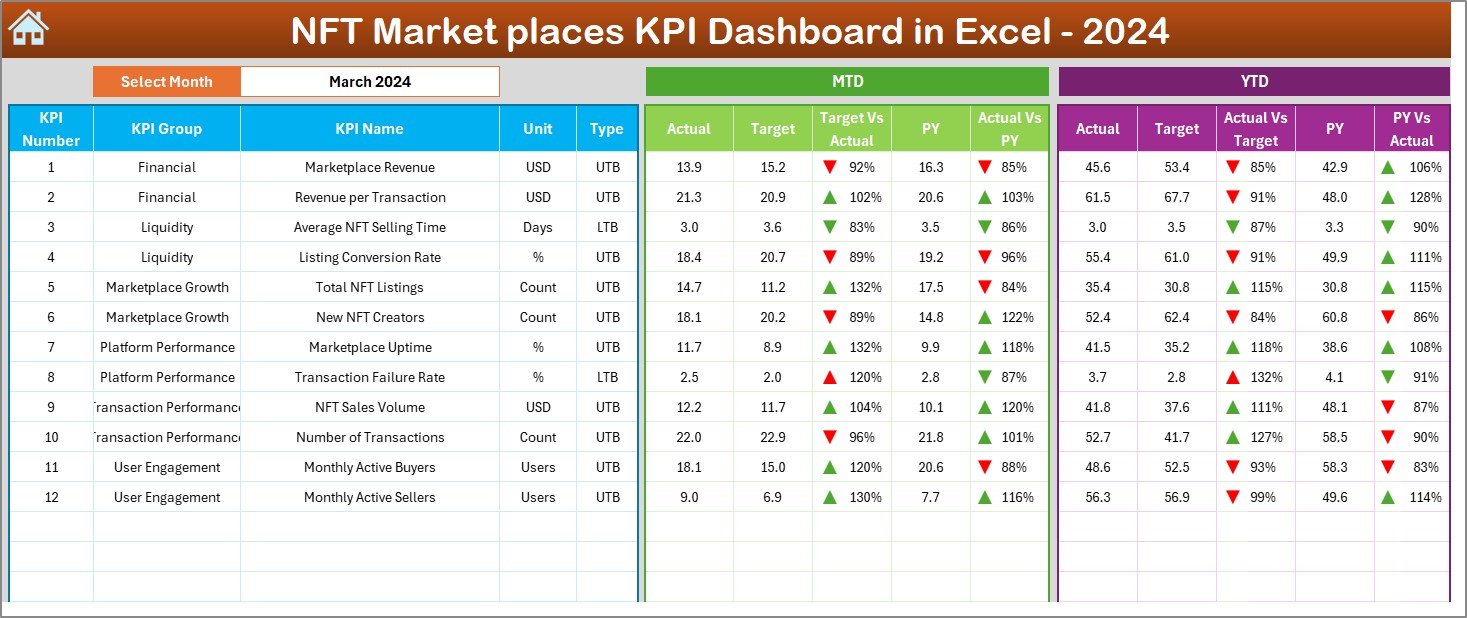
The Dashboard Sheet serves as the main analytical page.
How Does Month Selection Work?
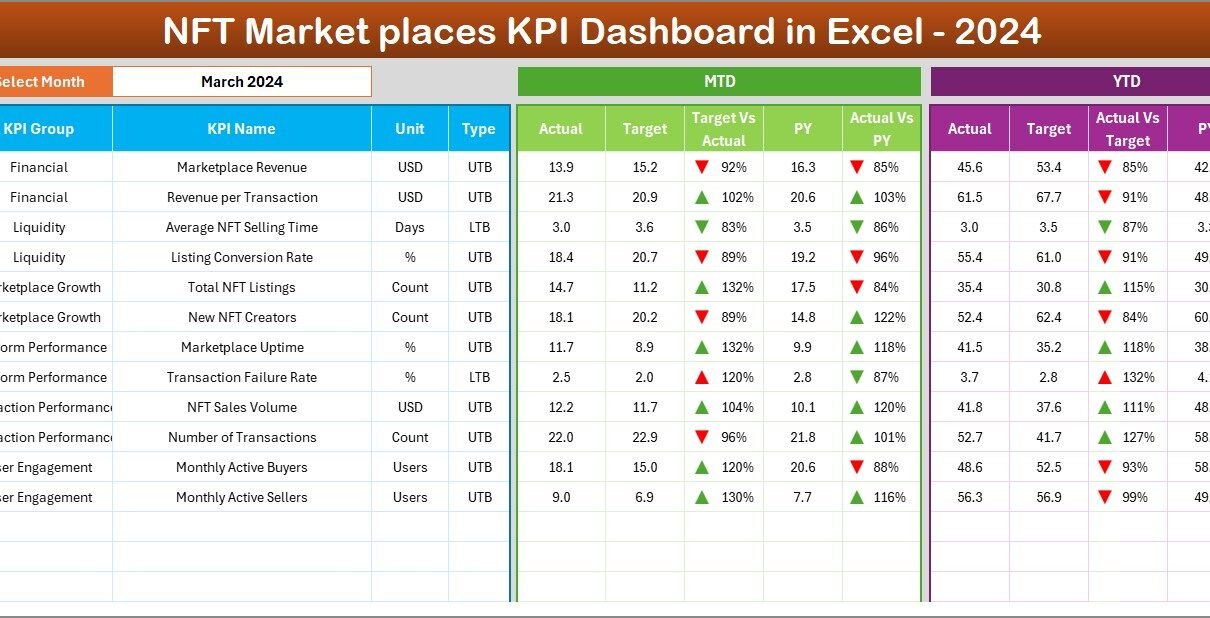
On cell D3, users can select a reporting month from a dropdown list. Once selected, all KPI values update automatically.
This feature allows focused monthly analysis.
What KPI Information Is Displayed on the Dashboard Sheet?
The dashboard displays both MTD and YTD performance metrics, including:
MTD Metrics
-
Actual
-
Target
-
Previous Year
-
Target vs Actual (%)
-
Previous Year vs Actual (%)
YTD Metrics
-
Actual
-
Target
-
Previous Year
-
Target vs Actual (%)
-
Previous Year vs Actual (%)
How Does Conditional Formatting Improve Visibility?
The dashboard uses up and down arrows with colors:
-
Green ▲ shows positive performance
-
Red ▼ shows negative performance
Because of this visual clarity, users can instantly identify underperforming KPIs.
What Is the KPI Trend Sheet Used For?
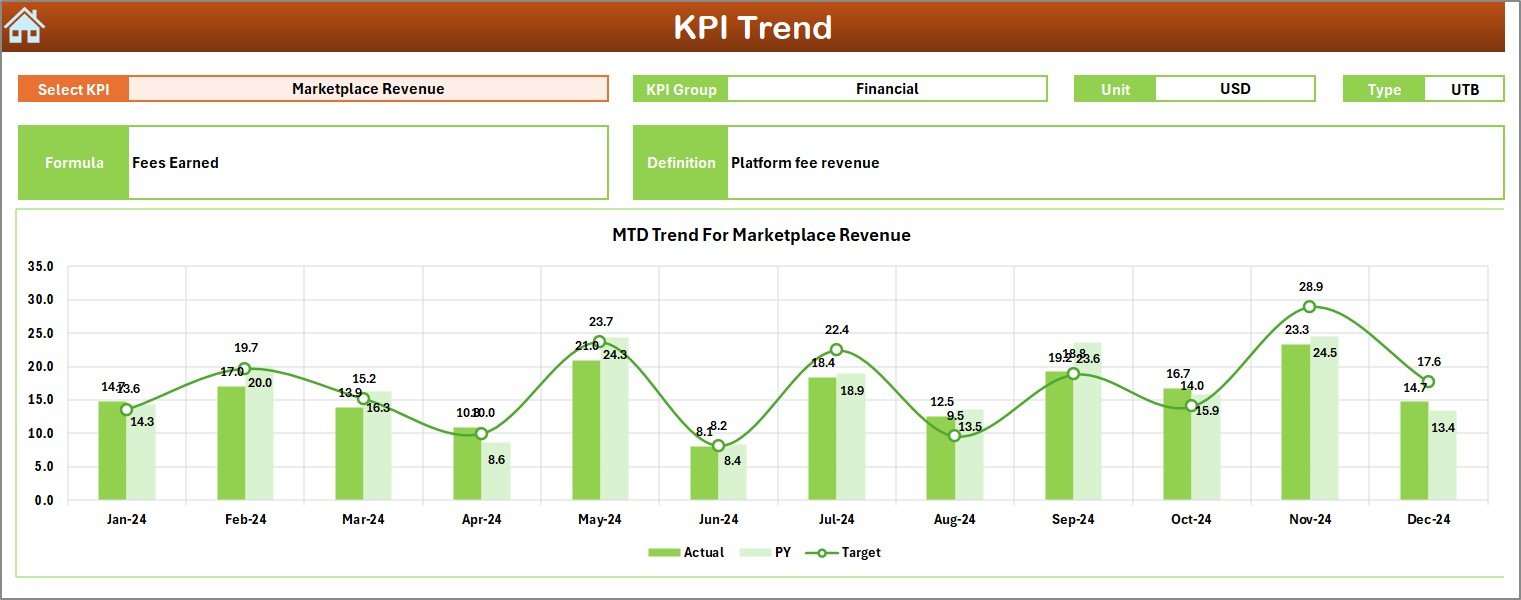
The KPI Trend Sheet enables deeper KPI-level analysis.
How Do Users Select a KPI?
On cell C3, users select a KPI name from a dropdown. All related data updates automatically.
What KPI Details Are Displayed?
For the selected KPI, the dashboard shows:
-
KPI Group
-
Unit of Measurement
-
KPI Type (Lower the Better or Upper the Better)
-
KPI Formula
-
KPI Definition
This context helps users interpret performance correctly.
What Charts Are Included on the KPI Trend Sheet?
The dashboard displays two trend charts:
-
MTD Trend Chart
-
Actual
-
Target
-
Previous Year
-
-
YTD Trend Chart
-
Actual
-
Target
-
Previous Year
-
These charts highlight patterns, growth, and seasonal behavior.
Click to Purchases NFT Marketplaces KPI Dashboard in Excel
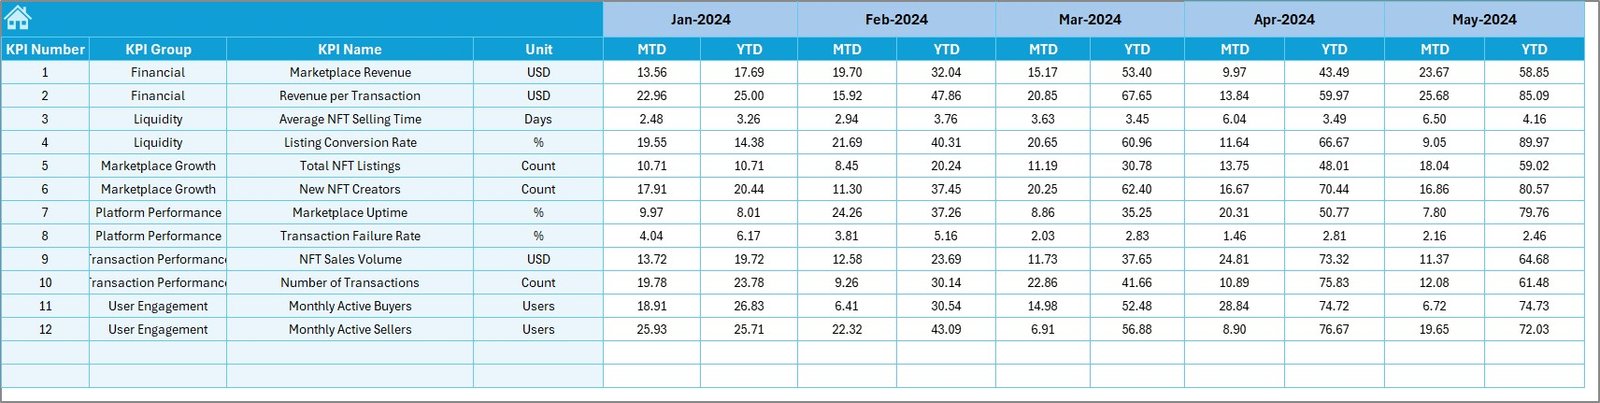
What Is the Actual Numbers Input Sheet?
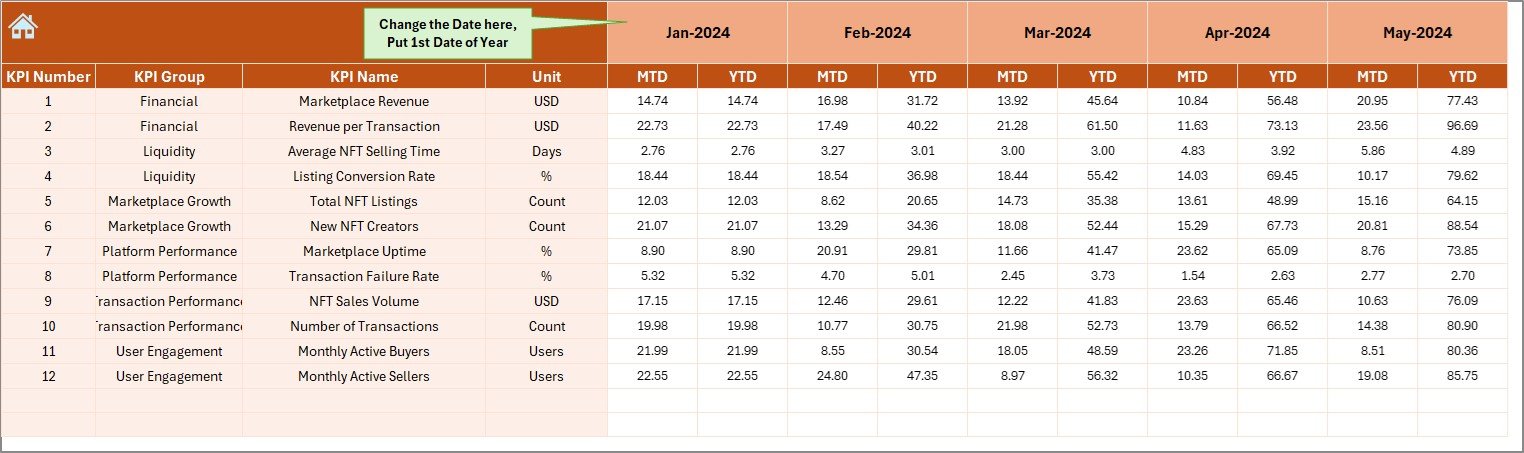
The Actual Numbers Input Sheet stores real marketplace performance data.
How Is the Month Configured?
On cell E1, users enter the first month of the year. After that, users can switch months easily.
What Data Must Be Entered?
Users must enter:
-
KPI Name
-
MTD Actual Value
-
YTD Actual Value
Accurate data ensures reliable analysis.
What Is the Target Sheet Used For?
The Target Sheet stores planned KPI values.
What Information Is Required?
For each KPI and month, users enter:
-
MTD Target
-
YTD Target
Because targets define success criteria, this sheet is critical.
Click to Purchases NFT Marketplaces KPI Dashboard in Excel
What Is the Previous Year Number Sheet?
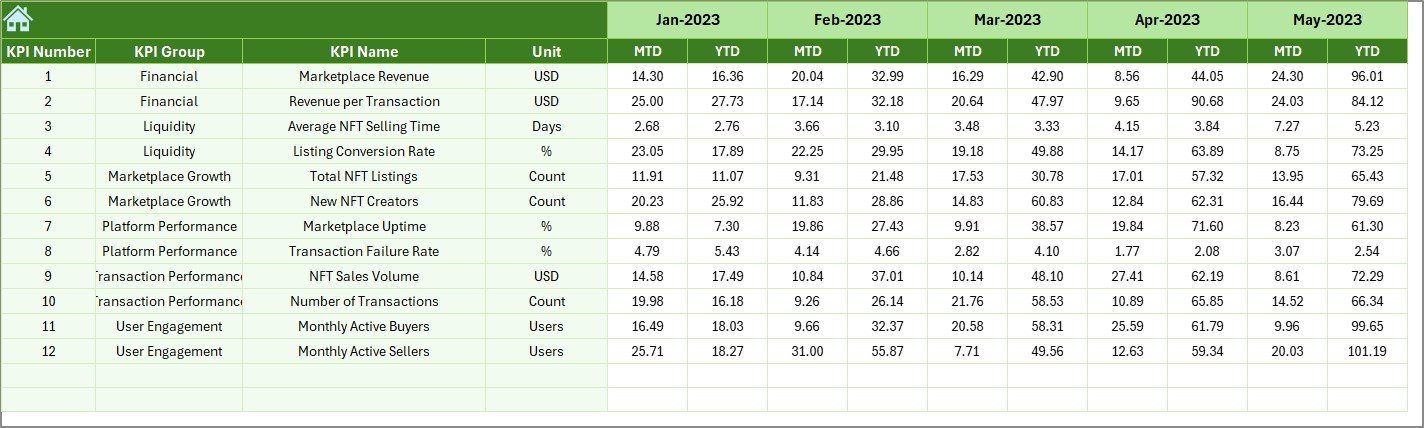
The Previous Year Number Sheet enables historical comparison.
Why Is Previous Year Data Important?
Previous year data helps teams:
-
Measure marketplace growth
-
Identify performance trends
-
Evaluate strategic improvements
Users enter data in the same structure as current year values.
What Is the KPI Definition Sheet Used For?
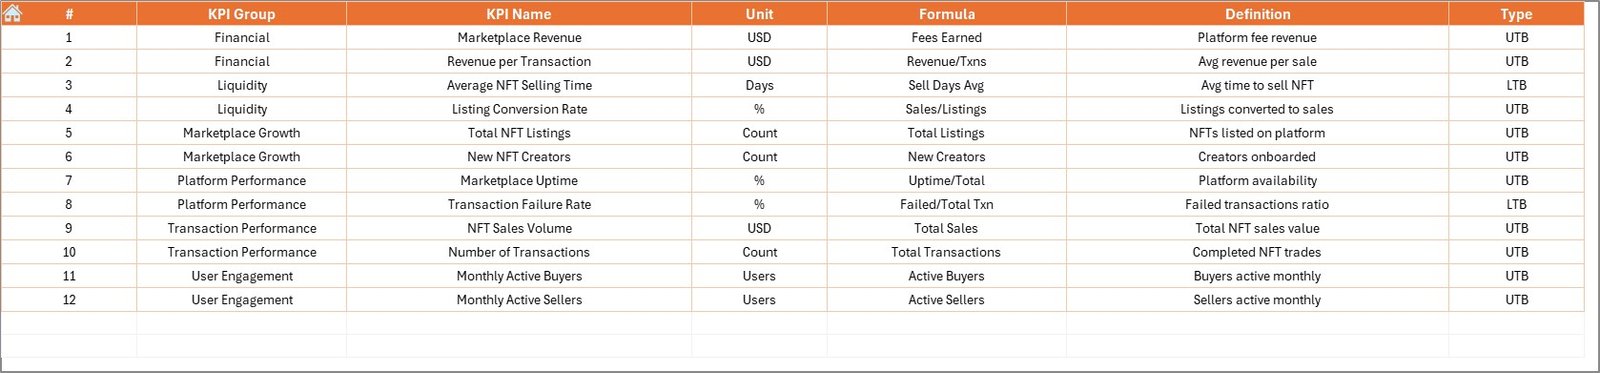
The KPI Definition Sheet defines each KPI clearly.
What Information Does This Sheet Contain?
-
KPI Name
-
KPI Group
-
Unit
-
Formula
-
KPI Definition
This sheet ensures consistency and clarity across reporting.
Click to Purchases NFT Marketplaces KPI Dashboard in Excel
Advantages of NFT Marketplaces KPI Dashboard in Excel
Using this dashboard provides several key benefits.
1. Centralized Performance Monitoring
All NFT marketplace KPIs remain in one place.
2. Faster Decision-Making
Visual indicators highlight issues instantly.
3. Improved Target Tracking
MTD and YTD analysis ensures accountability.
4. Historical Performance Comparison
Previous year analysis reveals long-term trends.
5. Easy Customization
Excel allows flexible KPI additions and changes.
6. No Advanced Tools Required
Teams can use the dashboard without complex software.
Best Practices for NFT Marketplaces KPI Dashboard in Excel
To maximize value, follow these best practices.
1. Define KPIs Clearly
Avoid ambiguous KPI names or formulas.
2. Maintain Consistent Units
Use the same units across periods.
3. Update Data Regularly
Monthly updates ensure accuracy.
4. Validate Inputs Before Review
Always double-check actual and target values.
5. Use Trend Charts for Insights
Analyze patterns, not just current numbers.
6. Classify KPI Types Correctly
Correct UTB and LTB classification improves interpretation.
Click to Purchases NFT Marketplaces KPI Dashboard in Excel
How Does This Dashboard Support NFT Marketplace Growth?
This dashboard helps teams:
-
Track marketplace activity
-
Monitor revenue performance
-
Identify user engagement trends
-
Improve operational planning
-
Align targets with actual outcomes
As a result, NFT marketplaces operate with greater clarity and control.
Click to Purchases NFT Marketplaces KPI Dashboard in Excel
Conclusion: Why Should You Use an NFT Marketplaces KPI Dashboard in Excel?
An NFT Marketplaces KPI Dashboard in Excel converts raw marketplace data into actionable insights. Instead of reacting late, teams gain proactive control over performance.
Because it combines structured data input, dynamic visuals, and KPI best practices, this dashboard becomes an essential analytics tool for NFT platforms.
Ultimately, it supports sustainable growth, smarter decisions, and competitive advantage.
Frequently Asked Questions (FAQs)
What is an NFT Marketplaces KPI Dashboard in Excel?
It is a ready-to-use Excel dashboard that tracks NFT marketplace performance KPIs.
Who should use this dashboard?
Marketplace owners, analysts, product managers, and founders.
Does the dashboard support MTD and YTD analysis?
Yes, it includes both MTD and YTD tracking.
Can I add new KPIs?
Yes, the dashboard structure supports easy KPI expansion.
Is Excel enough for NFT analytics?
Yes, Excel provides flexibility and accessibility for KPI tracking.
How often should data be updated?
Monthly updates provide the best results.
Click to Purchases NFT Marketplaces KPI Dashboard in Excel
Visit our YouTube channel to learn step-by-step video tutorials