In today’s world, where health awareness is rising and personalized diets are becoming essential, professionals in nutrition and dietetics need reliable tools to track, analyze, and present data. Managing client consultations, diet plans, satisfaction ratings, and profit margins manually can take hours and lead to confusion.
That’s where the Nutrition & Dietetics Dashboard in Excel comes in — a ready-to-use, fully interactive analytics template designed to help nutritionists, dieticians, and clinic managers visualize performance metrics and make smart decisions in real time.
In this article, we’ll explore the structure, features, advantages, and best practices for using this Excel dashboard effectively.
What Is a Nutrition & Dietetics Dashboard in Excel?
Click to Purchases Nutrition & Dietetics Dashboard in Excel
A Nutrition & Dietetics Dashboard in Excel is an interactive reporting tool built to monitor and analyze various performance indicators related to nutrition and diet programs. It consolidates client data, financial performance, consultation metrics, and satisfaction scores into a single, user-friendly interface.
Unlike static spreadsheets, this dashboard uses Excel’s pivot tables, slicers, and charts to offer dynamic analysis. You can switch between pages, filter results, and track monthly, regional, or plan-based performance — all without writing a single formula.
It is ideal for:
-
Nutritionists and dieticians managing multiple clients or clinics.
-
Wellness centers tracking consultation performance and profitability.
-
Health startups and fitness organizations analyzing diet plan outcomes.
Key Features of the Nutrition & Dietetics Dashboard in Excel
The Nutrition & Dietetics Dashboard comes with an organized structure and five dedicated analysis pages, each focusing on a specific dimension of your practice.
🔹 Page Navigator
Located on the left side, the Page Navigator allows you to move seamlessly between different analytical pages. This ensures a smooth user experience, saving time and helping users focus on insights rather than navigation.
Structure of the Dashboard
The dashboard file includes five main analytical pages and one supporting data sheet. Each page delivers detailed insights through charts, KPI cards, and slicers for interactive analysis.
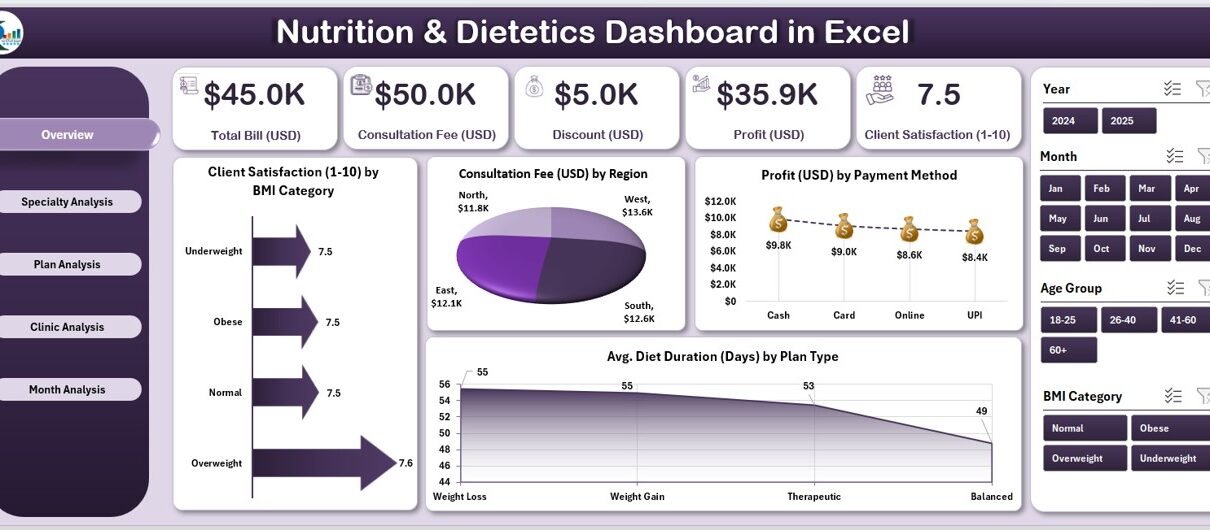
1️⃣ Overview Page

This is the main summary page of the dashboard. It offers a quick snapshot of the most crucial performance indicators through five KPI cards and four analytical charts.
Charts displayed:
-
Client Satisfaction (1-10) by BMI Category
-
Consultation Fee (USD) by Region
-
Profit (USD) by Payment Method
-
Average Diet Duration (Days) by Plan Type
This page helps you quickly identify how well your business or practice is performing across regions, payment types, and client categories.
You can also monitor the average diet duration to assess whether your plans are realistic and result-oriented.
2️⃣ Specialty Analysis Page

The Specialty Analysis Page focuses on understanding how different specializations perform in terms of consultation fees, billing, and profits.
Charts displayed:
-
Consultation Fee (USD) by Specialty
-
Total Bill (USD) by Specialty
-
Profit (USD) by Specialty
This helps managers identify which specialties are most profitable or require optimization. For example, a dietician may find that sports nutrition generates higher consultation fees compared to general weight management.
3️⃣ Plan Analysis Page

This section compares performance across different plan types (e.g., detox plans, weight loss programs, diabetic plans).
Charts displayed:
-
Consultation Fee (USD) by Plan Type
-
Total Bill (USD) by Plan Type
-
Profit (USD) by Plan Type
Click to Purchases Nutrition & Dietetics Dashboard in Excel
You can use these insights to refine pricing, duration, and offerings for each plan, ensuring better profitability and client satisfaction.
4️⃣ Clinic Analysis Page

If you manage multiple clinics or branches, the Clinic Analysis Page becomes extremely valuable.
Charts displayed:
-
Consultation Fee (USD) by Clinic Name
-
Total Bill (USD) by Clinic Name
-
Profit (USD) by Clinic Name
This page reveals which locations perform best in terms of revenue and client engagement, helping you make data-driven expansion or improvement decisions.
5️⃣ Month Analysis Page

The Month Analysis Page gives you a timeline view of performance.
Charts displayed:
-
Consultation Fee (USD) by Month
-
Total Bill (USD) by Month
-
Profit (USD) by Month
You can easily compare month-to-month growth, identify seasonal trends, and evaluate how changes in pricing or marketing impacted revenue and profit.
🧾 Support Sheet: Data Sheet
All dashboard visualizations pull data from a Data Sheet that stores the detailed transactional information. You can update this sheet with your actual client or clinic data to automatically refresh the visuals.
Each column typically includes:
-
Client Name
-
Specialty
-
Plan Type
-
BMI Category
-
Payment Method
-
Consultation Fee
-
Total Bill
-
Profit
-
Region
-
Month
This structured dataset ensures that every visual in the dashboard updates instantly and accurately.
Advantages of Using the Nutrition & Dietetics Dashboard in Excel
Using a dedicated Excel dashboard for nutrition and dietetics brings several benefits to professionals and organizations alike.
🔸 1. Real-Time Insights
You can instantly view updated results whenever you modify the data. Excel’s automatic recalculations ensure that every KPI card and chart reflects the latest figures.
🔸 2. Time Efficiency
Instead of manually preparing charts and tables, the dashboard automates calculations and visualization — saving hours of work every week.
🔸 3. Data Accuracy
Since all metrics connect to a single source data table, the chances of manual error reduce significantly. Consistent formatting ensures clean reporting.
🔸 4. Interactive Analysis
Slicers and filters allow you to view data by month, region, plan type, or specialty — helping you focus on what matters most.
🔸 5. Performance Tracking
With clear charts showing consultation fees, satisfaction ratings, and profits, you can track growth over time and identify performance gaps.
🔸 6. Financial Clarity
Revenue and profit comparisons across clinics or months highlight your most and least profitable areas — aiding strategic financial planning.
🔸 7. Professional Presentation
The dashboard’s sleek design and color-coded visuals make it ideal for client presentations, reports, or performance reviews.
💡 How to Use the Nutrition & Dietetics Dashboard in Excel
To make the most of this dashboard, follow these simple steps:
-
Enter or import data into the Data Sheet.
-
Use dropdown filters to select a month, region, or plan.
-
Analyze KPI cards for high-level insights.
-
Review charts on each page to identify trends and outliers.
-
Download or share the dashboard visuals for meetings or client reports.
Within minutes, you’ll have a professional, data-driven report ready to present.
Best Practices for the Nutrition & Dietetics Dashboard
To get the best results and maintain long-term efficiency, apply these best practices:
✅ 1. Keep Your Data Updated
Regularly update your data sheet to ensure the visuals stay relevant. Old data may lead to wrong interpretations.
✅ 2. Use Consistent Units
Always maintain consistent units (e.g., USD for fees, days for duration) to avoid confusion in comparative analysis.
✅ 3. Validate Data Before Entry
Check entries for accuracy — such as ensuring BMI values, fees, and dates are correctly entered — to maintain reliable analytics.
✅ 4. Customize KPIs
Adjust KPI definitions to match your organization’s goals. For instance, you may add “Client Retention Rate” or “Average Weight Loss %.”
✅ 5. Utilize Conditional Formatting
Apply conditional formatting to highlight top-performing plans or regions automatically. Green for high profits, red for low, for example.
✅ 6. Review Trends Monthly
Use the Month Analysis page to observe trends regularly. Comparing results each month keeps your strategy proactive.
✅ 7. Protect Critical Cells
Lock formula and chart ranges to prevent accidental overwriting when sharing the dashboard with others.
✅ 8. Backup Your Data
Maintain regular backups of the dashboard to prevent loss of insights or historical trends.
📈 Use Cases for the Nutrition & Dietetics Dashboard
The versatility of this dashboard makes it suitable for different user groups:
🧑⚕️ For Individual Nutritionists
Track client consultations, satisfaction levels, and income streams without complex software.
🏥 For Clinics and Hospitals
Monitor department-wise profitability and manage multiple specialties under one data system.
🧘 For Wellness and Fitness Centers
Combine diet and fitness data to provide holistic reports to clients.
🧮 For Research and Education
Analyze client trends, plan effectiveness, and outcomes for studies or reports.
Click to Purchases Nutrition & Dietetics Dashboard in Excel
🔍 Why Choose Excel for Nutrition & Dietetics Analytics?
While modern BI tools like Power BI and Tableau exist, Excel remains one of the most accessible and powerful tools for analytics in healthcare and nutrition.
-
Excel offers built-in formulas, charts, and pivot tables that simplify analytics.
-
It does not require internet connectivity or subscription fees.
-
The dashboard can be easily customized or shared via email.
-
Professionals already familiar with Excel can start analyzing data without additional training.
💬 Advantages of Data-Driven Decision-Making in Nutrition
When nutritionists base their strategies on data rather than assumptions, they:
-
Improve client outcomes through personalized insights.
-
Optimize pricing and packages for maximum profitability.
-
Increase client trust by presenting transparent results.
-
Enhance strategic planning using month-over-month comparisons.
🏁 Conclusion
The Nutrition & Dietetics Dashboard in Excel is not just a spreadsheet — it’s a complete performance tracking and analysis solution. Whether you’re managing one clinic or several, it brings clarity to financial performance, client satisfaction, and plan effectiveness.
By following best practices and maintaining accurate data, you can transform this dashboard into a powerful business intelligence tool for your nutrition practice.
Health professionals who embrace analytics gain a competitive advantage — making smarter, faster, and more impactful decisions.
❓ Frequently Asked Questions (FAQs)
1. What is the purpose of a Nutrition & Dietetics Dashboard in Excel?
It helps nutritionists and clinics track key metrics like consultation fees, profits, satisfaction ratings, and average diet duration to make informed decisions.
2. Can I customize the dashboard according to my business?
Yes. You can modify KPI cards, chart layouts, and data columns as per your business model and reporting needs.
3. How often should I update the data?
You should update it regularly — ideally weekly or monthly — to ensure reports stay current and accurate.
4. Do I need advanced Excel skills to use this dashboard?
No. The dashboard is designed for ease of use. You only need to update the data sheet; all visuals refresh automatically.
5. Can I share this dashboard with my team?
Absolutely. You can share it via email or cloud storage. Protect formula cells to prevent accidental changes.
6. What types of KPIs are included?
KPIs like consultation fee, total bill, profit, satisfaction rating, and average diet duration are pre-built. You can add more as needed.
7. Is it suitable for freelancers or small clinics?
Yes. It’s ideal for freelancers, dieticians, nutrition startups, and small health centers looking for a cost-effective analytics solution.
Visit our YouTube channel to learn step-by-step video tutorials
Click to Purchases Nutrition & Dietetics Dashboard in Excel