Managing office furniture can be a challenging task for any organization. Furniture items such as desks, chairs, cabinets, and storage units represent a significant investment. However, without proper monitoring, companies often face issues like over-purchasing, under-utilization, damaged assets, or untracked storage. This is where an Office Furniture Inventory Dashboard in Excel becomes a powerful solution.
This ready-to-use dashboard allows businesses to track, analyze, and manage furniture resources with ease. By consolidating data into a single interactive file, organizations can ensure efficient use of resources, budget control, and timely repair or replacement.
In this article, we will explore everything you need to know about the Office Furniture Inventory Dashboard in Excel, including:
Click to Purchases Office Furniture Inventory Dashboard in Excel
-
Its key features
-
Page-by-page explanation
-
Advantages of using it
-
Opportunities for improvement
-
Best practices for implementation
-
FAQs
What is an Office Furniture Inventory Dashboard in Excel?
An Office Furniture Inventory Dashboard in Excel is a pre-designed template that helps organizations track and monitor their furniture assets. Instead of relying on scattered spreadsheets or manual records, this dashboard provides a centralized system to visualize:
-
Furniture conditions (good, in use, repair needed, disposed)
-
Department-wise and vendor-wise allocation
-
Budget allocation vs. usage
-
Monthly usage and trends
-
Total cost analysis by department or location
Because it is built in Excel, there is no need for additional software. The dashboard comes with built-in formulas, charts, and slicers that make it easy to navigate and analyze data in real time.
Key Features of the Office Furniture Inventory Dashboard
The Office Furniture Inventory Dashboard in Excel comes with several features designed for effective tracking. Let’s look at them in detail:
Page Navigator
-
Located on the left side of the dashboard.
-
Allows smooth navigation across all analytical pages.
-
Makes it easy to jump from overview to department, category, vendor, or monthly trends.
Multi-Page Analysis
The dashboard is structured into five major pages, each dedicated to specific insights:
-
Overview Page
-
Department Analysis
-
Category Analysis
-
Vendor Analysis
-
Monthly Trends
In addition, it includes a Data Sheet for raw inputs and a Support Sheet for references.
Page-by-Page Breakdown of the Dashboard
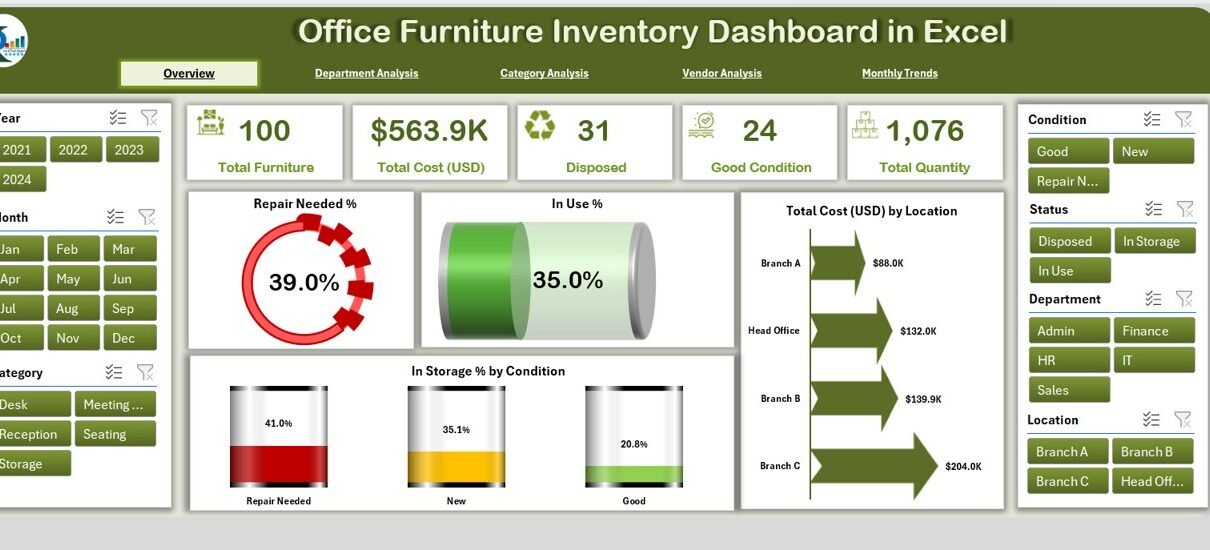
Overview Page
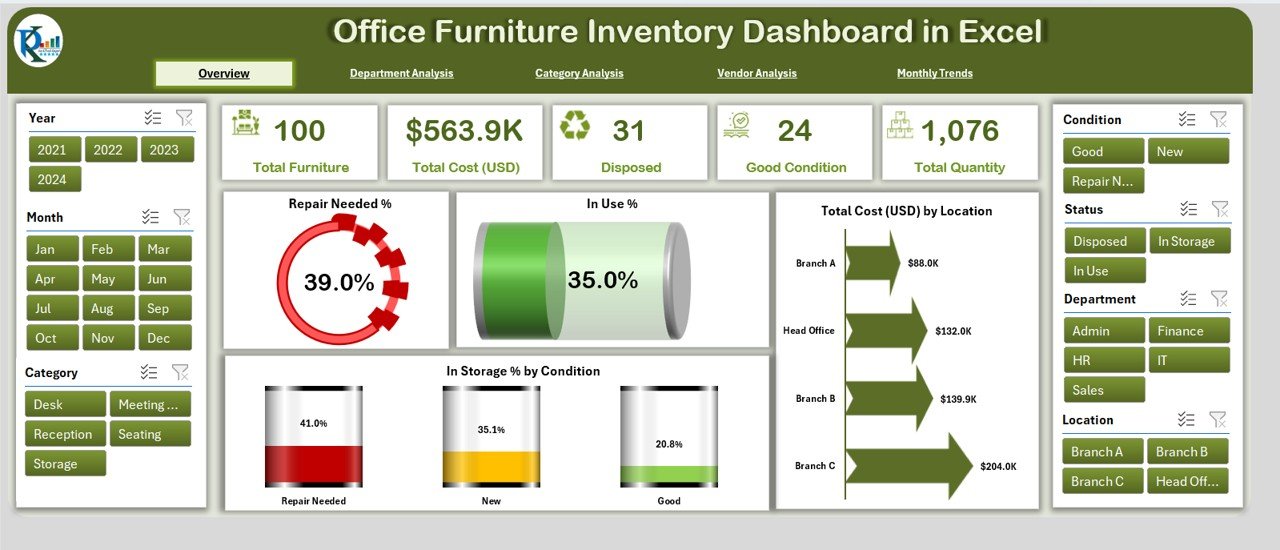
This is the main page of the dashboard, designed for a quick glance at important metrics.
Cards displayed include:
- Completed %
- Delayed %
- Completed % by Stage
- Budget Allocation (USD) vs. Budget Used (USD) by Department
- Repair Needed %
- In Use %
- Total Cost (USD) by Location
- In Storage % by Location
This page provides managers with a holistic view of furniture usage, condition, and cost distribution.
Department Analysis
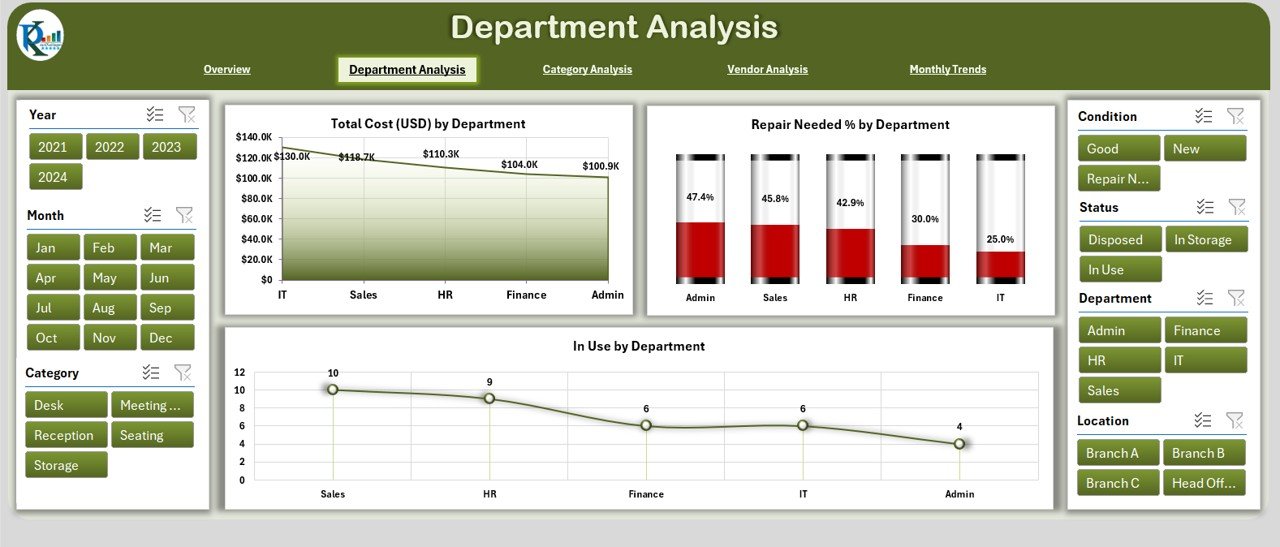
This page breaks down data by department to show how resources are being utilized.
Charts included:
- Total Cost (USD) by Department
- Repair Needed % by Department
- In Use % by Department
With this analysis, departments that require urgent attention can be identified, ensuring fair allocation and repair schedules.
Click to Purchases Office Furniture Inventory Dashboard in Excel
Category Analysis
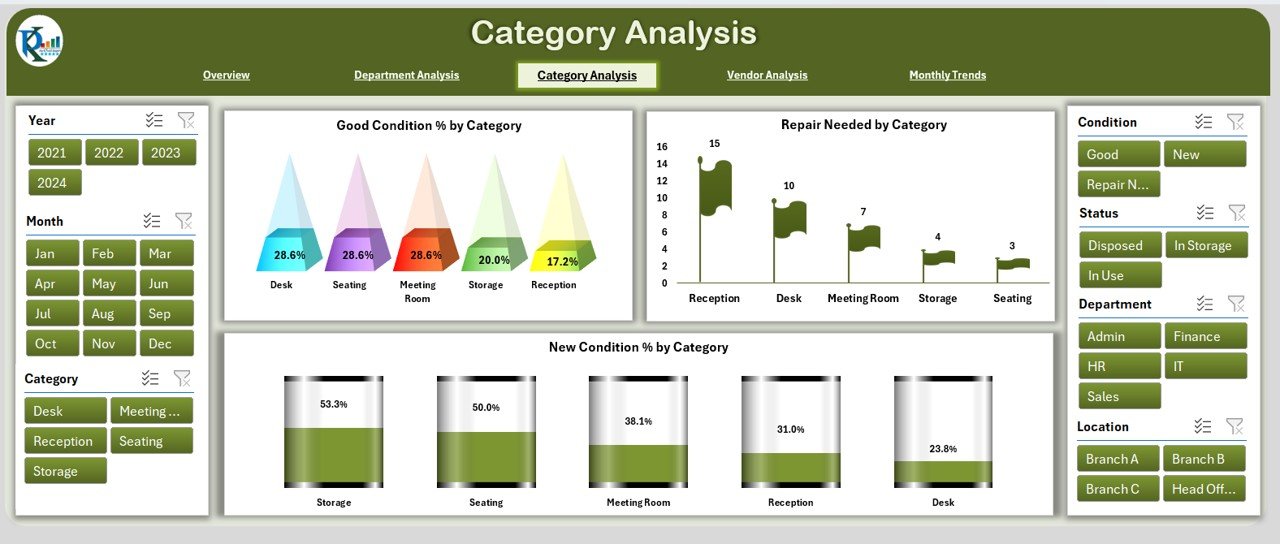
The category analysis page highlights the condition of furniture items across categories.
Charts included:
- Good Condition % by Category
- Repair Needed % by Category
- New Condition % by Category
This helps organizations understand which categories (like chairs, desks, or cabinets) need replacement or maintenance most often.
Vendor Analysis
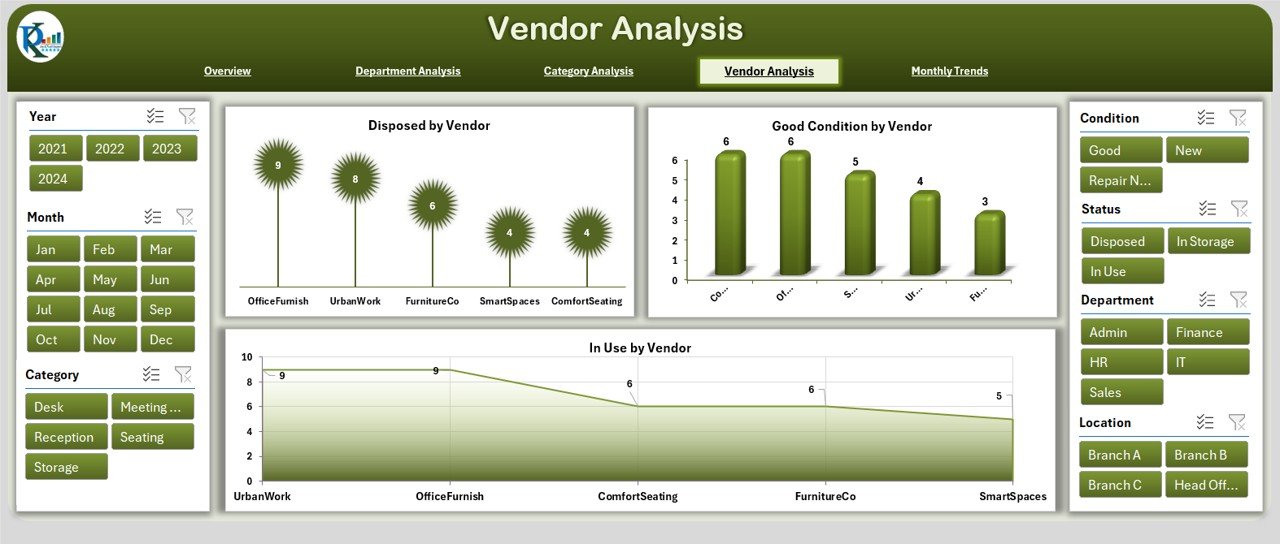
Vendor performance plays an important role in office furniture management. This page provides insights into vendor contributions.
Charts included:
- Disposed % by Vendor
- Good Condition % by Vendor
- In Use % by Vendor
By comparing vendors, companies can identify which suppliers provide durable furniture and which require follow-up for quality improvements.
Monthly Trends
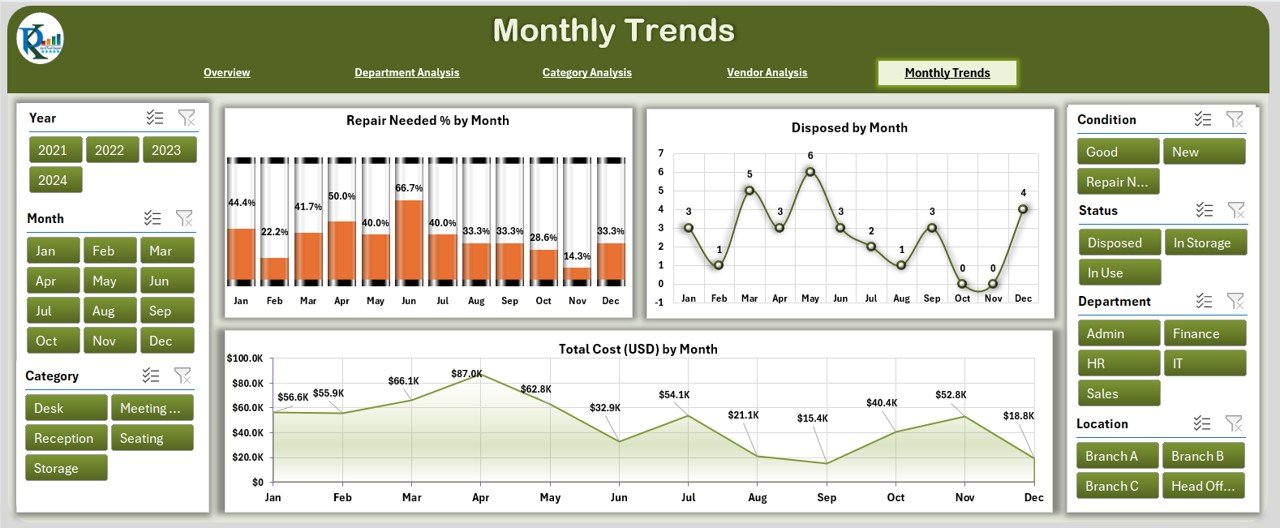
The monthly trends page shows patterns over time.
Charts included:
- Completed % by Month
- Budget Allocation (USD) vs. Budget Used (USD) by Month
- Delayed % by Month
- Repair Needed % by Month
- Disposed % by Month
- Total Cost (USD) by Month
These trends allow decision-makers to forecast budget requirements, plan purchases, and schedule preventive maintenance.
Data Sheet and Support Sheet
Data Sheet:
- Contains all the raw input data such as item ID, name, category, vendor, purchase cost, condition, and department.
Support Sheet:
- Acts as a reference to store dropdown lists (such as department names, vendor lists, condition categories).
- Helps ensure consistency in data entry.
Why Should Businesses Use an Office Furniture Inventory Dashboard?
Many organizations overlook the cost of poorly managed furniture. For example, duplicate purchases, unnecessary storage costs, or delays in repair often go unnoticed. This dashboard solves these problems by:
-
Centralizing data management
-
Preventing overspending
-
Extending furniture lifespan with proper repair tracking
-
Improving vendor accountability
-
Streamlining department requests
Advantages of Office Furniture Inventory Dashboard in Excel
Here are some key benefits:
✅ Cost Savings – Track budget allocation vs. actual usage and avoid overspending.
✅ Better Decision-Making – Access real-time data for procurement and repair decisions.
✅ Efficiency – Save time by replacing multiple spreadsheets with a single dashboard.
✅ Scalability – Works for both small offices and large organizations.
✅ Vendor Management – Monitor vendor quality and choose the most reliable suppliers.
✅ Data Visualization – Use charts and slicers for quick insights rather than scanning long tables.
Opportunities for Improvement
While the Office Furniture Inventory Dashboard in Excel is powerful, it can be further enhanced by:
🔧 Automation with VBA – Add macros to automate monthly reporting.
🔧 Integration with Barcode Scanners – Track furniture using barcodes for quick check-ins and check-outs.
🔧 Cloud Integration – Move the dashboard to platforms like OneDrive or Google Drive for team collaboration.
🔧 Predictive Analytics – Add forecasting models to predict future repair or replacement needs.
🔧 Mobile Access – Extend accessibility to mobile devices for on-site inventory checks.
Best Practices for Using the Office Furniture Inventory Dashboard
To maximize the value of this dashboard, businesses should follow these best practices:
📊 Update Data Regularly – Ensure the data sheet is updated whenever furniture is purchased, disposed, or repaired.
📌 Use Standard Categories – Maintain consistent names for categories and departments to avoid errors.
📉 Track Repair History – Record repair dates and costs for better asset lifecycle management.
📂 Set Budget Limits – Monitor budget allocation to avoid unexpected overspending.
👥 Assign Responsibility – Assign a dedicated person or team to manage the dashboard.
🔄 Review Monthly Trends – Use the trends page to adjust procurement strategies and repair schedules.
Conclusion
The Office Furniture Inventory Dashboard in Excel is more than just a template—it’s a complete management tool for tracking office assets. By consolidating data into a structured dashboard, businesses can save costs, manage vendors effectively, and improve resource utilization.
As organizations grow, furniture management becomes increasingly complex. This dashboard provides a simple, affordable, and scalable solution that ensures nothing goes untracked.
Frequently Asked Questions (FAQs)
1. What is an Office Furniture Inventory Dashboard in Excel?
It is a pre-designed Excel template that helps organizations monitor and manage office furniture data, including cost, condition, department usage, and vendors.
2. Who can use this dashboard?
HR teams, facility managers, procurement officers, and finance departments can all benefit from using this dashboard.
3. Can this dashboard be customized?
Yes. Since it is built in Excel, you can add charts, KPIs, or even VBA automation to suit your company’s specific needs.
4. How often should I update the data?
It is best to update the data sheet immediately after any purchase, repair, or disposal. Monthly reviews are also recommended.
5. Does this dashboard require advanced Excel skills?
No. The template comes with built-in formulas and slicers. Basic Excel knowledge is enough to use it effectively.
6. Can I share this dashboard with my team?
Yes. You can store the file on shared drives like OneDrive or Google Drive so multiple users can access and update it.
Visit our YouTube channel to learn step-by-step video tutorials