In every organization, office furniture is a major asset that contributes to comfort, functionality, and brand image. Managing and tracking these assets, however, can be a challenge — especially when furniture is spread across multiple departments, floors, or locations. That’s where an Office Furniture Inventory Report in Excel becomes a game-changer.
This guide will show you how an Excel-based furniture inventory report helps businesses maintain control, reduce losses, and make informed purchasing decisions. You’ll also learn about its structure, benefits, and the best practices for setting it up effectively.
Click to Purchases Office Furniture Inventory Report in Excel
What Is an Office Furniture Inventory Report in Excel?
An Office Furniture Inventory Report in Excel is a structured spreadsheet designed to record, monitor, and analyze all office furniture items owned by a company. It acts as a centralized tool for asset tracking — showing what you have, where it is, its current condition, and how much it costs.
Unlike manual records or scattered lists, this Excel template offers:
-
Instant visibility into inventory levels.
-
Cost summaries across departments.
-
Repair and replacement tracking.
-
Easy filtering and reporting.
With dynamic charts, slicers, and summary visuals, this Excel report helps management teams quickly assess asset health and make data-driven decisions — all without expensive software.
Structure of the Office Furniture Inventory Report Template
The Office Furniture Inventory Report in Excel includes three primary pages plus one support sheet. Each page plays a specific role in helping you manage data efficiently and visualize your inventory performance.
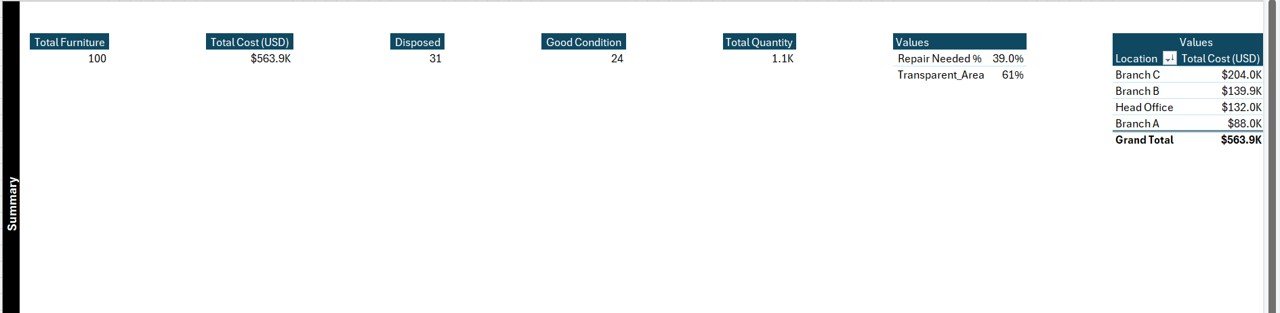
Summary Page — The Dashboard Overview
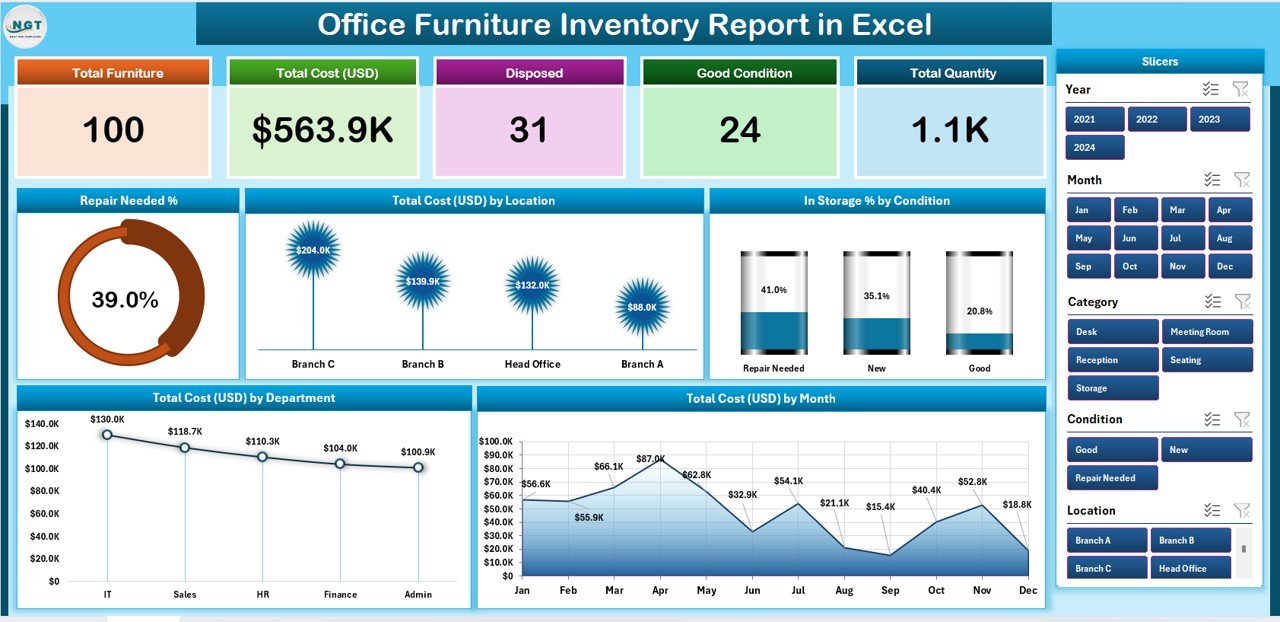
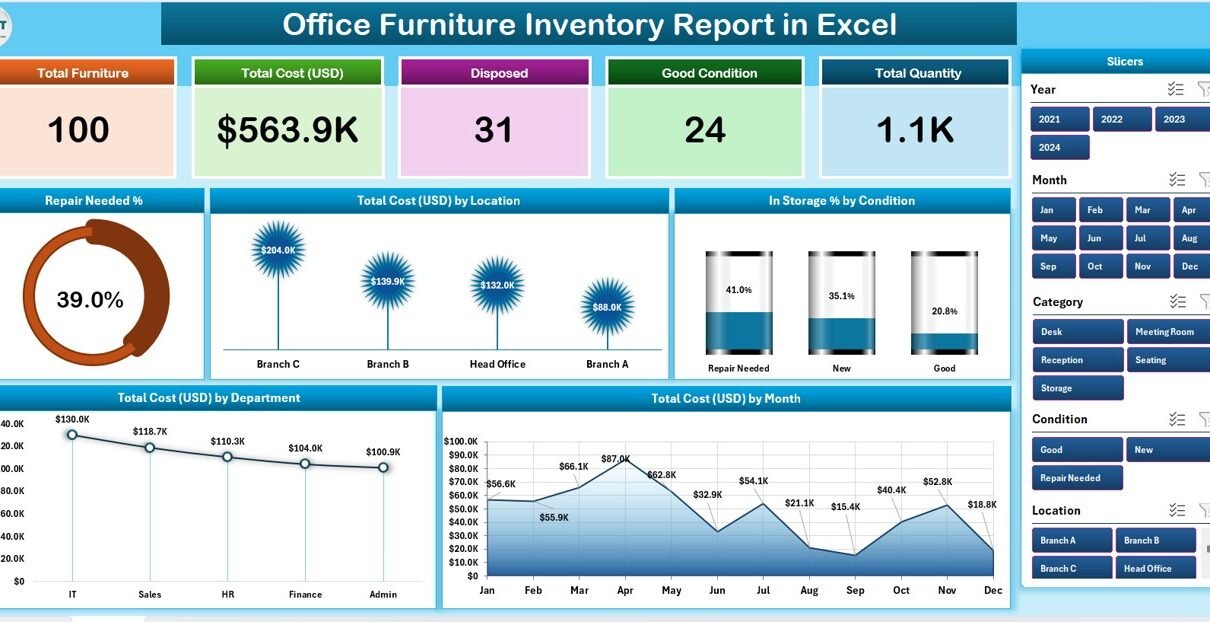
The Summary Page is the main dashboard that gives a quick snapshot of your entire office furniture inventory. It includes:
Top Cards Section
At the top, you’ll see five dynamic cards summarizing the key statistics such as:
-
Total Furniture Count
-
Total Cost (USD)
-
Repair Needed %
-
In-Storage %
-
Active Items Count
These cards automatically update as you change filters or input data.
Visual Charts
Below the cards, the dashboard displays five analytical charts that help you understand cost and condition distribution:
-
Repair Needed % Chart – Highlights the percentage of furniture items that require maintenance or repair.
-
Total Cost (USD) by Location – Breaks down cost by different office locations.
-
In Storage % by Condition – Displays how much furniture is stored versus actively used.
-
Total Cost (USD) by Department – Helps track which department holds the most expensive furniture.
-
Total Cost (USD) by Month – Displays monthly spending patterns or acquisition costs.
Right-Side Slicer
A slicer panel allows you to filter the dashboard by parameters such as department, location, furniture type, or condition. With one click, you can view specific data instantly — making it interactive and powerful.
Click to Purchases Office Furniture Inventory Report in Excel
Report Page — The Detailed View
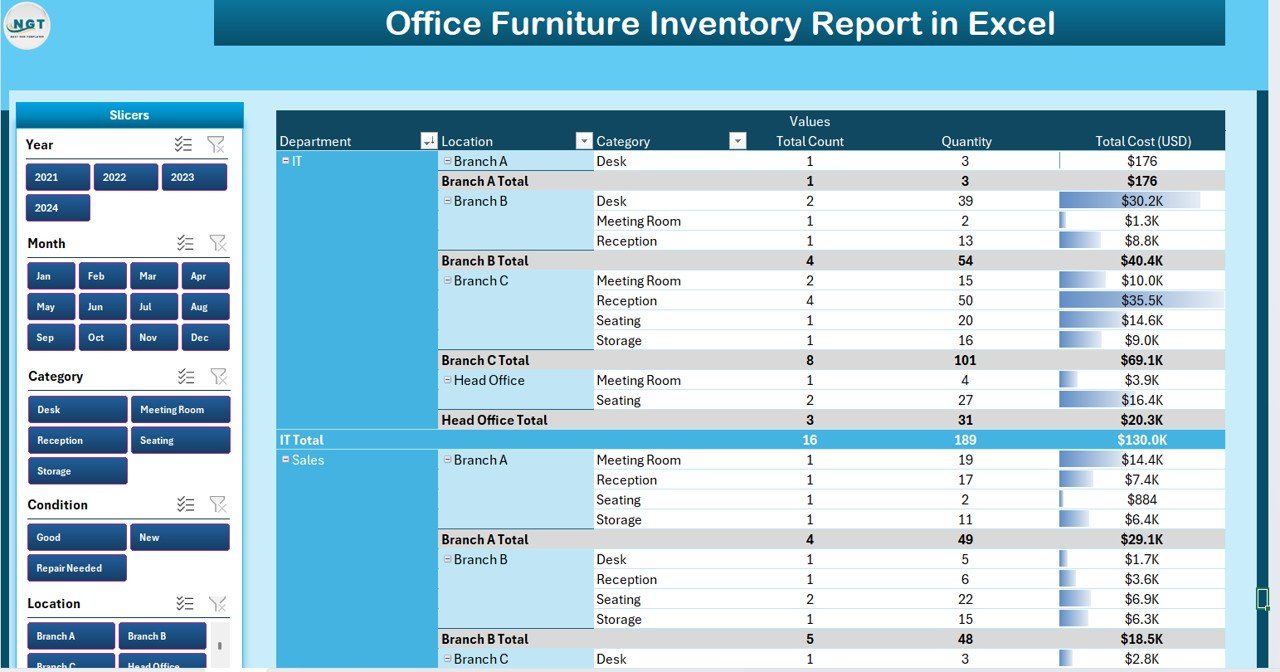
The Report Page offers a structured table view for managers who prefer detailed listings. It includes:
-
A left-side slicer panel for filtering by date, category, or department.
A tabular format that displays item-level data, including:
- Asset ID or Tag Number
- Furniture Type
- Location
- Department
- Purchase Date
- Condition
- Cost (USD)
- Remarks or Notes
This page is ideal for auditors, operations staff, or administrative personnel who handle the actual tracking and verification of physical assets.
Data Sheet — The Core Database
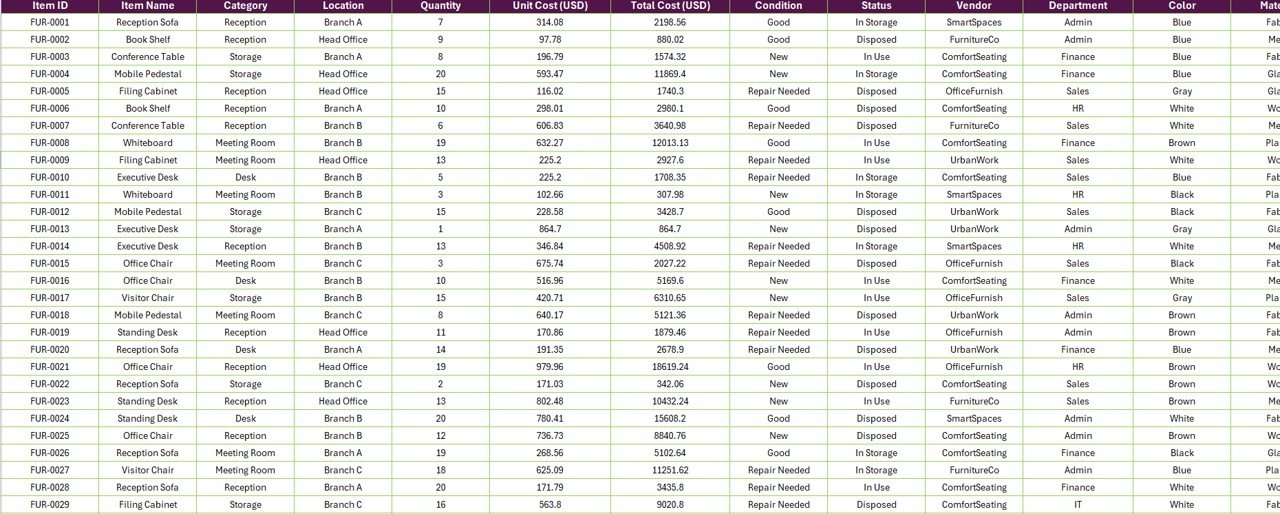
The Data Sheet is where all the raw inventory information is stored. It serves as the backbone of the report. Here, you can maintain:
-
Furniture Name
-
Category (e.g., Chair, Table, Cabinet, etc.)
-
Model or Description
-
Purchase Date
-
Vendor Name
-
Cost
-
Current Condition
-
Assigned Department or Location
This sheet is designed for easy data entry and can be linked with Power Query or pivot tables for dynamic updates.
Support Sheet — For Drop-Down Lists and Control Data
The Support Sheet manages supporting information such as:
-
List of departments
-
List of locations
-
Condition categories (e.g., New, Good, Needs Repair, Scrap)
-
Furniture types
This structure keeps the main sheets clean and ensures consistent data through dropdown menus — reducing manual typing errors and maintaining uniformity.
How the Office Furniture Inventory Report Works
When you open the Excel template, you’ll find it easy to use even if you’re not a technical expert. Here’s how it functions step by step:
-
Enter or import data into the Data Sheet.
-
The Report Page automatically updates through Excel formulas and pivot tables.
-
The Summary Dashboard refreshes with updated KPIs and charts.
-
You can filter by month, location, or department using slicers.
-
Print or export visual charts and summaries for management reports.
This process ensures accurate and real-time insights into your furniture assets.
Click to Purchases Office Furniture Inventory Report in Excel
Why Use Excel for Furniture Inventory Management?
You might wonder — why not use dedicated asset management software? While specialized software can be helpful, Excel remains one of the most cost-effective and flexible tools for small and medium-sized businesses.
Here’s why:
-
It’s accessible — almost every office already has Excel.
-
It’s customizable — you can easily add, remove, or modify fields.
-
It’s visual — you can create dashboards, charts, and summaries without coding.
-
It’s easy to maintain — no IT dependency for small updates.
-
It’s shareable — multiple users can collaborate and view the same report.
Excel’s power lies in its combination of simplicity and capability.
Advantages of the Office Furniture Inventory Report in Excel
Let’s look at the key benefits your organization can enjoy by using this report:
🪑 1. Centralized Asset Tracking
All furniture details — type, quantity, cost, and condition — are captured in one place. This prevents duplication and improves visibility.
💰 2. Cost Transparency
You can easily see where most of your furniture budget goes and identify departments or locations with higher costs.
🧾 3. Simplified Maintenance Planning
With the Repair Needed % indicator, you can proactively plan repairs and replacements instead of waiting for items to fail.
📈 4. Better Decision-Making
The dashboard visuals make it simple to interpret trends and make informed procurement or replacement decisions.
⏱️ 5. Time Efficiency
Automated calculations and slicers eliminate manual tracking and repetitive reporting tasks.
🧩 6. Scalability
You can add new furniture categories or expand locations anytime without needing a new tool.
🔍 7. Audit and Compliance Readiness
Having detailed records in a standardized format ensures you’re ready for any internal or external audit.
Best Practices for Managing Office Furniture Inventory in Excel
To get the most from your Office Furniture Inventory Report, follow these best practices:
1. Keep Data Consistent
Use dropdown lists and standard naming conventions for departments, locations, and conditions. Consistent data avoids mismatches and errors in pivot charts.
2. Update Regularly
Set a schedule to update inventory data monthly or quarterly. Regular updates keep your reports accurate and reliable.
3. Back Up Your File
Maintain backup copies to prevent data loss. Use cloud storage or shared drives for easy recovery.
4. Protect the Dashboard
Lock formula cells and protect sheets to avoid accidental changes that might disrupt calculations.
5. Review High-Cost Areas
Analyze the “Total Cost by Department” and “Repair Needed %” charts often. They reveal areas where spending or wear-and-tear is high.
6. Use Filters and Slicers Wisely
Leverage slicers to view specific departments or locations instead of altering the main data. This keeps your master data intact.
7. Link with Procurement Data
If possible, connect your report with purchase records to automatically update new assets.
8. Analyze Year-over-Year Trends
Compare data over time to spot long-term usage patterns, helping in budget forecasting and sustainability planning.
Opportunities for Improvement
While Excel is powerful, you can further enhance the report using the following ideas:
-
Add conditional formatting to highlight overdue repairs or high-cost furniture.
-
Use data validation to restrict input errors.
-
Implement Power Query to automate data refreshes from external sources.
-
Integrate Power BI for advanced visualizations and cloud access.
-
Include a barcode or QR code field for physical verification.
These enhancements make the template even more dynamic and professional.
How to Customize the Template for Your Organization
Every office setup is unique. You can personalize the Office Furniture Inventory Report easily:
-
Rename categories to match your internal departments.
-
Add new fields such as “Vendor,” “Warranty Expiry,” or “Purchase Approval.”
-
Adjust dashboard colors to align with your brand theme.
-
Add more charts for trend analysis, such as “Repair Cost by Month.”
-
Link to live data if you manage multiple branches.
The flexibility of Excel allows you to tailor the report perfectly to your workflow.
Real-World Applications
The Office Furniture Inventory Report in Excel is useful for:
-
Corporate offices tracking furniture across branches.
-
Facilities management teams monitoring repairs and replacements.
-
Procurement departments analyzing cost trends.
-
Auditors and compliance teams verifying asset existence and condition.
-
Startups and small businesses managing limited budgets effectively.
It’s a versatile solution that scales from small offices to enterprise-level organizations.
Common Mistakes to Avoid
To keep your report accurate and efficient, avoid these common pitfalls:
❌ Entering inconsistent data (e.g., “HR” vs. “Human Resources”).
❌ Forgetting to refresh pivot tables after updates.
❌ Overloading the file with unnecessary charts.
❌ Not protecting formula cells.
❌ Using merged cells that break sorting or filtering.
A disciplined approach ensures long-term usability and cleaner analysis.
Conclusion
An Office Furniture Inventory Report in Excel offers a clear, efficient, and cost-effective way to manage one of your most visible business assets — your furniture.
By combining structured data with visual insights, it transforms inventory management from a manual task into a strategic advantage.
Whether you’re a small business owner or a facility manager in a large corporation, this report helps you monitor costs, track conditions, and plan budgets more effectively — all inside Microsoft Excel.
Frequently Asked Questions (FAQs)
1. What is the purpose of an Office Furniture Inventory Report?
It helps businesses record, track, and analyze all furniture assets, ensuring transparency in costs and easy maintenance tracking.
2. Can I add more categories or departments to the Excel file?
Yes. The template is fully customizable. You can add or modify departments, furniture types, or locations anytime.
3. How often should I update the inventory data?
Monthly or quarterly updates are recommended to maintain accurate records and reflect any repairs, disposals, or new purchases.
4. Can I use this report in Google Sheets?
Yes. You can easily upload it to Google Sheets, though advanced Excel features like slicers might behave differently.
5. Does this report calculate depreciation?
By default, it does not include depreciation. However, you can add a depreciation formula column based on your organization’s accounting policy.
6. What is the best way to track damaged furniture?
Use the “Condition” and “Repair Needed %” metrics in the report. Highlight damaged items with conditional formatting for quick visibility.
7. How can this report help in budgeting?
The “Total Cost by Month” and “Departmental Cost” charts provide spending patterns that help predict and plan future furniture budgets.
8. Is this report suitable for schools, hospitals, or hotels?
Absolutely. Any institution that owns multiple furniture items can adapt this Excel template for their environment.
Visit our YouTube channel to learn step-by-step video tutorials