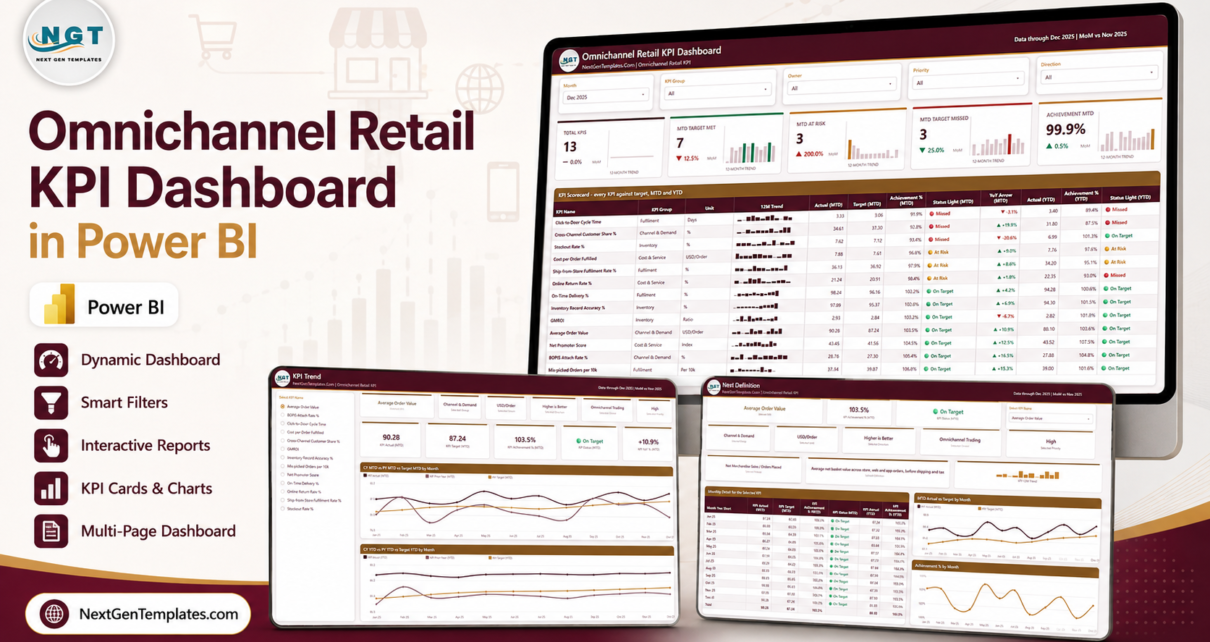
13 omnichannel retail KPIs, 12 months of MTD and YTD history, 5 filtering dimensions, and 1 editable scorecard. The Omnichannel Retail KPI Dashboard in Power BI turns a structured Excel data pack into a focused monthly performance review for store, web, app, fulfilment, inventory, cost, and customer-experience teams. It brings current actuals, targets, prior-year values, achievement percentages, and traffic-light status into the same report instead of leaving them across separate spreadsheets.
The design is intentionally a KPI scorecard rather than a general retail analytics dashboard. Its job is to answer a small set of recurring management questions: Which measures met target? Which are at risk? Which missed? Is performance improving against last year? Who owns each KPI? The shipped numbers are sample data, not benchmarks, and the report does not connect automatically to a POS, ecommerce platform, OMS, WMS, or CRM.
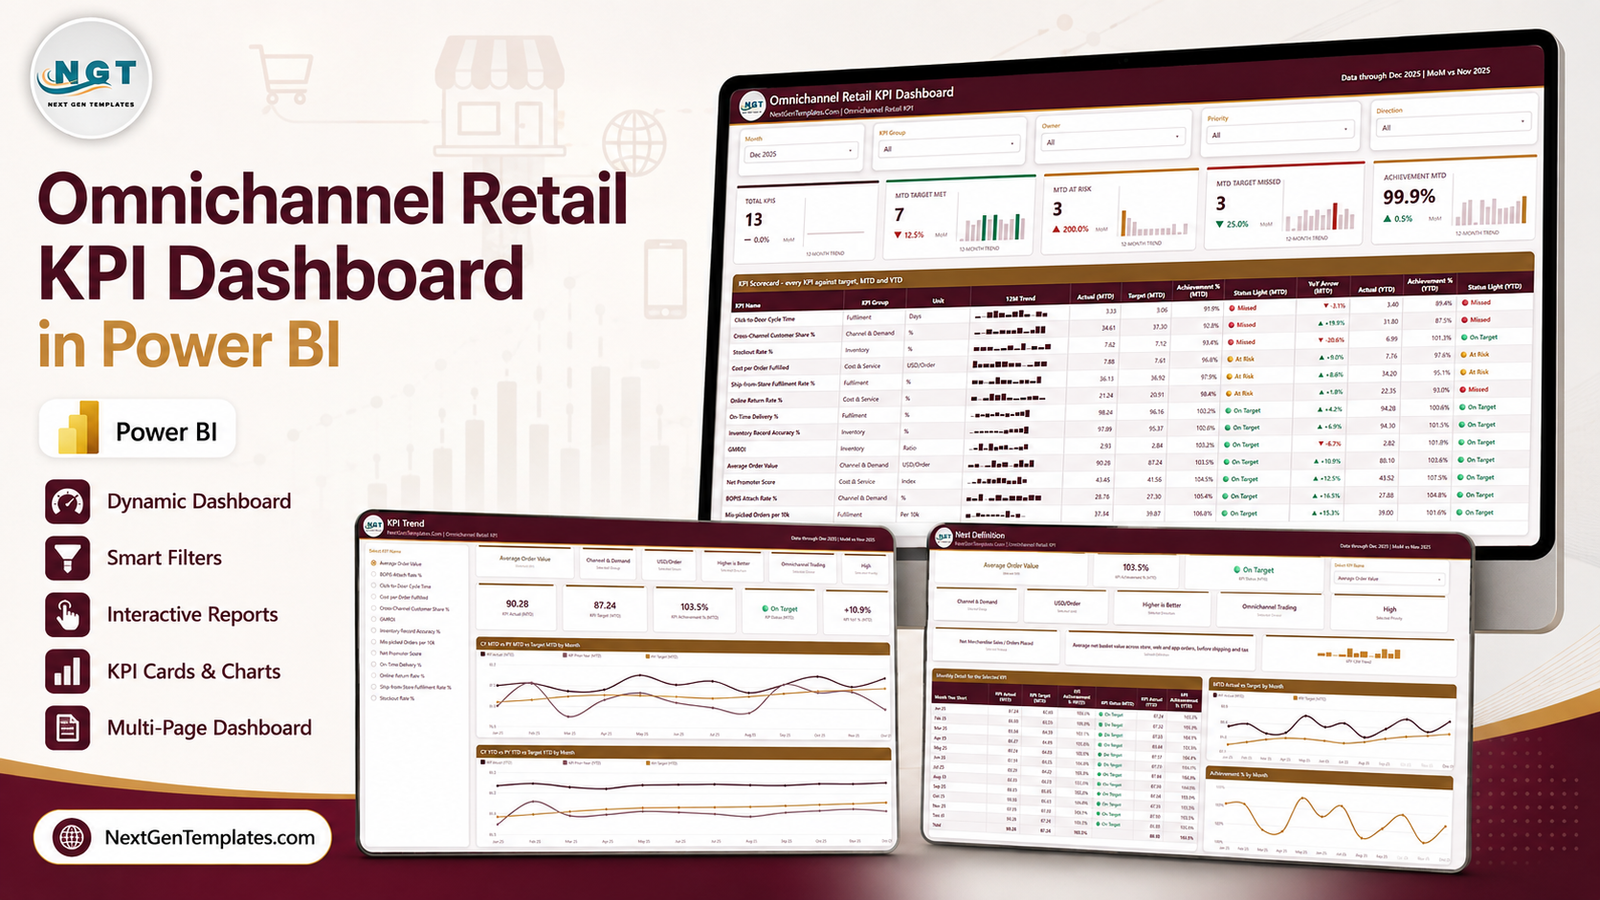
Key Features of Omnichannel Retail KPI Dashboard in Power BI
The report is built around a direction-aware scoring model. Higher-is-better measures, such as On-Time Delivery or Inventory Record Accuracy, score actual divided by target. Lower-is-better measures, such as Stockout Rate, Cost per Order Fulfilled, or Click-to-Door Cycle Time, reverse that logic so beating a lower target produces an achievement above 100%. The included thresholds classify 100% or more as On Target, 95% to below 100% as At Risk, and below 95% as Missed.
- 13 supplied KPIs: BOPIS Attach Rate, Cross-Channel Customer Share, Average Order Value, Ship-from-Store Fulfilment Rate, On-Time Delivery, Mis-picked Orders per 10k, Click-to-Door Cycle Time, Inventory Record Accuracy, Stockout Rate, GMROI, Cost per Order Fulfilled, Online Return Rate, and Net Promoter Score.
- MTD and YTD evaluation: actuals and targets appear with achievement and status for the selected month.
- Prior-year comparison: the trend pages show current year, prior year, and target month by month.
- Five slicers: Month, KPI Group, Owner, Priority, and Direction.
- Editable KPI dictionary: group, unit, formula, definition, direction, owner, and priority come from Data.xlsx.
- Flexible metric set: add, rename, or remove KPIs by keeping the three source sheets aligned and refreshing the model.
- Report-page tooltips: two hidden 280-by-360 pages support detailed hover context.
- Complete package: PBIX, Excel data pack, and PDF user manual are delivered together.
Dashboard Pages Explanation
KPI Scorecard
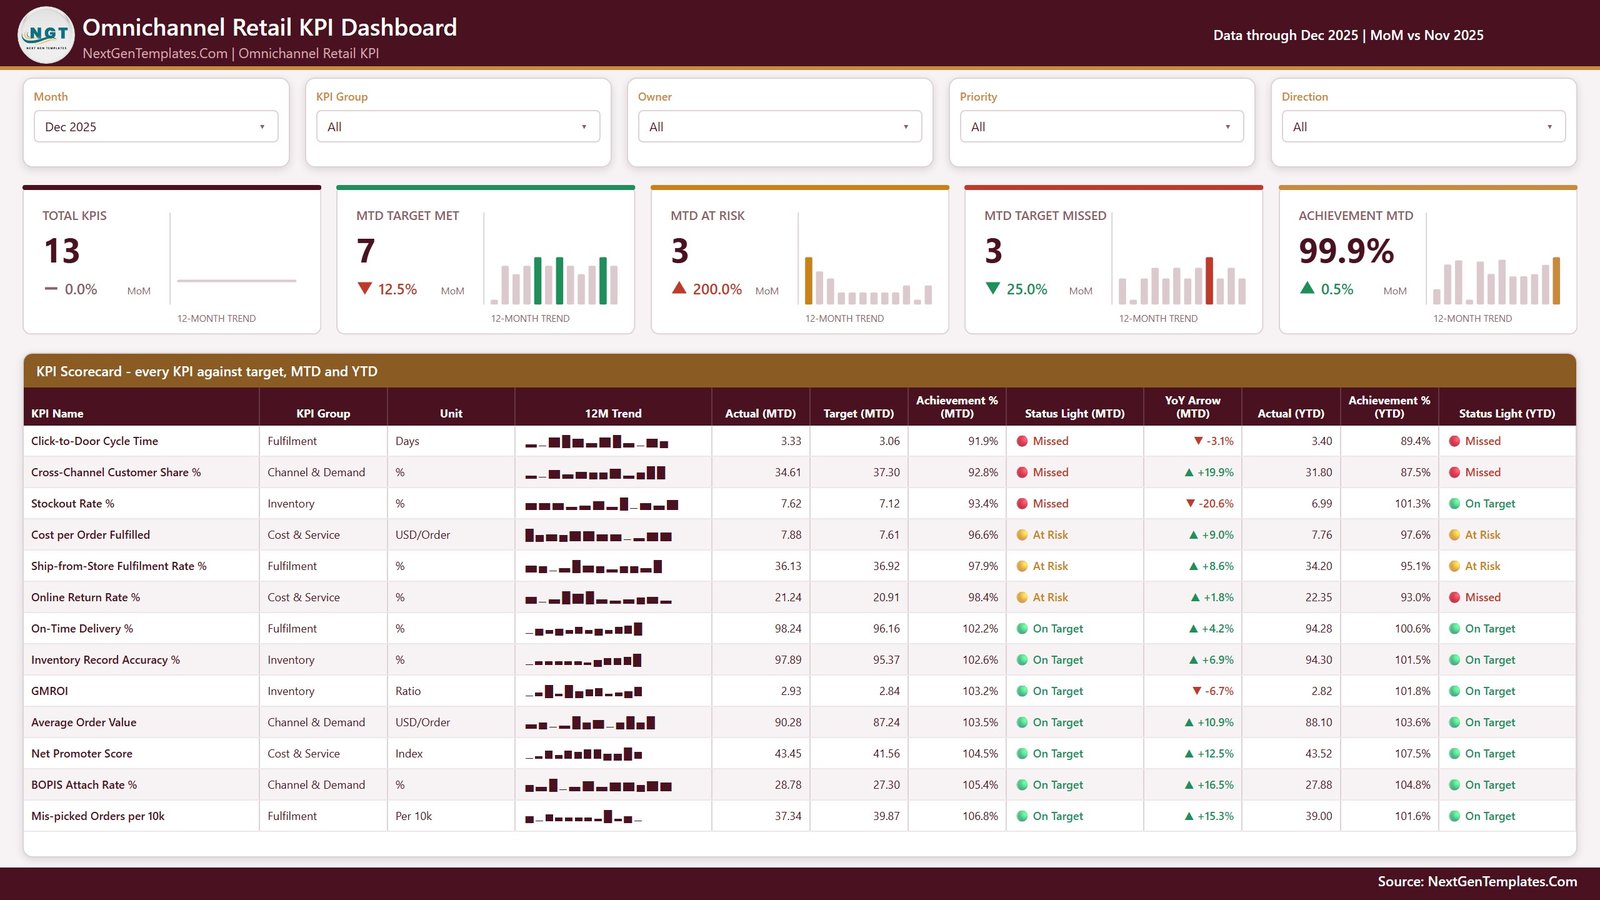
The first page is the management view. Five slicers run across the top, followed by cards for Total KPIs, MTD Target Met, MTD At Risk, MTD Target Missed, and Achievement MTD. The table then gives every KPI a 12-month sparkline and the core MTD/YTD fields. Because the table sorts by MTD achievement, the most urgent exceptions can be reviewed first.
The sample December 2025 view contains 13 KPIs: 7 meeting target, 3 at risk, and 3 missed. Those counts describe only the supplied demo data. They are useful for showing how the design behaves, but they should not be interpreted as a standard for an actual retailer.
KPI Trend
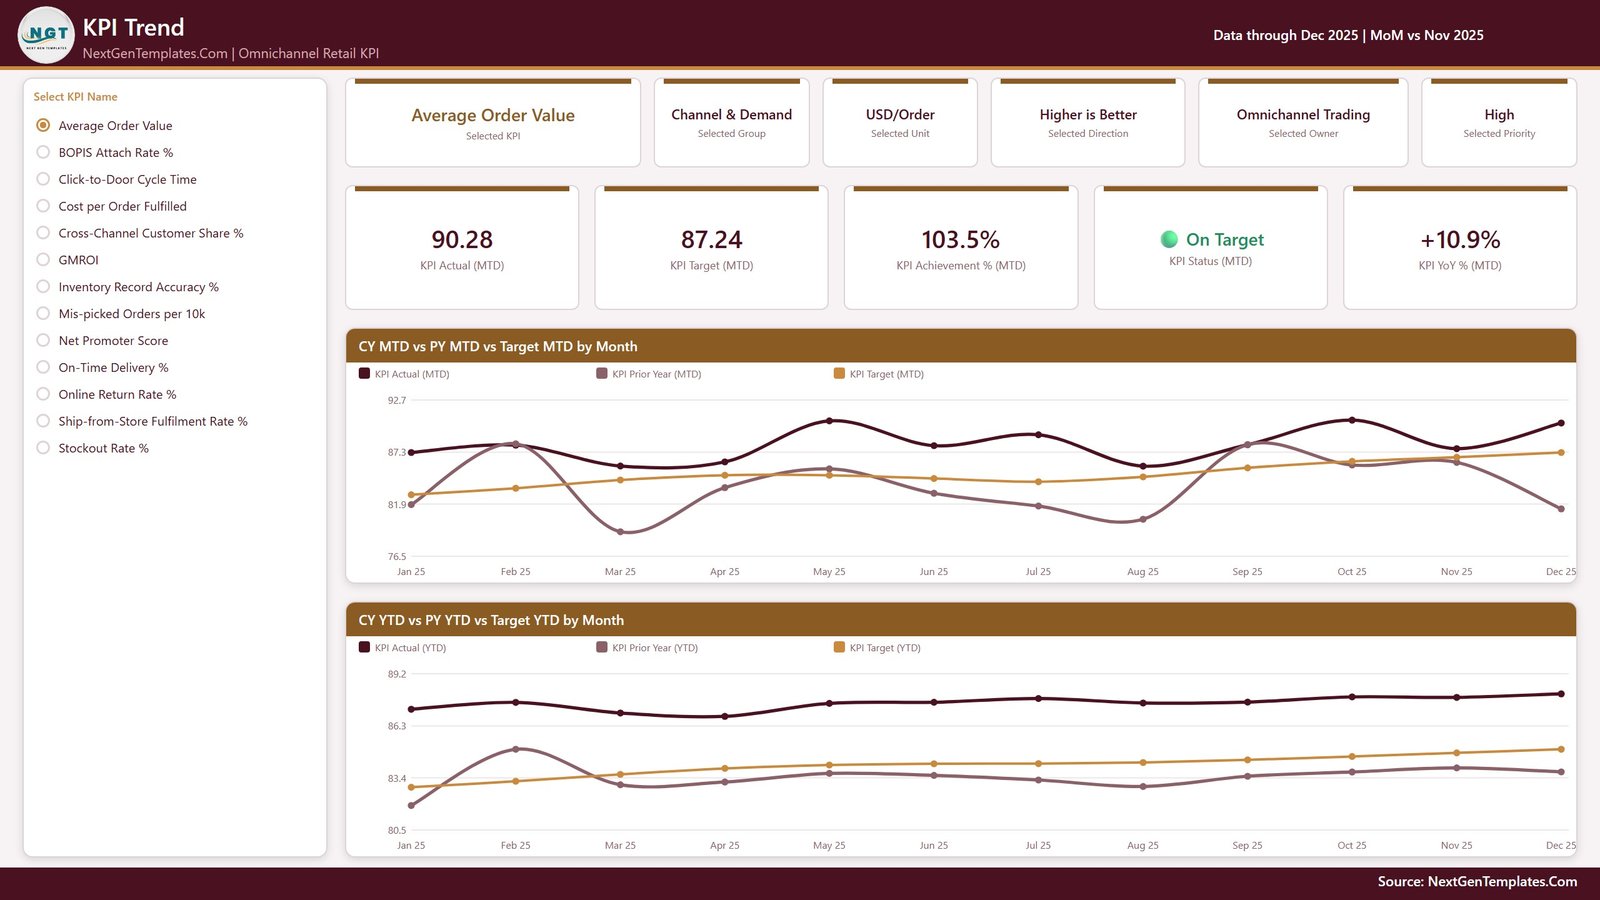
The KPI Trend page is for one-measure investigation. Select a KPI from the list to update its group, unit, direction, owner, priority, MTD actual, MTD target, achievement, status, and year-over-year movement. The first chart compares current-year MTD, prior-year MTD, and target MTD by month; the second applies the same comparison to YTD values.
This separation matters because a KPI can be on target for the current month but still trail its accumulated YTD goal, or it can improve against the previous year while remaining below the business target. Seeing all three series prevents a single green or red status from becoming the whole story.
KPI Definition
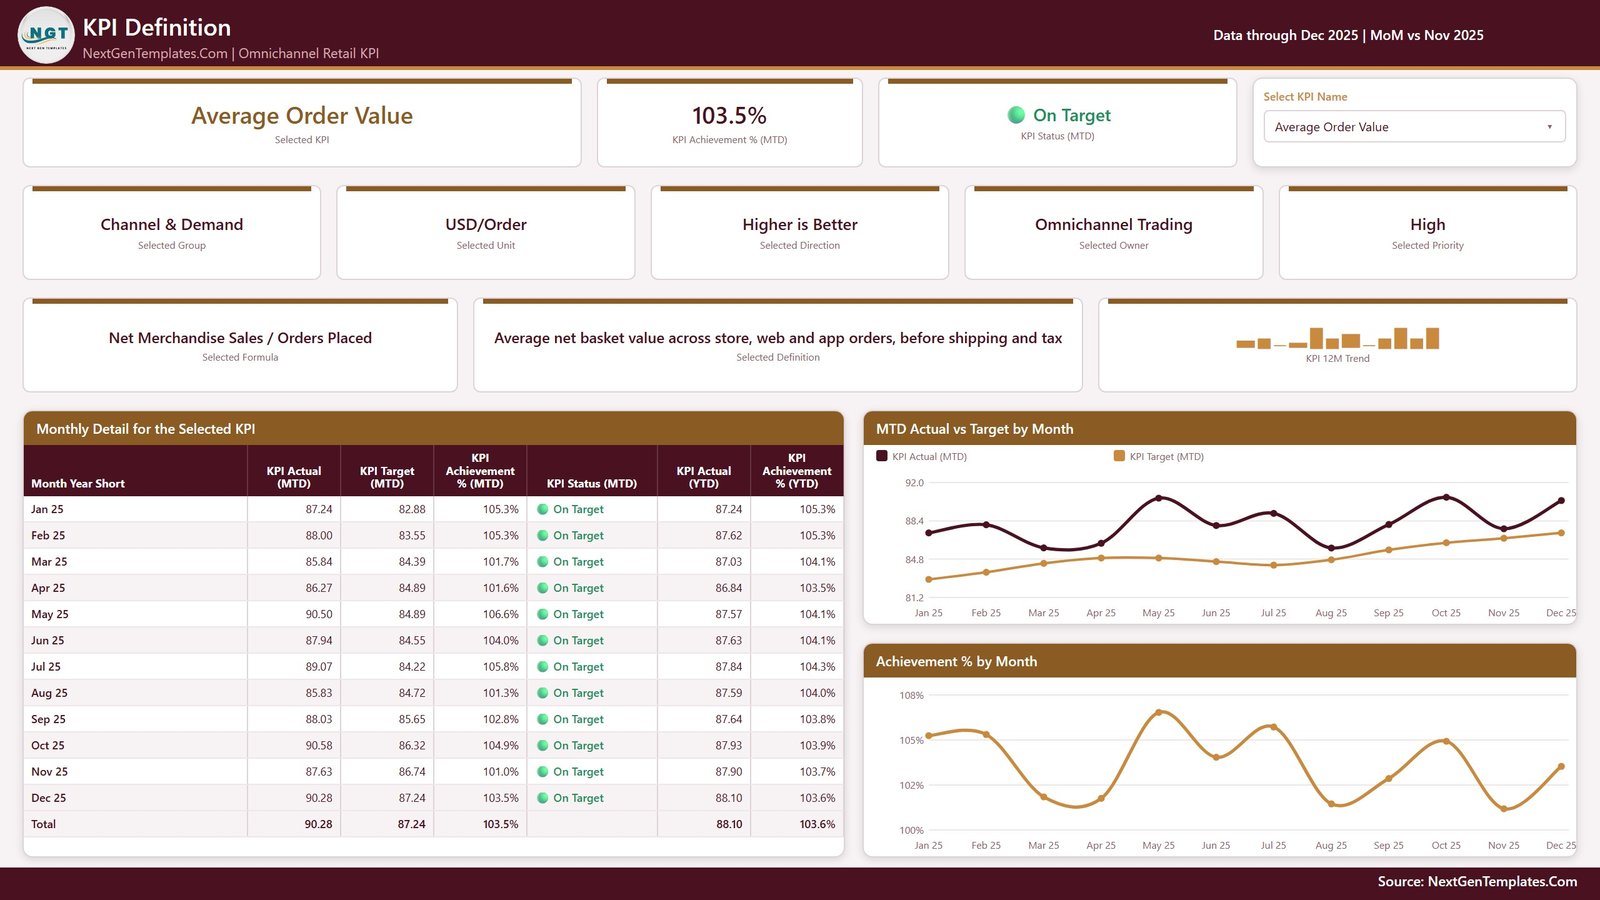
The definition page connects the number to its operating meaning. For the selected KPI it shows the formula, business definition, group, unit, direction, owner, and priority. A monthly detail table lists actual, target, achievement, status, and YTD result, while two charts show MTD actual versus target and achievement percentage over time.
That KPI dictionary is valuable during review meetings. “Stockout rate” or “on-time delivery” can mean different things in different companies. The template lets the buyer replace the supplied definition with an approved internal definition instead of treating the demo wording as universal.
Get More Templates
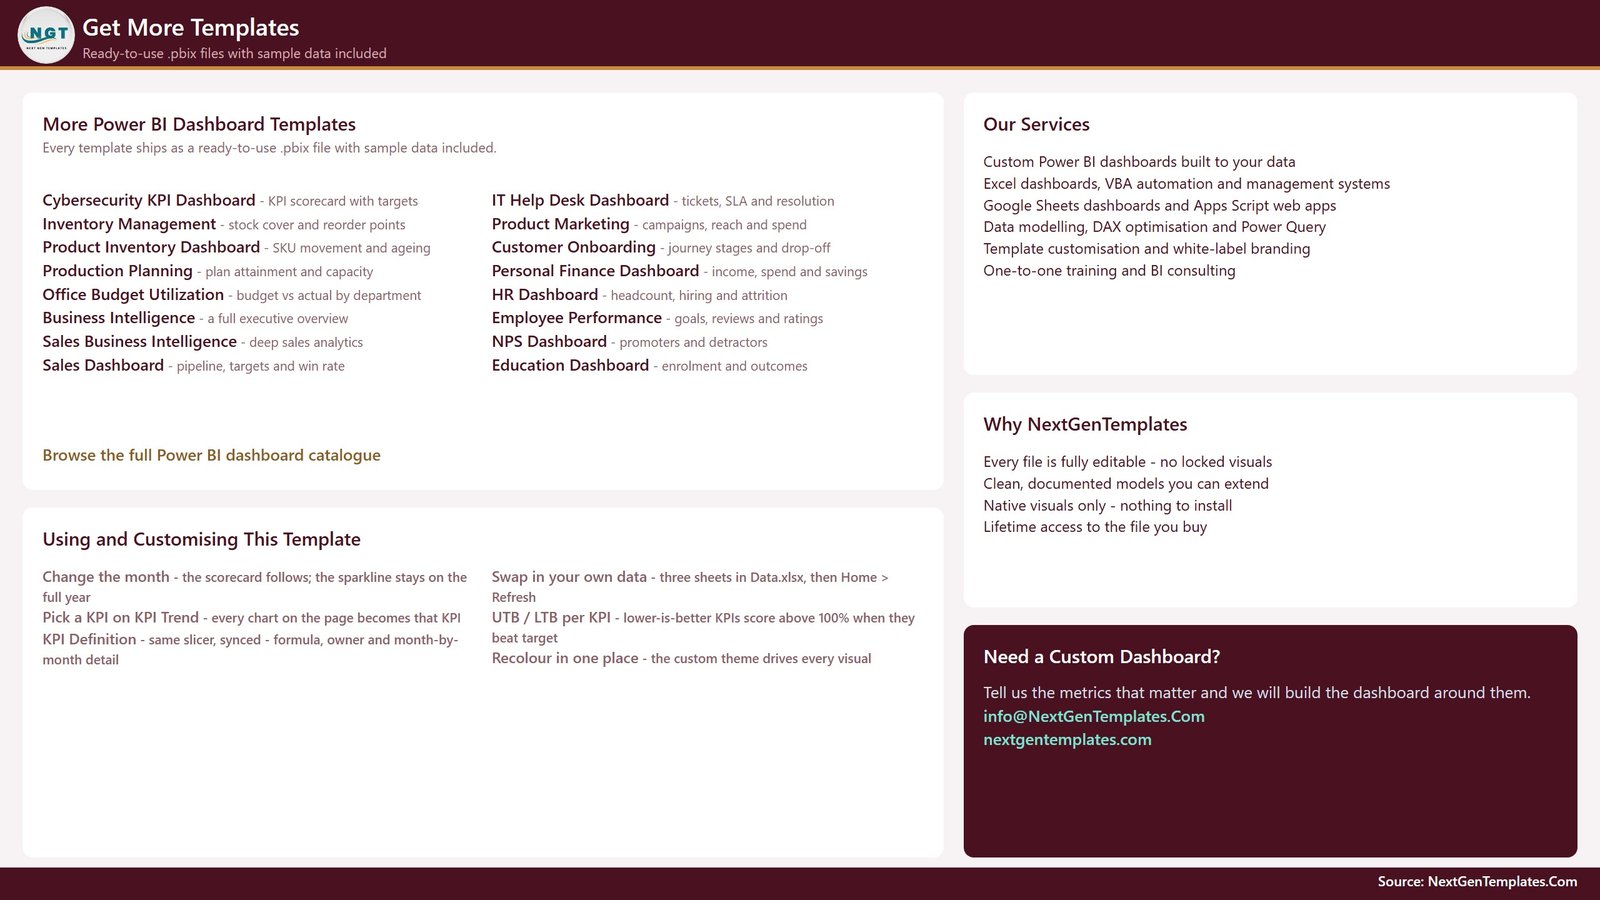
The fourth visible page is a resource and handover page. It reminds users how to change the month, select a KPI, refresh the model, and apply the UTB/LTB scoring convention. It also links to related Power BI dashboard families and customisation services.
Omnichannel Retail KPI Dashboard in Power BI vs. Google Sheets vs. Paid Retail BI – Feature Comparison
| Feature | This Power BI template | Google Sheets template | Paid retail BI/SaaS |
|---|---|---|---|
| Commercial model | One-time purchase | One-time purchase | Usually recurring licence |
| Primary experience | Interactive desktop BI report | Browser spreadsheet | Hosted vendor application |
| Initial setup | Replace Excel inputs, refresh PBIX | Make a copy, enter data | Configure and integrate systems |
| Target status | Direction-aware MTD/YTD traffic lights | Formula and conditional-format driven | Depends on product and plan |
| Trend analysis | Current year, prior year, target | Spreadsheet charts | Usually available |
| Custom KPI definitions | Edit source workbook and model | Edit worksheet | May require admin or consultant |
| Live operational feeds | Not included | Not included | Often available |
| Team sharing | Requires your Power BI environment | Native link sharing | Usually built in |
| Year-one cost at 5 users | Template price plus any Microsoft licensing | Template price plus Workspace if used | Vendor-specific recurring total |
For buyers who want the same topic in a browser spreadsheet, see the Omnichannel Retail KPI Dashboard in Google Sheets. It is a separate build, not a duplicate file. For broader exploratory retail charts without this scorecard structure, the Retail Dashboard in Power BI is the analytical alternative.
Who Should Use This Template
Omnichannel trading managers can review BOPIS adoption, cross-channel customer share, average order value, and returns together. Fulfilment leaders can focus on ship-from-store rate, on-time delivery, mis-picks, and click-to-door cycle time. Inventory-control and merchandise teams can track record accuracy, stockouts, and GMROI. Retail analysts and consultants can adapt the KPI dictionary and deliver a repeatable review pack.
It is not the right fit for a team expecting transactions to flow automatically from Shopify, Magento, a POS, an order-management platform, or a warehouse system. It is also not a substitute for customer-level analytics, demand forecasting, replenishment logic, or a governed enterprise semantic model.
Real-World Use Cases
Monthly Business Review
A retail director filters to December, reviews target-met and missed counts, and asks each named owner to explain movement against target and prior year.
Fulfilment Exception Review
The fulfilment team filters the Fulfilment group and separates current-month exceptions from YTD patterns across on-time delivery, mis-picks, cycle time, and ship-from-store activity.
Inventory and Trading Alignment
Merchandise planning and inventory control examine stockout rate, inventory accuracy, GMROI, average order value, and cross-channel customer share without maintaining separate slide decks.
Advantages of Omnichannel Retail KPI Dashboard in Power BI
The main advantage is focus. The report does not try to recreate an entire retail platform. It gives each KPI a definition, direction, target, owner, priority, status, and time trend. That structure is useful when the operating conversation is “Are we on target, why, and who owns the next action?”
The source model is also transparent. Data.xlsx contains a Read Me sheet plus KPI Definition, Input_ Target, and Input_ Actual. The actual sheet covers the reporting year and the previous year; the target sheet covers the reporting year. Rate, ratio, index, and days-based YTD values are averaged rather than summed, avoiding meaningless accumulated percentages.
Opportunities for Improvement
The included source is an Excel workbook, so the report is not real-time out of the box. A production deployment may benefit from Power Query connections to a governed database or dataflow, scheduled refresh, row-level security, certified definitions, alerting, and an owner-approved target process. Microsoft’s Power BI Desktop getting-started guidance is a useful reference for teams new to editing and refreshing PBIX reports.
The supplied KPI set is deliberately generic. Retailers should review whether BOPIS, GMROI, NPS, delivery promise, returns value, and inventory accuracy match their own systems and accounting definitions. Changing the label alone is not enough; formulas, units, direction, target cadence, and source grain should all be validated.
Best Practices
- Keep a controlled KPI dictionary with one approved name for each measure.
- Use the same KPI name in all three source sheets because it acts as the join key.
- Confirm whether every metric is higher-is-better or lower-is-better.
- Do not present the sample targets as benchmarks; replace them before a business review.
- Validate YTD logic for additive values versus rates, ratios, indexes, and days.
- Reconcile a small set of KPIs back to the source system after every model change.
- Document refresh ownership and the reporting cut-off date.
- Publish and share only through a Power BI workspace that meets your licensing and governance needs.
Explore Relevant Templates
- Omnichannel Retail KPI Scorecard in Excel
- Out-of-Stock Rate KPI Dashboard in Power BI
- Shelf Space Utilization KPI Dashboard in Power BI
- RetailTech Dashboard in Excel
Browse the full Power BI KPI Dashboard catalogue for more scorecard topics.
Frequently Asked Questions
Does the dashboard connect directly to retail systems?
No. The included data source is Data.xlsx. You can build other connections separately in Power BI.
Can I change the 13 KPIs?
Yes. Add, rename, or remove KPIs while keeping the definition, target, and actual sheets aligned.
Are the KPI formulas guaranteed standards?
No. They are practical sample definitions. Approve them against your organisation’s policies and systems before use.
Can lower-is-better metrics show green when actual is below target?
Yes. The direction-aware achievement logic reverses the ratio for LTB metrics.
Is Power BI Desktop free?
Microsoft offers Power BI Desktop for report creation. Publishing, sharing, and service features depend on your Microsoft licensing.
Can I share the PBIX with my team?
You can use it within your organisation or client engagement under the product licence, but you may not resell or redistribute the template itself.
Is this the same as the Google Sheets version?
No. It covers the same business topic in a different platform and delivery model.
About the Author
Built by PK – Microsoft Certified Professional with 15+ years of Excel, Google Sheets, and Power BI experience. Founder of NextGenTemplates, reaching 300K+ subscribers across YouTube channels. Every template is hand-built and tested before release.
Conclusion
The Omnichannel Retail KPI Dashboard in Power BI is a practical starting point for a target-led retail review. It combines a 13-KPI scorecard, trend investigation, definitions, owners, priorities, and editable inputs without claiming to replace your operational systems. If that is the reporting layer you need, get the Omnichannel Retail KPI Dashboard in Power BI, replace the sample data with your approved figures, and refresh.
For more Excel and Power BI tutorials, visit PK-AnExcelExpert on YouTube.
Last updated: August 18, 2026.