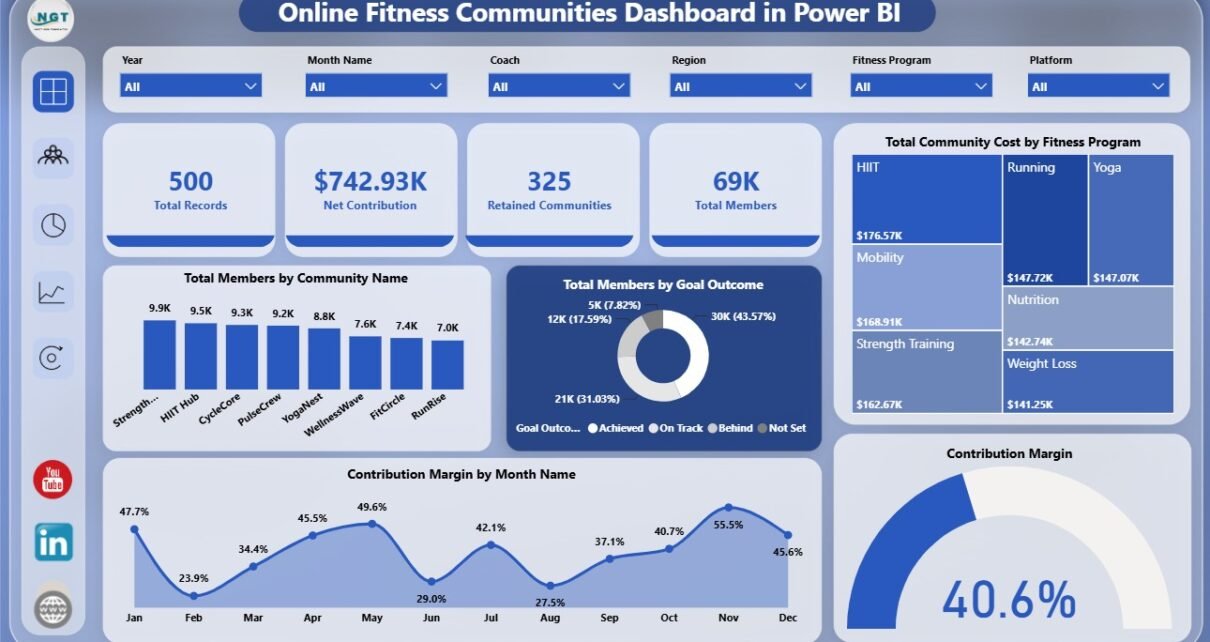
Online Fitness Communities Dashboard in Power BI is a ready-to-use .pbix template for tracking online fitness communities, members, subscription revenue, community cost, contribution margin, activity, and retention in one interactive report. Instead of reviewing separate exports for communities, programs, platforms, member segments, and regions, this dashboard brings the key metrics into 5 Power BI pages, 4 high-level KPI cards, multiple slicers, and 18 analysis visuals Online Fitness Communities Dashboard in Power BI.
Online fitness communities often depend on recurring subscriptions, program engagement, member retention, and community activity. If those numbers are reviewed manually, it becomes difficult to see which communities are growing, which programs are profitable, and where retention needs attention. This Power BI dashboard gives operators a faster way to review those signals and share them with the team.
For Power BI setup and publishing basics, you can also refer to the official Microsoft Power BI documentation.
Key Features of Online Fitness Communities Dashboard in Power BI
- 5 report pages for Overview, Community View, Member Mix, Program Trends, and Retention.
- 4 KPI cards on the Overview page: Total Records, Net Contribution, Retained Communities, and Total Members.
- Multiple slicers for quick filtering across the dashboard.
- Revenue and margin analysis by community, region, platform, fitness program, and month.
- Member mix reporting by age group, membership tier, signup channel, and retention status.
- Program trend views for active communities, activity status, subscription revenue, and contribution margin.
- Editable Power BI file so users can adjust visuals, fields, colors, and report pages.
Dashboard Pages Explanation
1. Overview Page
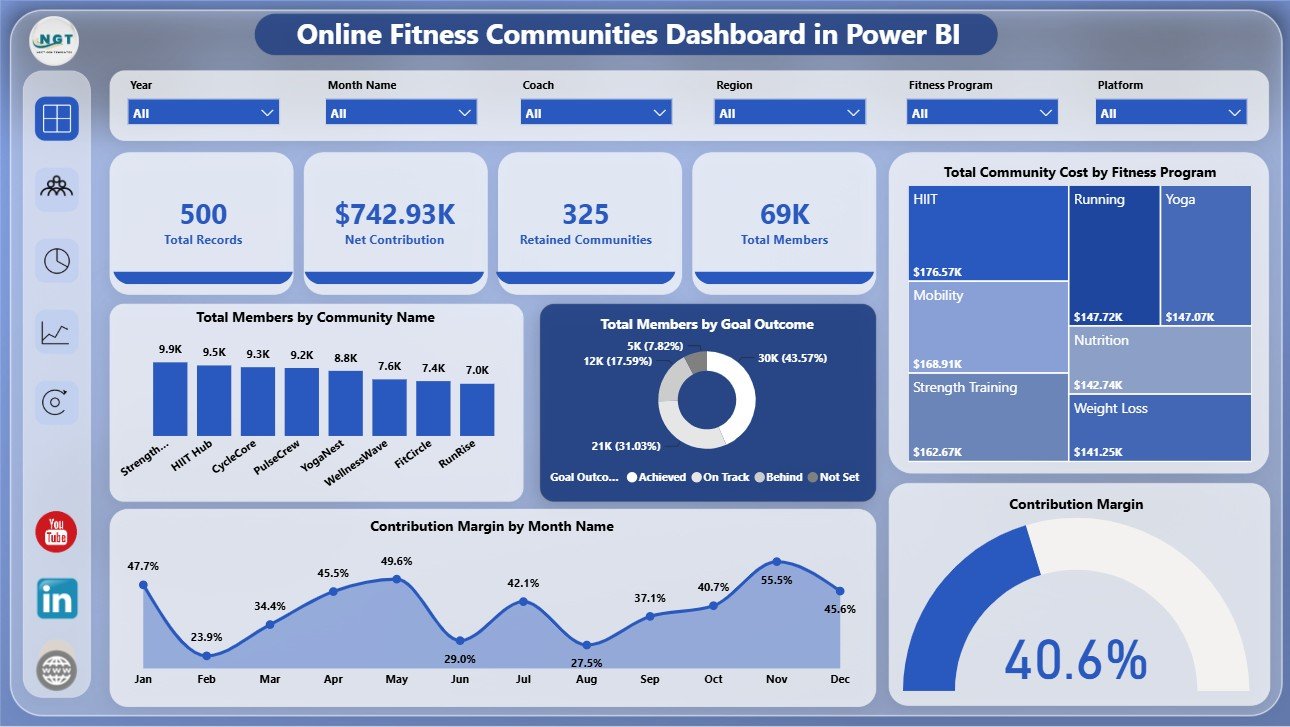
The Overview Page is the executive summary of the report. The top cards show Total Records, Net Contribution, Retained Communities, and Total Members, helping users quickly understand the size and financial contribution of the community dataset.
Total Members by Community Name: This chart compares member volume across each community. It helps managers identify the largest communities and find groups that may need more acquisition or engagement support.
Total Members by Goal Outcome: This visual groups members by the outcome they achieved. It helps teams understand whether the fitness programs are creating visible progress for members.
Total Community Cost by Fitness Program: This chart shows which fitness programs carry the highest cost. It is useful for budget review, pricing checks, and program-level cost control.
Contribution Margin by Month Name: This trend shows how contribution margin changes month by month. It helps identify stronger months, weaker months, and seasonal movement.
Contribution Margin by Selected Filters: This visual updates as slicers are applied. It helps users review margin for a chosen segment, community, platform, region, or fitness program.
2. Community View
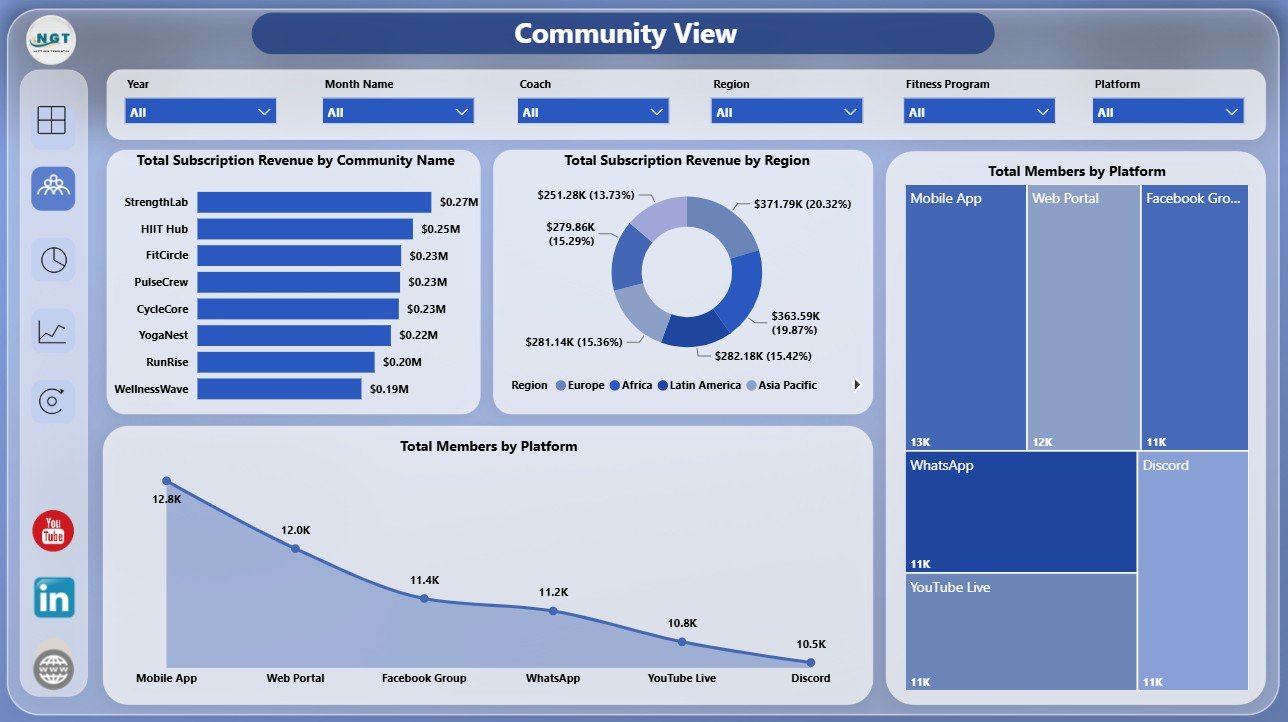
The Community View page focuses on community-level performance and platform distribution.
Total Subscription Revenue by Community Name: This chart compares subscription revenue across individual communities. It helps leaders see which communities are generating the most income.
Total Subscription Revenue by Region: This chart shows subscription revenue by region. It supports market-level review and helps identify strong or weak regions.
Total Members by Platform: This visual compares member volume across platforms. It helps teams understand where members are most concentrated.
3. Member Mix
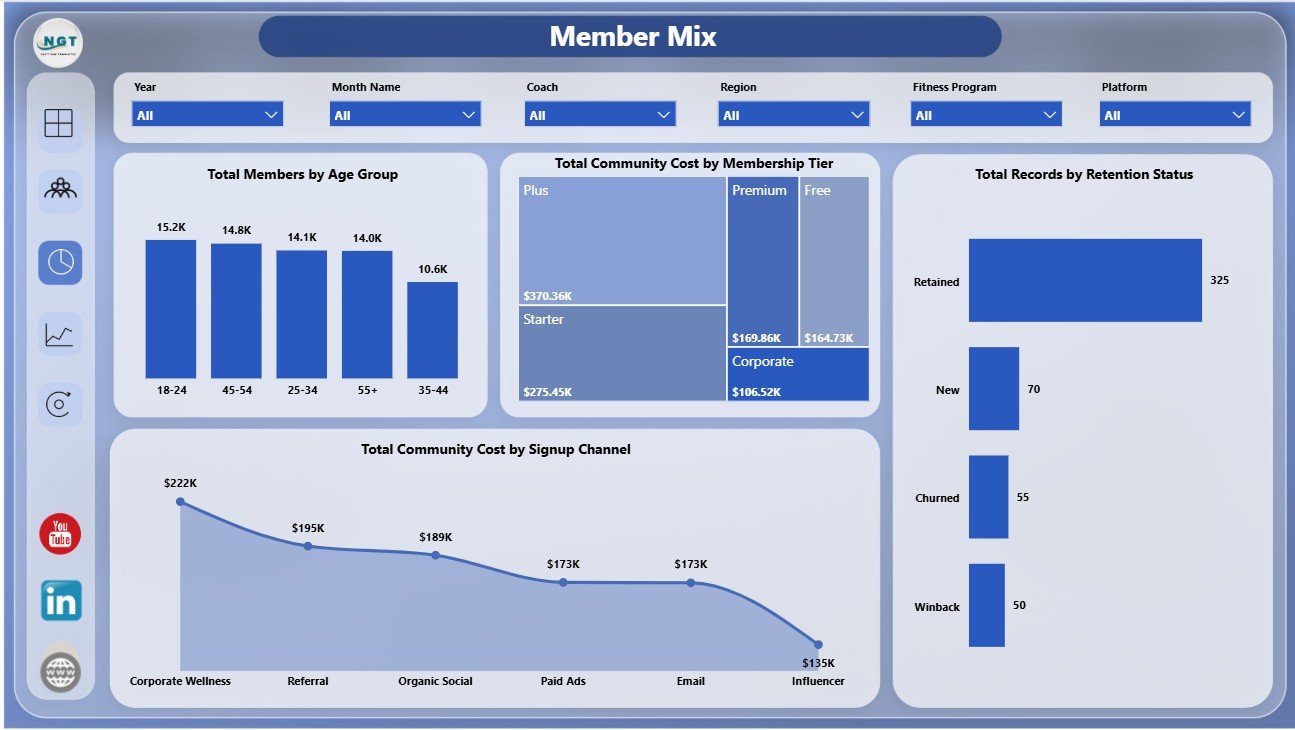
The Member Mix page explains how member segments are distributed and how they affect costs and retention.
Total Members by Age Group: This chart shows the age distribution of members. It helps operators understand the audience profile of the community.
Total Community Cost by Membership Tier: This visual compares cost across membership tiers. It supports tier-level pricing, margin, and cost discussions.
Total Records by Retention Status: This chart separates records by retention status. It helps users quickly monitor retained and non-retained groups.
Total Community Cost by Signup Channel: This visual shows community cost by acquisition channel. It helps growth teams compare the cost impact of different signup sources.
4. Program Trends
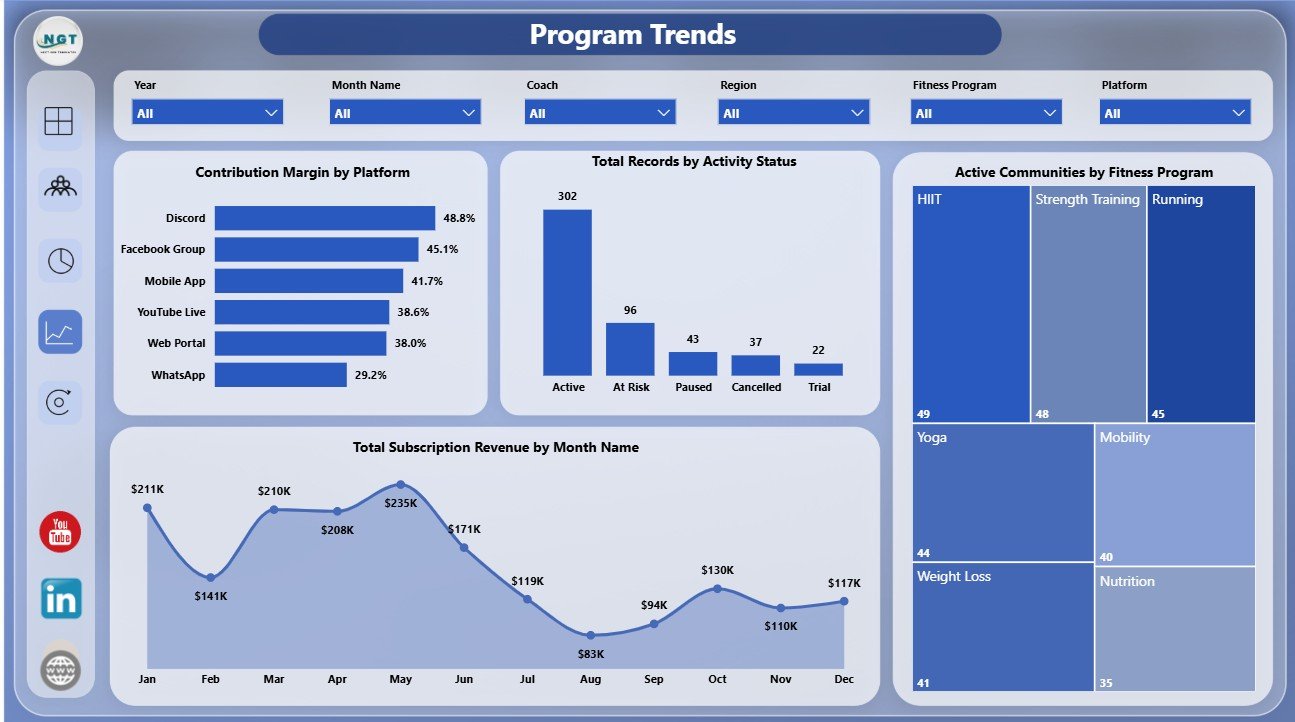
The Program Trends page shows how performance moves across platforms, activity status, fitness programs, and months.
Contribution Margin by Platform: This chart compares margin across platforms. It helps teams understand which delivery channels are more profitable.
Total Records by Activity Status: This visual shows the split between active and inactive records. It helps managers review participation health.
Active Communities by Fitness Program: This chart compares active communities by program. It helps identify programs with stronger ongoing participation.
Total Subscription Revenue by Month Name: This chart shows monthly subscription revenue. It helps teams review growth, seasonality, and revenue movement.
5. Retention
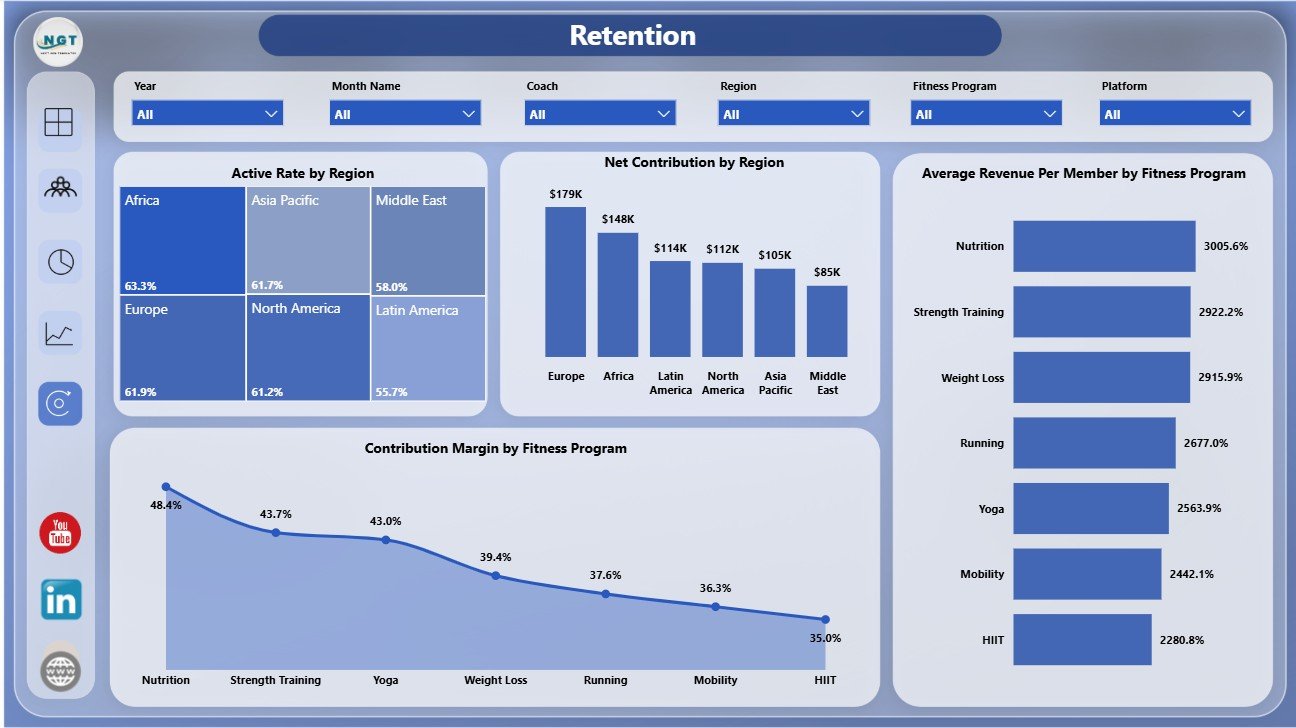
The Retention page focuses on active rate, net contribution, revenue per member, and contribution margin.
Active Rate by Region: This chart compares active participation by region. It helps managers find regions with stronger engagement.
Net Contribution by Region: This chart shows contribution after costs by region. It helps finance teams compare profitability across markets.
Average Revenue Per Member by Fitness Program: This visual compares revenue per member across fitness programs. It helps teams understand program monetization.
Contribution Margin by Fitness Program: This chart compares program profitability. It helps identify programs that may need pricing, cost, or engagement review.
Online Fitness Communities Dashboard in Power BI vs. Tableau vs. Paid CRM/SaaS – Feature Comparison
| Feature | This Power BI Dashboard | Tableau Alternative | Paid Community SaaS |
|---|---|---|---|
| Cost | $17.99 one-time | License plus dashboard build work | Monthly or annual subscription |
| Platform | Power BI Desktop | Tableau Desktop or Cloud | Vendor cloud system |
| Setup time | Open file, connect data, refresh | Build or customize workbook | Onboarding and configuration required |
| Collaboration | Available after publishing to Power BI Service | Available through Tableau Cloud | Usually included by plan |
| Customizable fields | Editable visuals, pages, and model | Editable if you own the workbook | Often limited by vendor settings |
| Year-1 cost at 5 users | $17.99 plus any Microsoft licensing | Usually much higher | Often hundreds or thousands |
| Fitness community analytics | 5 ready report pages | Requires custom design | Depends on plan and export access |
Who Should Use This Template
This template is useful for online fitness community owners, virtual coaching teams, subscription fitness businesses, program managers, community analysts, finance teams, and consultants who already collect community, member, revenue, cost, activity, and retention data.
Real-World Use Cases
Community manager: Review retained communities, members, activity status, and goal outcomes before a weekly operating meeting.
Fitness founder: Compare subscription revenue, program cost, and contribution margin to decide which programs deserve more marketing attention.
Subscription analyst: Filter by platform, region, age group, membership tier, and signup channel to understand what drives revenue per member.
Advantages of Online Fitness Communities Dashboard in Power BI
The main advantage is speed. The page structure, cards, visuals, and slicers are already built, so users can focus on replacing the sample data and reviewing insights. Because the report is built in Power BI, users can also customize visuals, publish to Power BI Service, and combine the template with other reporting workflows.
Opportunities for Improvement
This template is not a live community management system or automatic payment connector. Teams that need real-time billing, chat analytics, mobile app events, or API-based refresh may need to connect additional data sources or extend the model. The template is best used when the source data is already clean and export-ready.
Best Practices
- Keep your data columns consistent with the sample structure before refreshing.
- Validate totals after connecting your own source data.
- Use slicers during review meetings instead of duplicating pages for every segment.
- Publish to Power BI Service only after checking privacy, sharing, and workspace permissions.
- Document any custom DAX measures you add.
Explore Relevant Templates
You can download the draft product here: Online Fitness Communities Dashboard in Power BI. Related templates include Online Fitness Communities Dashboard in Excel, Fitness Apps Dashboard in Power BI, and Gym Retention Dashboard in Power BI.
Frequently Asked Questions
What is included in the dashboard?
The dashboard includes 5 Power BI pages, 4 KPI cards, multiple slicers, and charts for members, revenue, cost, margin, program trends, retention, platform, region, signup channel, and activity status.
Do I need Power BI Desktop?
Yes. Power BI Desktop is required to open and edit the .pbix file.
Can I customize the visuals?
Yes. You can change pages, visuals, fields, colors, slicers, and measures in Power BI Desktop.
Can I publish the report online?
Yes, you can publish it to Power BI Service if your Microsoft account and workspace permissions support publishing.
Does it replace community software?
No. It is a reporting dashboard for prepared data, not a member portal, billing platform, chat system, or workout delivery app.
About the Author
Built by PK – Microsoft Certified Professional with 15+ years of Excel, Google Sheets, and Power BI experience. Founder of NextGenTemplates, reaching 300K+ subscribers across YouTube channels. Every template is hand-built and tested before release.
Conclusion
The Online Fitness Communities Dashboard in Power BI gives fitness community teams a structured way to review members, revenue, costs, contribution margin, program trends, and retention. It is a practical reporting layer for teams that already have community data and want faster Power BI analysis without building a full dashboard from a blank file.
For more tutorials, visit YouTube.com/@PKAnExcelExpert.