The world of education has changed dramatically with the rise of digital learning. Online learning platforms are now the backbone of modern education, helping institutions, tutors, and students connect across the globe. But as these platforms grow, so does the need to measure their success effectively.
That’s where the Online Learning Platforms KPI Dashboard in Excel comes into play. This ready-to-use and fully customizable Excel template helps you track key performance indicators (KPIs) for online education platforms — all in one place.
Whether you’re managing a small tutoring service or a global e-learning organization, this dashboard helps you make smart, data-backed decisions with ease.
💡 What Is an Online Learning Platforms KPI Dashboard in Excel?
An Online Learning Platforms KPI Dashboard is a performance-tracking tool designed to monitor the effectiveness of e-learning systems. Built in Microsoft Excel, it gathers key data from multiple sources — such as enrollments, student performance, revenue, and engagement metrics — and turns them into easy-to-read visuals.
Instead of juggling multiple reports, you can use this dashboard to view real-time insights about your platform’s performance and identify areas that need improvement.
This dashboard acts as the command center for your online education ecosystem — combining operational, academic, and financial KPIs in one smart Excel template.
Click to Purchases Online Learning Platforms KPI Dashboard in Excel
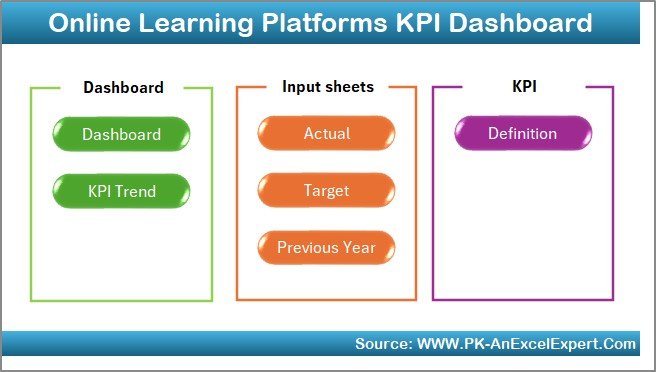
🧩 Structure of the Online Learning Platforms KPI Dashboard in Excel
The dashboard consists of seven essential worksheets, each designed to simplify data entry, analysis, and visualization.
1️⃣ Home Sheet — Your Navigation Hub
The Home Sheet serves as the main navigation page for the entire dashboard.
It includes six interactive buttons that allow users to jump to key sheets like Dashboard, KPI Trend, Actual Data, Targets, Previous Year, and KPI Definition.
This makes it simple for even non-technical users to explore and update the dashboard.
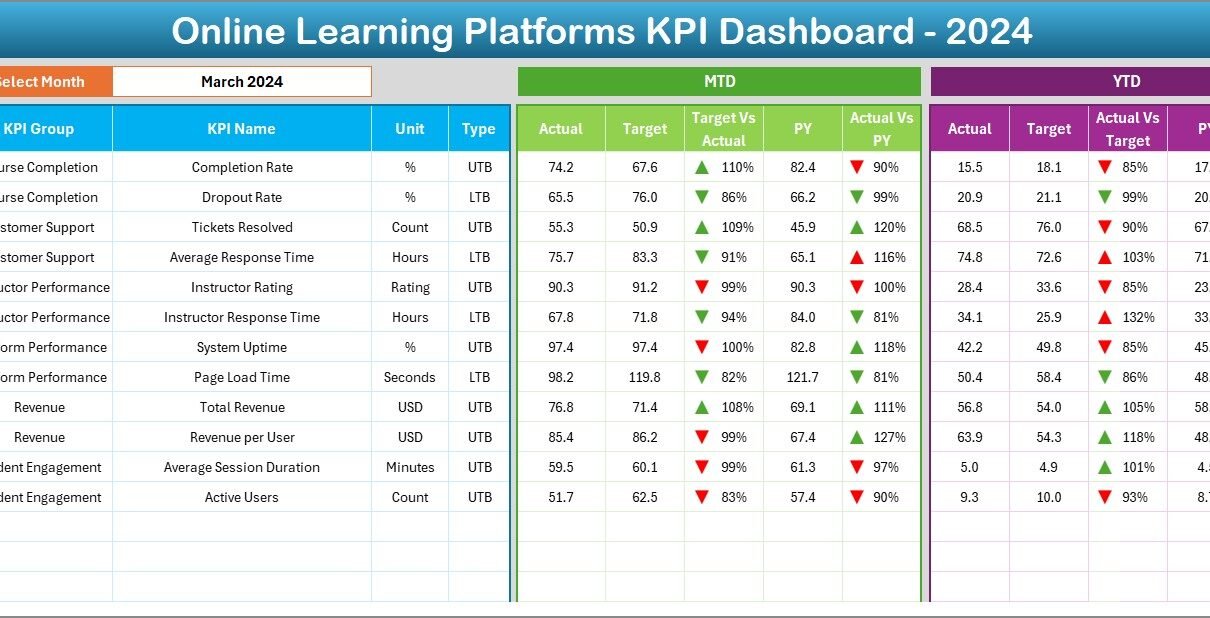
2️⃣ Dashboard Sheet — The Performance Overview
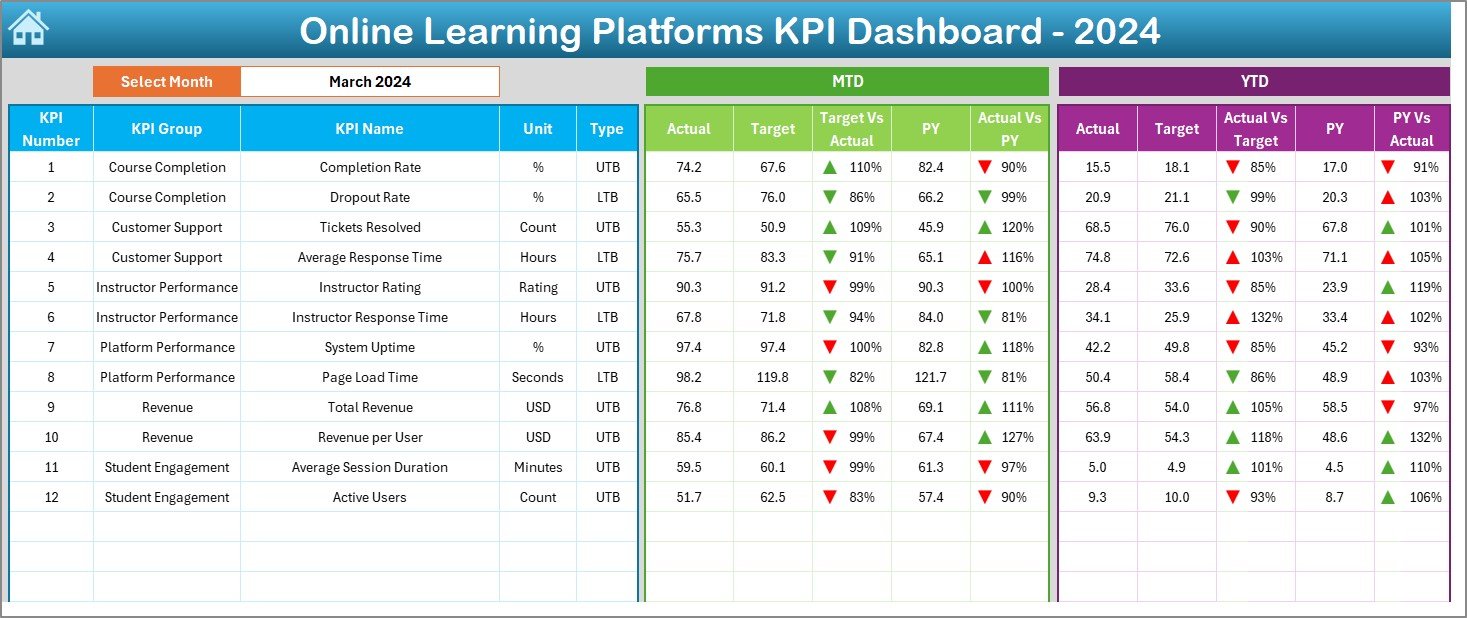
The Dashboard Sheet is where the magic happens.
Here, you can select any month from the drop-down in cell D3, and instantly view updated results for all KPIs.
Displayed Metrics:
-
📊 Month-to-Date (MTD): Actual, Target, and Previous Year data
-
📈 Year-to-Date (YTD): Consolidated results across months
-
🎯 Variance Analysis: Target vs Actual and PY vs Actual values with conditional formatting
-
🟢 Visual Indicators: Up/down arrows and color-coded performance markers
This visual interface gives a complete picture of your platform’s performance at a glance.
3️⃣ KPI Trend Sheet — Analyzing Growth Patterns
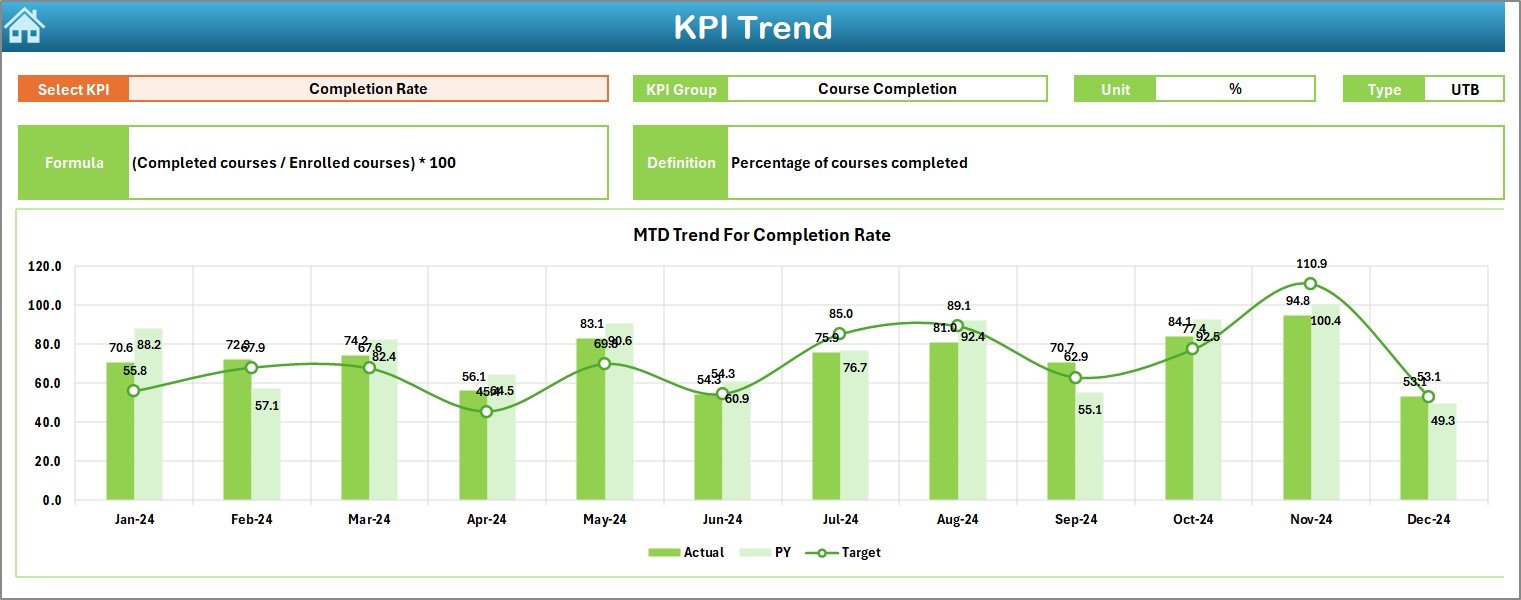
The KPI Trend Sheet helps you dive deeper into the data.
You can select any KPI name from the drop-down (cell C3) to view its detailed information, including:
-
KPI Group (Enrollment, Engagement, Financial, etc.)
-
Unit of Measurement
-
KPI Type (LTB – Lower the Better or UTB – Upper the Better)
-
Formula
-
Definition
At the bottom, MTD and YTD trend charts visualize Actual vs Target vs Previous Year performance, helping you identify positive trends and improvement areas quickly.
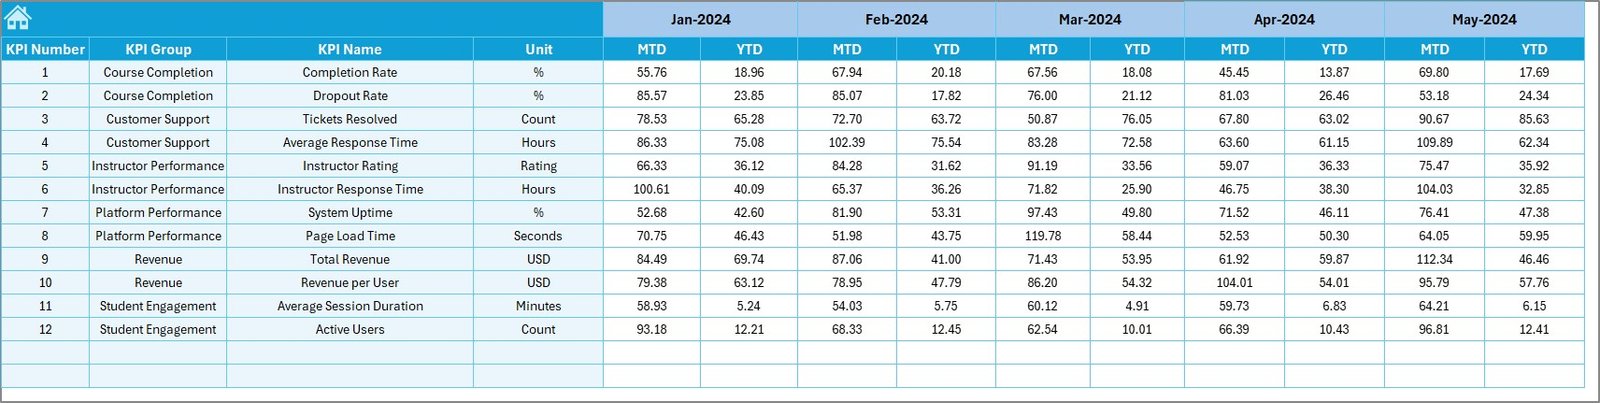
4️⃣ Actual Numbers Input Sheet — Entering Real Data
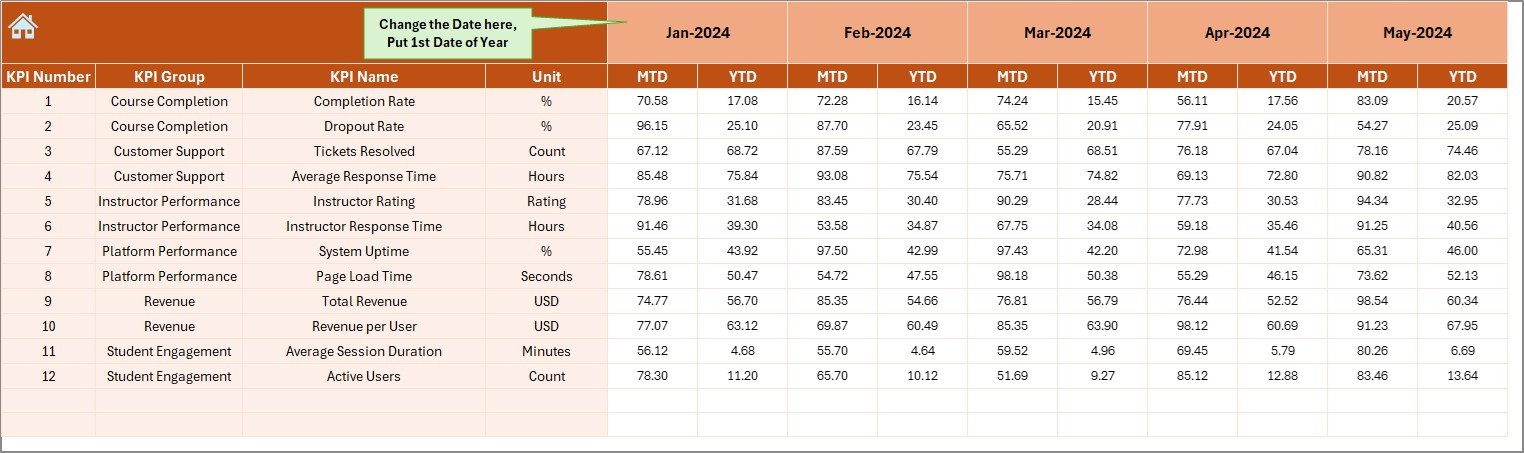
The Actual Numbers Input Sheet is the backbone of the dashboard.
This is where you enter your platform’s performance figures — such as monthly enrollment, revenue, completion rates, or student engagement metrics.
At the top (cell E1), you can set the starting month of your reporting year. Once data is entered, it automatically reflects in other sheets, ensuring that all calculations and visuals stay updated.
5️⃣ Target Sheet — Defining Your Goals
The Target Sheet is where you record your monthly and yearly performance targets.
Targets can include desired revenue, student completion rates, average session duration, or user engagement percentages.
By setting clear targets, you establish measurable goals that your organization can aim to achieve.
6️⃣ Previous Year Numbers Sheet — For Yearly Benchmarking
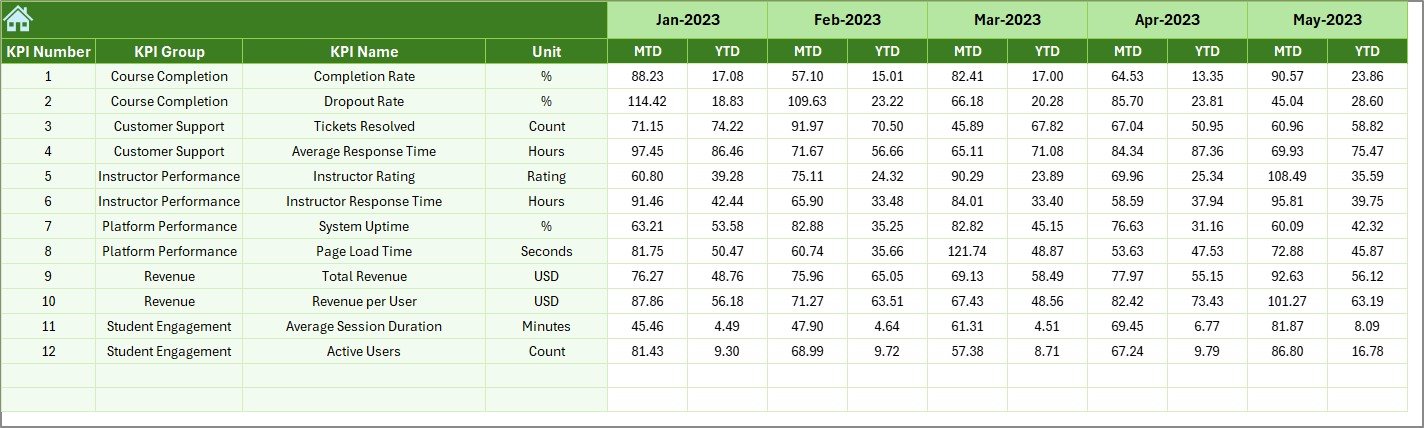
This sheet contains the same KPIs from the previous year.
By comparing this data with current results, you can easily assess growth, identify patterns, and analyze whether your e-learning platform is progressing as expected.
7️⃣ KPI Definition Sheet — The Reference Library
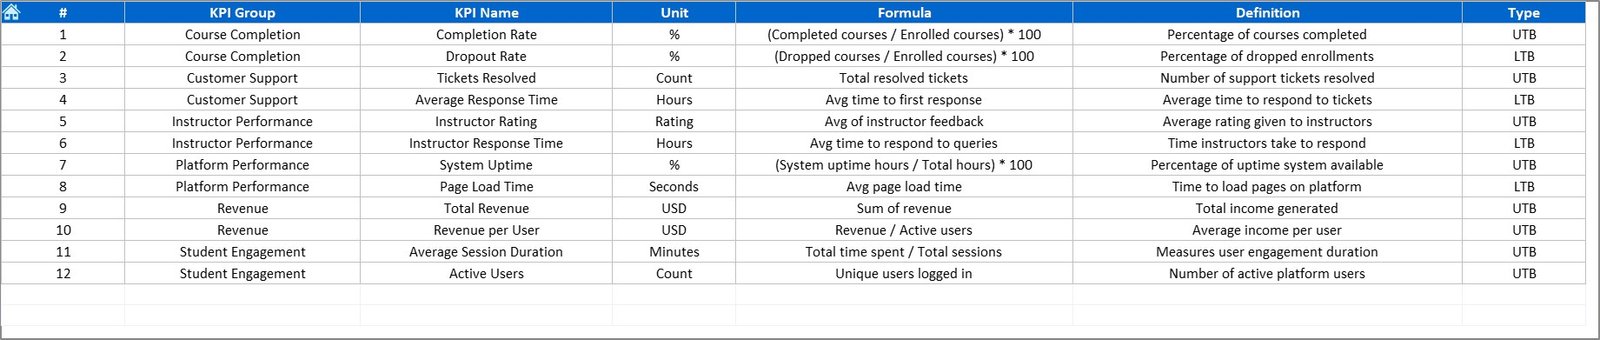
The KPI Definition Sheet provides clear explanations for each KPI.
It includes columns for:
-
KPI Name
-
KPI Group
-
Unit
-
Formula
-
Definition
This section ensures consistency and clarity across teams, especially for new users or departments managing specific data categories.
Click to Purchases Online Learning Platforms KPI Dashboard in Excel
📚 Common KPIs in an Online Learning Platforms Dashboard
To help you get started, here are some commonly used KPIs you can include in your dashboard:
🧑🎓 Student & Course KPIs
-
Total Enrollments
-
Active Students
-
Course Completion Rate (%)
-
Average Student Rating
-
Dropout Rate (%)
-
Certification Rate (%)
💻 Engagement KPIs
-
Average Session Duration
-
Lesson Completion per User
-
Video Watch Percentage
-
Daily Active Users (DAU)
-
Monthly Active Users (MAU)
💰 Financial KPIs
-
Revenue per Course
-
Subscription Retention Rate
-
Cost per Enrollment
-
Profit Margin (%)
-
Refund Rate (%)
📈 Platform Performance KPIs
-
Server Uptime (%)
-
Page Load Time
-
Technical Error Rate
👩🏫 Instructor & Content KPIs
-
Instructor Response Time
-
Average Instructor Rating
-
Number of Active Instructors
-
New Course Launches per Month
All these KPIs can be customized or expanded based on the specific needs of your e-learning platform.
⚙️ How the Online Learning Platforms KPI Dashboard Works
The dashboard works through linked Excel formulas and visual components that make data updates automatic.
Here’s how the process flows:
-
Input your Actual Data monthly in the Input Sheet.
-
Record your Targets for the same period.
-
Add Previous Year Data for reference.
-
The dashboard automatically calculates performance percentages and variances.
-
Visual elements update instantly to show trends, status indicators, and growth patterns.
This creates a fully automated and visually interactive reporting system.
💡 Advantages of the Online Learning Platforms KPI Dashboard in Excel
Implementing this dashboard brings a wide range of benefits for e-learning administrators, educators, and analysts.
1. 📊 Centralized Data Tracking
All essential metrics — from enrollments to earnings — are stored in one easy-to-access file.
2. 📈 Instant Visualization
Conditional formatting and charts make trends and performance instantly visible.
3. 💵 Budget-Friendly Analytics
You don’t need expensive BI tools — Excel provides everything in one package.
4. 🕒 Time Efficiency
Automated formulas eliminate manual reporting and reduce data entry time.
5. 💬 Better Communication
Departments can share performance updates clearly using standardized KPIs.
6. 🧩 Customization Flexibility
Modify KPI categories, formulas, or visuals based on your unique business model.
7. 🌍 Scalable for Growth
As your platform expands, you can easily add new metrics and data fields.
🔍 How to Use the Dashboard Effectively
To get the best results from this Excel dashboard, follow these simple steps:
-
Set Clear Objectives: Define what success looks like for your platform — growth, engagement, or profitability.
-
Choose the Right KPIs: Focus on the metrics that reflect your goals.
-
Keep Data Consistent: Regularly update monthly data and verify accuracy.
-
Review Results Frequently: Analyze the dashboard monthly or quarterly.
-
Use Charts for Decisions: Rely on visuals to guide your strategic choices.
-
Share Reports: Present key findings during team meetings to maintain transparency.
⚡ Real-World Example
Let’s consider a real-world example of how this dashboard works.
An e-learning company called SmartLearn Academy uses the Online Learning Platforms KPI Dashboard to track key business metrics.
-
The Dashboard Sheet displays monthly enrollment trends and student retention rates.
-
The KPI Trend Sheet shows that average session duration has increased by 20% over six months.
-
The Financial KPIs reveal a 15% improvement in profit margins.
-
The Target vs Actual comparison highlights that completion rates are exceeding the target by 8%.
Using these insights, SmartLearn decides to invest more in instructor-led courses — a data-driven move that further boosts engagement.
Click to Purchases Online Learning Platforms KPI Dashboard in Excel
🧭 Best Practices for the Online Learning Platforms KPI Dashboard
Follow these best practices to ensure your dashboard remains efficient and insightful.
✅ 1. Focus on Key Metrics
Avoid overloading your dashboard. Focus on KPIs that truly represent success.
✅ 2. Automate Calculations
Use Excel functions like SUMIFS, AVERAGEIFS, and IFERROR for dynamic updates.
✅ 3. Keep the Layout Clean
Maintain a consistent color scheme and layout for easy interpretation.
✅ 4. Protect Sensitive Data
Lock formula cells and use password protection to prevent unwanted edits.
✅ 5. Update Regularly
Refresh your data monthly or weekly to maintain relevance.
✅ 6. Review Historical Trends
Compare performance with previous years to identify consistent growth patterns.
✅ 7. Train Your Team
Ensure everyone understands how to use and interpret the dashboard.
These practices make your Excel KPI Dashboard a long-term success tool.
🧩 Opportunities for Improvement
To enhance your dashboard further, you can:
-
Add Power BI integration for advanced visualization.
-
Automate data imports using Power Query.
-
Introduce slicers for filtering data by course or instructor.
-
Create pivot charts for flexible reporting.
-
Link to Google Sheets for collaborative work.
These upgrades can help scale your e-learning analytics to a professional level.
🎓 Why This Dashboard Matters
In the world of online education, success depends on understanding your numbers.
This Excel dashboard helps transform large volumes of data into actionable insights — allowing educators and managers to focus on improving learning outcomes, not wrestling with spreadsheets.
It bridges the gap between data and decision-making, making it an invaluable tool for online learning businesses.
🧮 Conclusion
The Online Learning Platforms KPI Dashboard in Excel is more than a reporting tool — it’s a performance powerhouse for digital education.
By providing a structured and visual framework for tracking KPIs, it enables you to monitor progress, evaluate success, and plan strategically.
With this Excel-based dashboard, you can focus on delivering high-quality education while maintaining full visibility over your platform’s growth.
Whether you manage an online school, tutoring business, or corporate training system, this dashboard helps you make smarter, faster, and data-driven decisions.
Click to Purchases Online Learning Platforms KPI Dashboard in Excel
❓ Frequently Asked Questions (FAQs)
1. What is the purpose of the Online Learning Platforms KPI Dashboard?
It helps monitor and analyze the performance of e-learning platforms, covering academic, engagement, and financial KPIs.
2. Is it suitable for all types of online education businesses?
Yes, it works for MOOCs, LMS systems, tutoring platforms, and corporate e-learning portals.
3. Can I modify or add new KPIs?
Absolutely. You can edit formulas and definitions in the KPI Definition sheet as needed.
4. Does it require Excel expertise?
No. It’s designed for all users, and most calculations are automated.
5. How often should I update it?
Monthly updates are recommended for accurate and timely analysis.
6. Can it track both students and instructors?
Yes, the dashboard includes KPIs for both learners and teaching staff.
7. What Excel version is required?
It works perfectly in Excel 2016 or later on both Windows and macOS.
8. Can I visualize long-term performance?
Yes, the KPI Trend Sheet shows MTD and YTD trends for each KPI.
9. Is it compatible with Power BI?
Yes, you can import this Excel file into Power BI for enhanced reporting.
10. How does it benefit online learning institutions?
It offers real-time visibility into performance, supports better planning, and helps maintain continuous improvement.
Click to Purchases Online Learning Platforms KPI Dashboard in Excel
Visit our YouTube channel to learn step-by-step video tutorials