The global demand for organic fertilizers continues to grow rapidly. Farmers, agri-business owners, and fertilizer manufacturers now focus more on sustainability, cost efficiency, and consistent quality. However, tracking performance without a structured system creates confusion and delays decisions. Therefore, businesses increasingly rely on an Organic Fertilizers KPI Dashboard in Excel to gain clarity and control.
An Organic Fertilizers KPI Dashboard in Excel transforms scattered operational data into meaningful insights. Instead of checking multiple Excel sheets or manual reports, decision-makers view all key metrics in one interactive dashboard. As a result, managers act faster, reduce errors, and improve productivity.
In this detailed article, you will learn everything about the Organic Fertilizers KPI Dashboard in Excel. Moreover, this guide explains the dashboard structure, worksheet-wise design, advantages, best practices, and frequently asked questions. Additionally, the language remains simple, clear, and practical so that anyone can implement it confidently.
Click to buy Organic Fertilizers KPI Dashboard in Excel
What Is an Organic Fertilizers KPI Dashboard in Excel?
An Organic Fertilizers KPI Dashboard in Excel is a ready-to-use analytical tool that tracks, analyzes, and visualizes key performance indicators related to organic fertilizer production, sales, cost, quality, and sustainability.
Instead of working with raw numbers, this dashboard converts data into:
- KPI cards
- Trend charts
- Target vs Actual indicators
- Month-to-Date (MTD) and Year-to-Date (YTD) analysis
Because Excel remains widely accessible, businesses of all sizes use this dashboard without investing in complex software. Moreover, users can customize KPIs based on their operational needs.
How Does an Organic Fertilizers KPI Dashboard in Excel Work?
The dashboard works on a simple yet powerful logic. First, users enter data into structured input sheets. Then, Excel formulas and pivot logic process that data. Finally, the dashboard visualizes results dynamically.
Here is how the workflow typically functions:
- Enter actual performance data
- Define monthly and yearly targets
- Add previous year values for comparison
- Select the month from a dropdown
- Instantly view updated KPIs and charts
Because of this structured flow, the dashboard ensures accuracy and consistency. Additionally, it reduces manual effort and reporting time.
What Are the Key Features of the Organic Fertilizers KPI Dashboard in Excel?
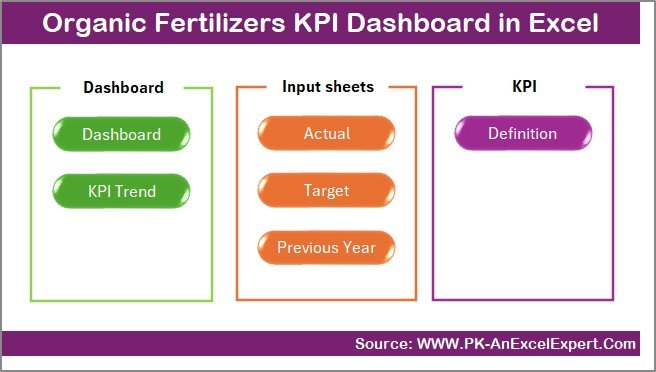
This dashboard includes 7 well-structured worksheets, each designed for a specific purpose. Let us explore them one by one.
Summary Page – How Does the Navigation System Work?
The Summary Page works as an index sheet. It improves usability and navigation.
Key Highlights of the Summary Page
- Clean and simple layout
- Six navigation buttons
- One-click access to all sheets
Because users move easily between sheets, the dashboard feels intuitive even for beginners. Moreover, this structure saves time during presentations and reviews.
Click to buy Organic Fertilizers KPI Dashboard in Excel
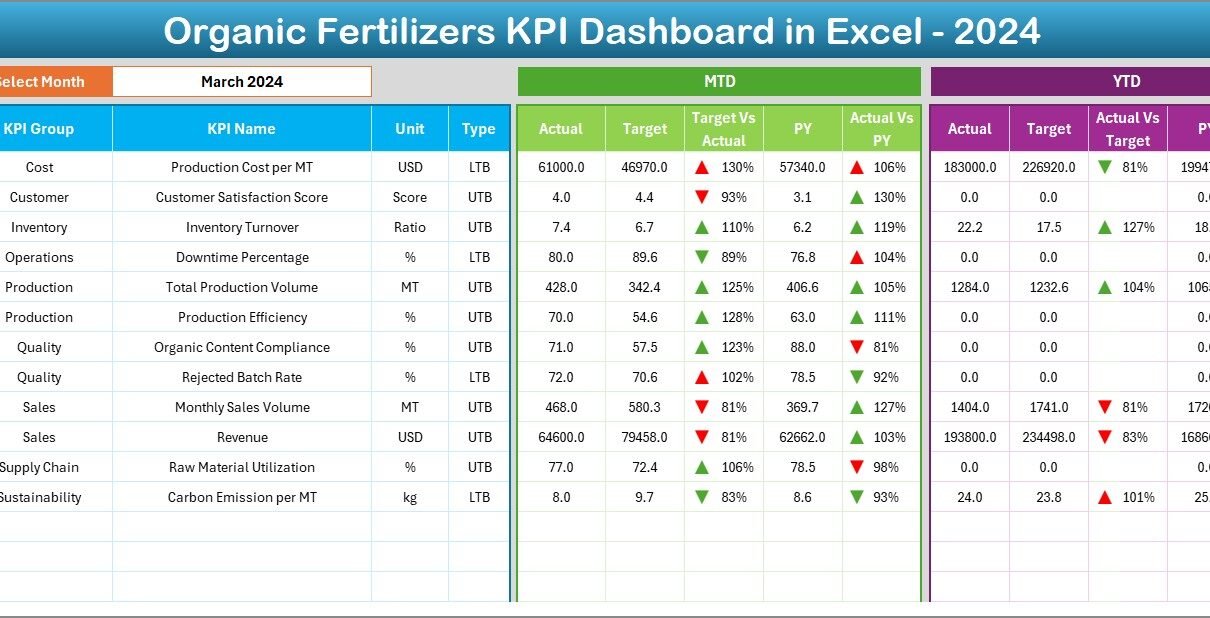
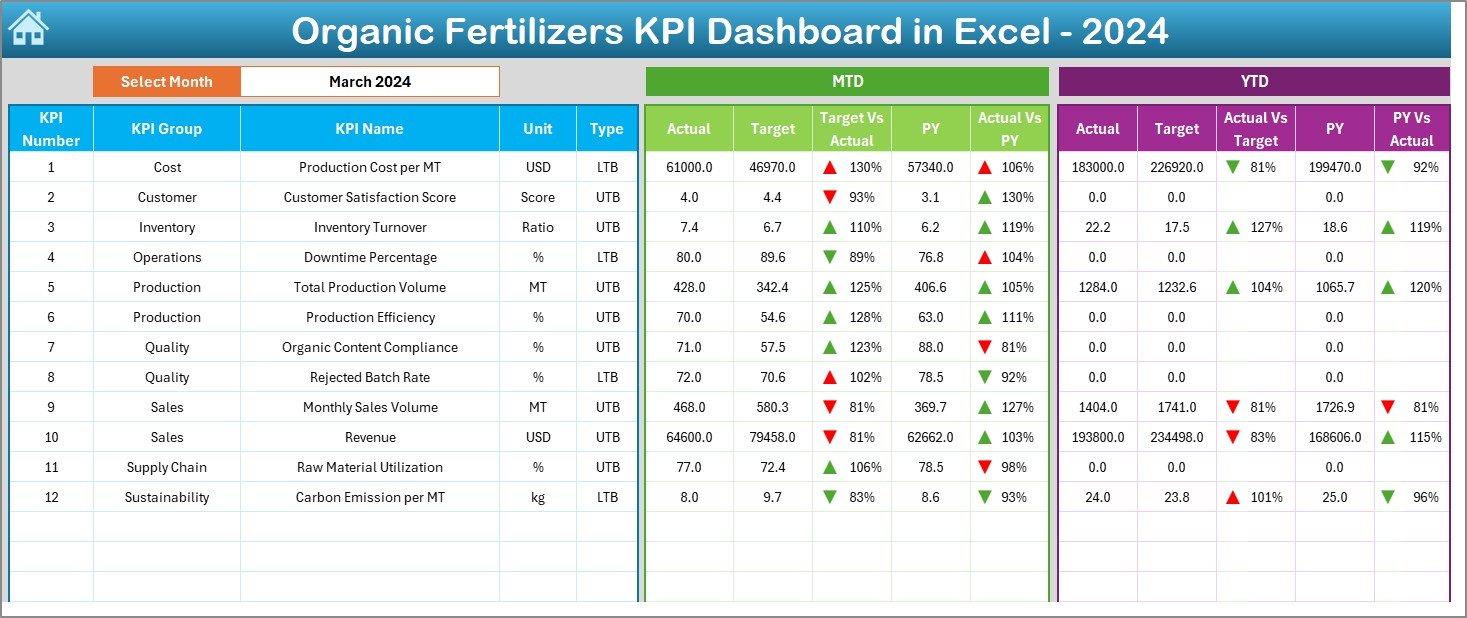
Dashboard Sheet – How Can You Track KPIs in One View?
The Dashboard Sheet serves as the heart of the entire file. It displays all KPIs in a single interactive view.
Month Selection Feature
- Month dropdown located at cell D3
- Changing the month updates the entire dashboard instantly
KPIs Displayed on the Dashboard
- MTD Actual
- MTD Target
- MTD Previous Year
- Target vs Actual comparison
- Previous Year vs Actual comparison
Similarly, the dashboard also displays:
- YTD Actual
- YTD Target
- YTD Previous Year
- YTD Target vs Actual
- YTD PY vs Actual
Visual Enhancements
- Conditional formatting arrows
- Up and down indicators
- Color-based performance signals
Because of these visuals, users quickly identify whether performance improves or declines.
Click to buy Organic Fertilizers KPI Dashboard in Excel
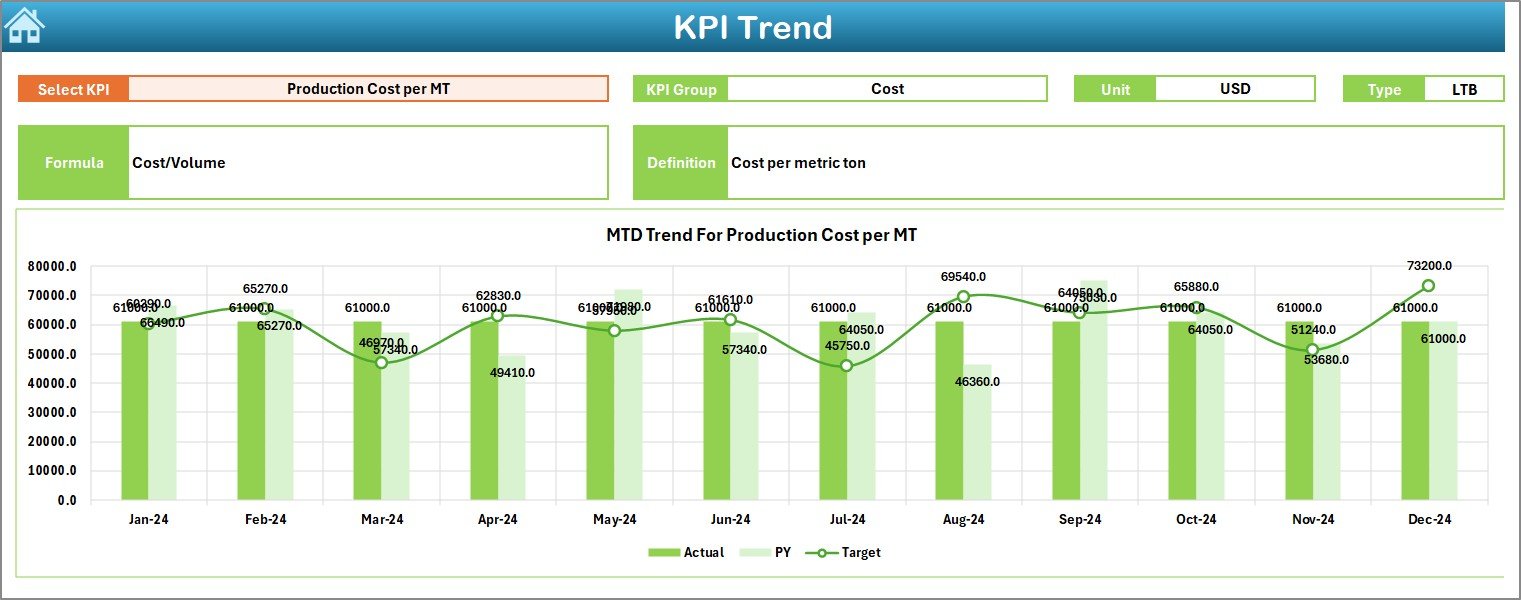
Trend Sheet – How Can You Analyze KPI Trends Over Time?
The Trend Sheet helps users analyze how each KPI performs across months.
Interactive KPI Selection
- KPI dropdown available at cell C3
- Users select one KPI at a time
Detailed KPI Information Display
- KPI Group
- Unit of Measurement
- KPI Type (UTB or LTB)
- Formula
- Definition
Trend Charts Available
- MTD Trend: Actual vs Target vs Previous Year
- YTD Trend: Actual vs Target vs Previous Year
Because of trend analysis, managers understand patterns, seasonality, and performance gaps clearly.
Click to buy Organic Fertilizers KPI Dashboard in Excel
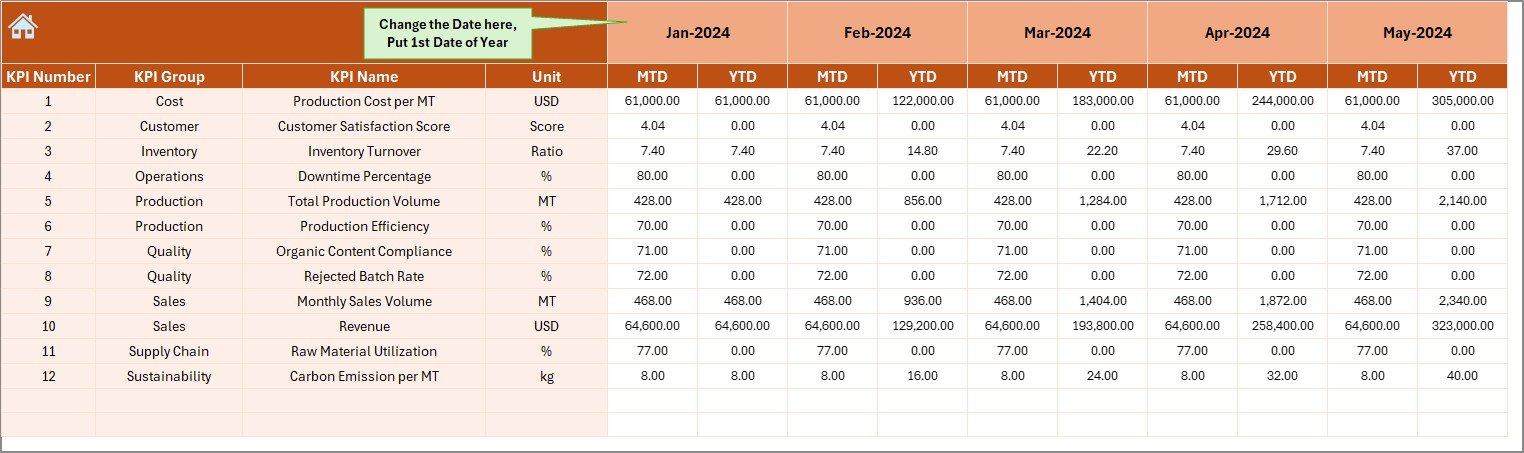
Actual Numbers Input Sheet – How Do You Enter Performance Data?
The Actual Numbers Input Sheet stores real performance data.
How This Sheet Works
- Enter MTD and YTD actual values
- Set the starting month of the year in cell E1
- Update values monthly
Because data entry remains centralized, the risk of inconsistencies reduces significantly.
Click to buy Organic Fertilizers KPI Dashboard in Excel
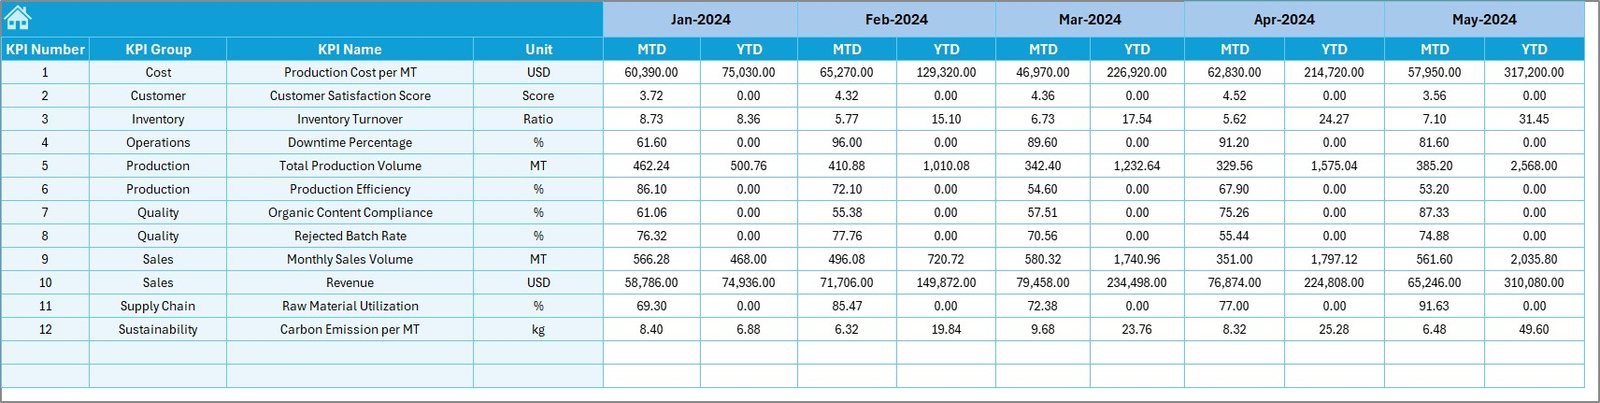
Target Sheet – How Do You Define Performance Goals?
The Target Sheet allows users to define clear expectations.
Key Functions
- Enter monthly MTD targets
- Enter cumulative YTD targets
- Align targets with business goals
Because targets guide performance, this sheet plays a crucial role in KPI tracking.
Click to buy Organic Fertilizers KPI Dashboard in Excel
Previous Year Numbers Sheet – Why Is Historical Comparison Important?
The Previous Year Numbers Sheet stores last year’s data.
Why This Sheet Matters
- Enables year-over-year comparison
- Highlights growth or decline
- Supports strategic planning
By comparing current performance with historical data, businesses make better decisions.
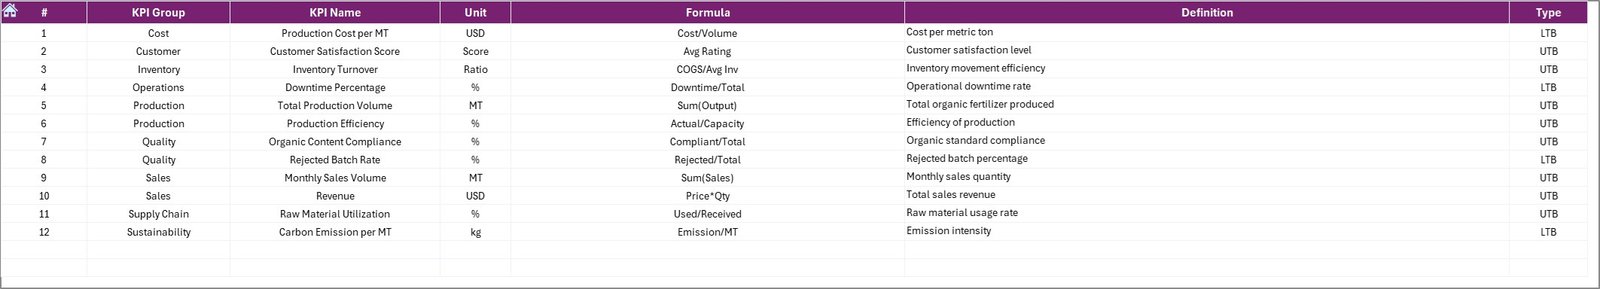
KPI Definition Sheet – How Do You Maintain KPI Clarity?
The KPI Definition Sheet acts as a reference guide.
Information Captured
- KPI Name
- KPI Group
- Unit
- Formula
- Definition
Because of this sheet, everyone interprets KPIs consistently. Moreover, new team members understand metrics without confusion.
Click to buy Organic Fertilizers KPI Dashboard in Excel
Which KPIs Can You Track in an Organic Fertilizers KPI Dashboard in Excel?
You can customize KPIs based on operations. However, common KPIs include:
Production KPIs
- Total Organic Fertilizer Output
- Production Efficiency %
- Batch Yield Rate
Quality KPIs
- Nutrient Consistency %
- Rejection Rate
- Quality Compliance Score
Cost KPIs
- Cost per Ton
- Raw Material Cost %
- Energy Cost per Unit
Sales & Distribution KPIs
- Monthly Sales Volume
- Revenue Growth %
- Distribution Efficiency
Sustainability KPIs
- Waste Reduction %
- Organic Input Ratio
- Carbon Footprint per Unit
Advantages of Organic Fertilizers KPI Dashboard in Excel
- Why Does It Improve Decision-Making?
The dashboard presents real-time insights. Therefore, managers act quickly and confidently.
- How Does It Save Time?
Automation replaces manual reporting. As a result, teams focus more on analysis than data preparation.
- Why Is It Cost-Effective?
Excel eliminates the need for expensive BI tools. Moreover, most organizations already use Excel.
- How Does It Improve Accuracy?
Centralized data entry reduces duplication and errors.
- Why Is It Easy to Customize?
Users can add or modify KPIs without technical expertise.
Best Practices for the Organic Fertilizers KPI Dashboard in Excel
- Define KPIs Clearly
Always maintain clear definitions in the KPI Definition Sheet.
- Update Data Regularly
Enter actuals monthly to keep insights relevant.
- Keep Targets Realistic
Align targets with capacity and market conditions.
- Use Conditional Formatting Wisely
Avoid clutter. Use colors only to highlight performance gaps.
- Review Trends Periodically
Monthly and quarterly trend reviews improve long-term planning.
- Maintain Data Validation
Use dropdowns and validation rules to avoid incorrect entries.
- Backup the File Regularly
Always keep a backup to prevent data loss.
Who Can Use an Organic Fertilizers KPI Dashboard in Excel?
This dashboard benefits:
- Organic fertilizer manufacturers
- Agricultural cooperatives
- Sustainability managers
- Operations managers
- Finance and planning teams
- Farm input suppliers
Because of its flexible design, both small and large organizations use it effectively.
How Does This Dashboard Support Sustainable Agriculture?
Sustainability plays a major role in organic fertilizer operations. This dashboard helps by:
- Tracking organic input usage
- Monitoring waste reduction
- Measuring efficiency improvements
- Supporting compliance reporting
As a result, businesses align performance with environmental goals.
Conclusion: Is an Organic Fertilizers KPI Dashboard in Excel Worth Using?
Yes, absolutely. An Organic Fertilizers KPI Dashboard in Excel provides clarity, control, and confidence. It simplifies KPI tracking, improves decision-making, and supports sustainable growth. Moreover, the structured 7-worksheet design ensures ease of use and scalability.
If you want better visibility into production, cost, quality, and sustainability, this dashboard becomes an essential tool.
Frequently Asked Questions (FAQs)
What is the main purpose of an Organic Fertilizers KPI Dashboard in Excel?
The main purpose is to track, analyze, and visualize key performance indicators related to organic fertilizer operations in one centralized Excel file.
Can beginners use this dashboard easily?
Yes. The dashboard uses simple navigation buttons, dropdowns, and structured sheets, which make it beginner-friendly.
Can I add new KPIs to the dashboard?
Yes. You can add new KPIs by updating the KPI Definition Sheet, Target Sheet, and Actual Numbers Sheet.
Does the dashboard support MTD and YTD analysis?
Yes. The dashboard displays both Month-to-Date and Year-to-Date metrics with comparisons.
How often should I update the dashboard?
You should update the dashboard monthly for accurate and meaningful insights.
Is this dashboard suitable for small organic fertilizer businesses?
Yes. Small, medium, and large businesses can all use this dashboard effectively.
Can I use this dashboard for presentations?
Yes. The visual layout and clear indicators make it ideal for management reviews and stakeholder presentations.
Click to buy Organic Fertilizers KPI Dashboard in Excel
Visit our YouTube channel to learn step-by-step video tutorials
Watch the step-by-step video tutorial: