Pathology labs handle hundreds of tests, patient records, and quality checks every single day. Because every lab activity impacts patient health, accuracy and speed become extremely important. Therefore, labs must measure every performance factor with clear KPIs. This is where the Pathology Labs KPI Dashboard in Excel becomes a complete game-changing tool.
This dashboard organizes all lab KPIs on one screen. It also helps lab managers track test volumes, turnaround time, accuracy, quality control, equipment performance, and more. As a result, labs improve service quality, increase productivity, and maintain compliance with ease.
In this article, you will learn everything about this dashboard, how it works, what sheets it contains, and how to use it for better lab performance.
Let’s start.
Click to Purchases Pathology Labs KPI Dashboard in Excel
What Is a Pathology Labs KPI Dashboard in Excel?
A Pathology Labs KPI Dashboard in Excel is a visual monitoring tool that collects lab data and converts it into clear charts, KPIs, and trend visuals. It helps pathology labs track both operational and clinical performance.
It measures:
-
Test turnaround time
-
Test accuracy rate
-
Patient inflow
-
Equipment utilization
-
QC pass rate
-
Report delivery time
-
Month-to-date (MTD) and year-to-date (YTD) performance
Because the dashboard is Excel-based, labs do not need technical knowledge. They enter data in simple sheets, and Excel instantly updates the dashboard with new numbers.
Why Do Pathology Labs Need a KPI Dashboard?
Pathology labs handle sensitive clinical work. Every delay or error impacts patient results. However, with a KPI dashboard, labs take quick action and maintain quality.
You need this dashboard because:
-
It provides a complete month-wise and year-wise view.
-
It highlights target achievements and missed targets.
-
It helps reduce report delays and improve patient satisfaction.
-
It tracks equipment efficiency and resource usage.
-
It highlights areas that need urgent attention.
-
It helps maintain NABL and clinical compliance with proper reports.
In short, it becomes a simple yet powerful system for lab management.
Click to Purchases Pathology Labs KPI Dashboard in Excel
Key Features of the Pathology Labs KPI Dashboard in Excel
This dashboard includes 7 worksheets, and each plays a different role. Let’s explore them step by step.
1. Home Sheet – Easy Navigation

The Home Sheet works as an index. It contains 6 clickable buttons, and each button leads to a specific sheet inside the workbook.
This improves the user experience because users open any page with one click. It also helps new staff find the right worksheet without confusion.
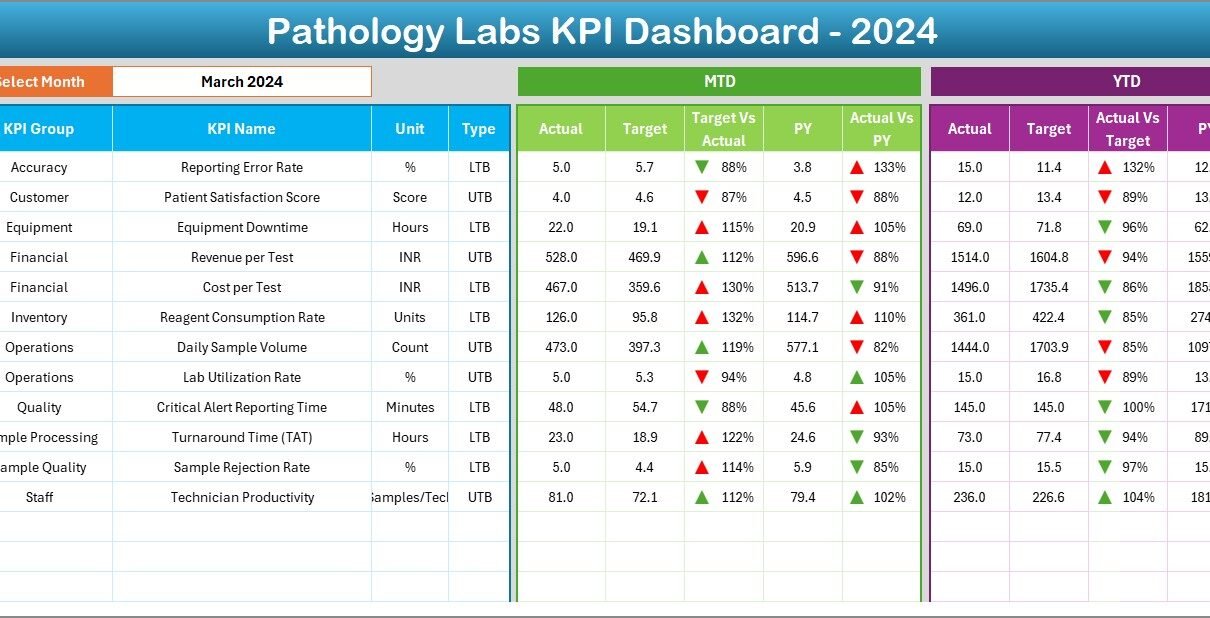
2. Dashboard Sheet – Main KPI Display
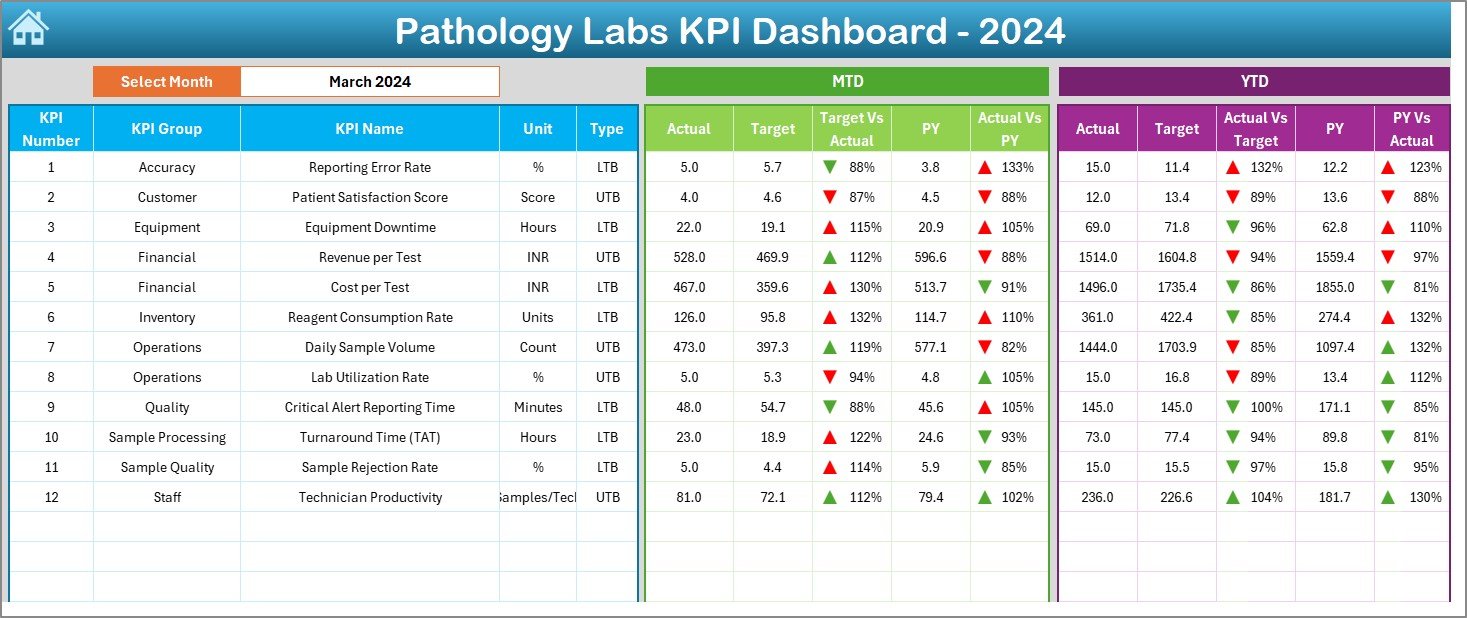
The Dashboard Sheet is the heart of the entire file. It displays all KPIs with:
-
MTD Actual
-
MTD Target
-
MTD Previous Year
-
Target vs Actual %
-
PY vs Actual %
-
YTD Actual
-
YTD Target
-
YTD Previous Year
-
YTD % comparisons
Filter on the Dashboard
On cell D3, users choose the month from a dropdown list. Once they select the month, every number on the dashboard updates instantly.
Conditional Formatting
The dashboard uses clear color-coded icons:
-
Green ▲ for positive performance
-
Red ▼ for underperformance
This makes it easy to understand KPI status at a glance.
What Does This Sheet Show?
It helps labs track:
-
Test accuracy
-
Patient wait time
-
Report delivery
-
QC success rate
-
Testing volumes
-
Equipment efficiency
-
Error rate
-
Productivity
Because the dashboard shows both MTD and YTD numbers, users track short-term and long-term performance easily.
Click to Purchases Pathology Labs KPI Dashboard in Excel
3. KPI Trend Sheet – Track KPI Over Time

The KPI Trend Sheet shows performance trends for a selected KPI. Users choose the KPI from a dropdown in cell C3.
The sheet displays:
-
KPI Group
-
KPI Unit
-
KPI Type (LTB or UTB)
-
KPI Formula
-
KPI Definition
Then it shows two trend charts:
✔ MTD Trend Chart
Displays Actual, Target, and Previous Year values month-wise.
✔ YTD Trend Chart
Shows cumulative progress toward yearly targets.
These charts help lab managers understand:
-
Whether turnaround time improves
-
Whether testing accuracy drops
-
Whether patient volume increases
-
Whether equipment performance grows over time
Since trends help detect problems early, this sheet becomes extremely useful.
Click to Purchases Pathology Labs KPI Dashboard in Excel
4. Actual Numbers Input Sheet – Enter Current Performance

The Actual Numbers Input Sheet is where users enter actual lab data for MTD and YTD.
Users select the first month of the year in cell E1. The sheet then prepares the entire year’s sequence.
Input fields include:
-
KPI Name
-
Month
-
MTD Value
-
YTD Value
Once users fill this sheet, the dashboard updates automatically.
5. Target Sheet – Enter Monthly and Yearly Targets

This sheet contains the target KPIs for the same period.
Users enter:
-
KPI Name
-
Month
-
MTD Target
-
YTD Target
Comparisons between actual and target help labs understand whether they perform better or lower than expected.
6. Previous Year Numbers Sheet – Enter Last Year’s Performance

Users enter previous year numbers for:
-
MTD values
-
YTD values
This helps labs analyze year-over-year performance. It also supports planning because managers understand long-term improvement patterns.
7. KPI Definition Sheet – Clear Meaning of Every KPI

This sheet contains:
-
KPI Name
-
KPI Group
-
KPI Unit
-
KPI Formula
-
KPI Definition
Because lab teams include technical and non-technical staff, a clear definition avoids mistakes and confusion.
Advantages of the Pathology Labs KPI Dashboard in Excel
This dashboard offers several major benefits:
1. Complete View of Lab Performance
The dashboard shows all key indicators on one single page. Therefore, managers review everything quickly.
2. Faster and Accurate Decision-Making
Because the dashboard updates in real-time, users do not search data manually. This saves time and reduces errors.
3. Simple Trend Analysis
The KPI Trend sheet shows month-wise and year-wise visuals that help labs understand improvement or decline.
4. Strong Quality Control
Labs track QC pass rate, error rate, rejected samples, and machine calibration KPIs easily.
5. Easy NABL and Compliance Reporting
Because all numbers are updated and available instantly, labs maintain documentation for audits and inspections.
6. Better Resource and Equipment Management
Labs use this dashboard to track machine load, downtime, and productivity.
7. No Technical Skills Required
Since the dashboard runs completely inside Excel, even beginners use it effortlessly.
Click to Purchases Pathology Labs KPI Dashboard in Excel
How to Build a Pathology Labs KPI Dashboard in Excel
Let’s understand the process clearly.
Step 1: Prepare KPI Definition Sheet
Add the KPI list including formulas and units.
Step 2: Enter Actual Data
Fill the MTD and YTD actual numbers.
Step 3: Enter Monthly Targets
Add the MTD and YTD target numbers for every KPI.
Step 4: Enter Previous Year Data
Add values for the previous year to support comparison.
Step 5: Create Relationships With Lookup Formulas
Use:
-
INDEX MATCH
-
XLOOKUP
-
SUMIFS
-
IF statements
Step 6: Design Dashboard Layout
Add:
-
KPI cards
-
Conditional formatting
-
Arrows (▲ ▼)
-
Comparison fields
-
Dropdown filter
Step 7: Build Trend Charts
Insert line-plus-column combo charts to show MTD and YTD patterns.
Click to Purchases Pathology Labs KPI Dashboard in Excel
Best Practices for the Pathology Labs KPI Dashboard in Excel
To get the best output, follow these guidelines.
1. Keep KPI Names Simple
Clear KPI names help everyone understand what they measure.
2. Use Consistent Units
Do not mix minutes, hours, or percentages for the same KPI.
3. Update Data Regularly
Always maintain fresh data for accurate reporting.
4. Use Conditional Formatting Wisely
Highlight:
-
Good performance in green
-
Poor performance in red
5. Use a Clean Layout
Avoid clutter. Keep only the essential visuals and KPIs.
6. Compare With Previous Year and Targets
This provides a complete performance picture.
7. Lock Formula Cells
Protect formulas to avoid accidental changes.
Conclusion
The Pathology Labs KPI Dashboard in Excel helps labs track operational and clinical KPIs with complete clarity. Since the dashboard shows MTD and YTD performance, targets, year-over-year comparisons, and trend charts, labs make better decisions at the right time.
Because it includes user-friendly sheets for input, targets, previous year values, KPI definitions, and trends, it becomes a practical tool for every lab. If you want to improve service accuracy, reduce delays, and run your lab with full control, this KPI dashboard is the perfect solution.
Click to Purchases Pathology Labs KPI Dashboard in Excel
Frequently Asked Questions (FAQs)
1. What is a Pathology Labs KPI Dashboard?
It is an Excel dashboard that tracks lab performance using KPIs such as turnaround time, QC pass rate, patient volume, and error rate.
2. How many sheets does this dashboard include?
It contains seven sheets: Home, Dashboard, KPI Trend, Actual Input, Target, Previous Year, and KPI Definition.
3. Can I change or add KPIs?
Yes, you can add new KPIs through the KPI Definition sheet.
4. Do I need advanced Excel skills?
No, the dashboard is simple and easy for beginners.
5. Does the dashboard support monthly comparison?
Yes, users select any month from a dropdown to view MTD and YTD numbers.
6. Does it support Previous Year comparison?
Yes, the dashboard compares performance with previous year values.
Click to Purchases Pathology Labs KPI Dashboard in Excel
Visit our YouTube channel to learn step-by-step video tutorials