Performance management plays a critical role in building productive, motivated, and high-performing teams. However, many organizations still rely on manual appraisal sheets, disconnected Excel files, or subjective reviews. As a result, managers struggle to track progress, compare results, and make fair decisions.
That is exactly where a Performance Appraisal KPI Dashboard in Power BI becomes a powerful solution.
In this detailed guide, you will learn what a Performance Appraisal KPI Dashboard in Power BI is, why it matters, how it works, and how each dashboard page supports data-driven performance evaluations. Moreover, you will explore its advantages, best practices, real-world use cases, and frequently asked questions. By the end, you will clearly understand how this dashboard transforms raw appraisal data into meaningful insights.
Click to Purchases Performance Appraisal KPI Dashboard in Power BI
What Is a Performance Appraisal KPI Dashboard in Power BI?
A Performance Appraisal KPI Dashboard in Power BI is an interactive analytics solution designed to monitor, compare, and evaluate employee performance using predefined Key Performance Indicators (KPIs).
Instead of reviewing multiple spreadsheets or narrative reports, this dashboard consolidates all appraisal metrics into a single Power BI file. Because of that, HR teams and managers can instantly track targets, actual performance, historical trends, and year-over-year comparisons.
Moreover, the dashboard connects to an Excel data source. As a result, users can easily update data without complex technical skills while still benefiting from advanced Power BI visuals and calculations.
Why Do Organizations Need a Performance Appraisal KPI Dashboard?
Modern organizations demand fair, transparent, and data-driven performance evaluations. However, traditional appraisal systems often fail to deliver clarity and consistency.
Here is why a Performance Appraisal KPI Dashboard in Power BI becomes essential:
-
It removes manual calculations and reporting errors
-
It improves transparency across appraisal cycles
-
It enables objective comparisons between targets and actual results
-
It supports timely feedback and corrective actions
-
It helps HR leaders identify top performers and improvement areas
Because of these reasons, organizations that use KPI dashboards make faster, smarter, and more confident appraisal decisions.
How Does a Performance Appraisal KPI Dashboard in Power BI Work?
The dashboard follows a structured and user-friendly workflow.
First, users enter KPI data into predefined Excel sheets. Next, Power BI reads and processes that data. Finally, the dashboard presents insights using cards, tables, slicers, icons, and trend charts.
The solution focuses on MTD (Month-to-Date) and YTD (Year-to-Date) performance while also comparing current results with previous years. Because of this approach, users can analyze both short-term and long-term performance trends.
Key Features of the Performance Appraisal KPI Dashboard in Power BI
This ready-to-use dashboard includes three well-structured pages, each designed to answer specific performance questions.
Let us explore each page in detail.
What Does the Summary Page Show in the Performance Appraisal KPI Dashboard?
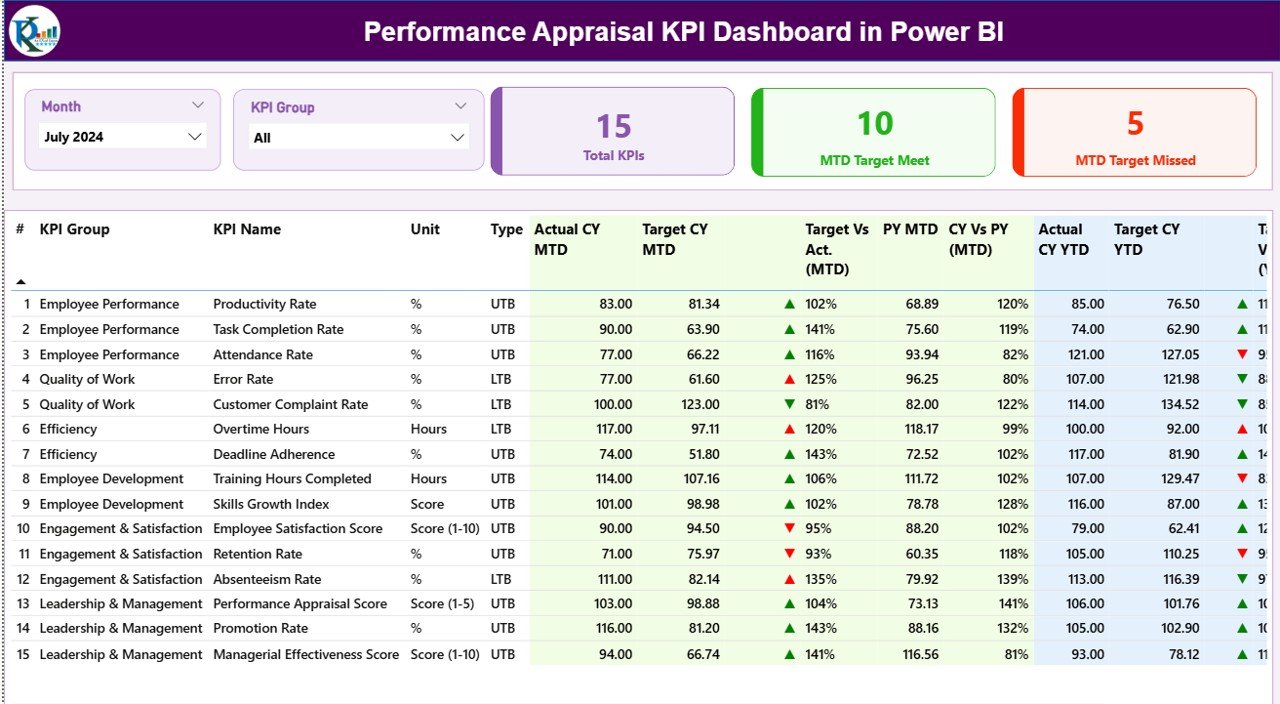
The Summary Page acts as the control center of the dashboard. It provides a quick overview of all performance KPIs at a glance.
Key Elements of the Summary Page
Interactive Slicers
-
Month slicer to analyze a specific period
-
KPI Group slicer to filter by performance category
Top KPI Cards
-
Total KPIs count
-
MTD Target Met count
-
MTD Target Missed count
These cards instantly highlight overall performance health.
Detailed KPI Table on the Summary Page
Click to Purchases Performance Appraisal KPI Dashboard in Power BI
Below the cards, the dashboard displays a detailed KPI table with rich performance metrics.
Included Fields and Their Meaning
-
KPI Number
Represents the sequence number of the KPI for easy reference. -
KPI Group
Defines the category or group of the KPI, such as Productivity, Quality, Attendance, or Learning. -
KPI Name
Displays the specific performance metric being tracked. -
Unit
Indicates the unit of measurement, such as %, Hours, Score, or Count. -
Type (LTB or UTB)
-
LTB (Lower the Better) for metrics like error rate or absenteeism
-
UTB (Upper the Better) for metrics like productivity or achievement score
-
MTD Performance Metrics Explained
-
Actual CY MTD
Shows the current year’s actual MTD value. -
Target CY MTD
Displays the defined target for the current month. -
MTD Icon
Uses ▲ green and ▼ red icons to visually indicate whether the KPI meets the target. -
Target vs Actual (MTD)
Calculates performance using the formula:
Actual MTD / Target MTD -
PY MTD
Shows the same month’s performance from the previous year. -
CY vs PY (MTD)
Compares current MTD performance with previous year MTD using:
Current Year MTD / Previous Year MTD
YTD Performance Metrics Explained
-
Actual CY YTD
Displays cumulative performance for the current year. -
Target CY YTD
Shows the cumulative target for the year. -
YTD Icon
Highlights target achievement status using visual indicators. -
Target vs Actual (YTD)
Uses the formula:
Actual YTD / Target YTD -
PY YTD
Shows last year’s cumulative performance. -
CY vs PY (YTD)
Measures year-over-year growth or decline using:
Current Year YTD / Previous Year YTD
Because of these metrics, managers can evaluate performance from multiple perspectives without switching reports.
How Does the KPI Trend Page Help Performance Analysis?
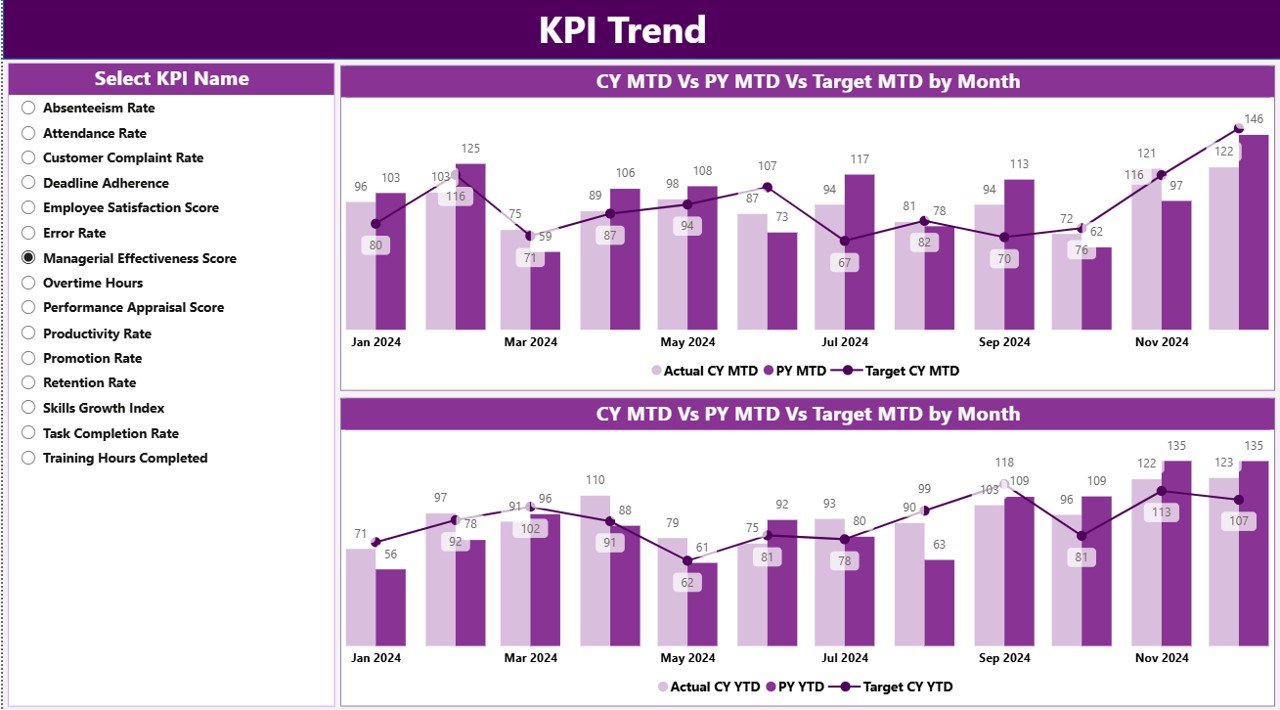
The KPI Trend Page focuses on performance movement over time.
Key Highlights of the KPI Trend Page
-
KPI Name slicer on the left side
-
Two combo charts for MTD and YTD analysis
Each combo chart displays:
-
Current Year Actual
-
Previous Year Actual
-
Target values
This layout allows users to quickly identify patterns, seasonality, and performance gaps.
Why Trend Analysis Matters in Appraisals
Trend analysis answers critical questions such as:
-
Is performance improving or declining over time?
-
Are targets realistic and achievable?
-
Do employees sustain performance consistently?
Because of visual trend comparisons, managers can base reviews on facts instead of assumptions.
Click to Purchases Performance Appraisal KPI Dashboard in Power BI
What Is the Purpose of the KPI Definition Page?
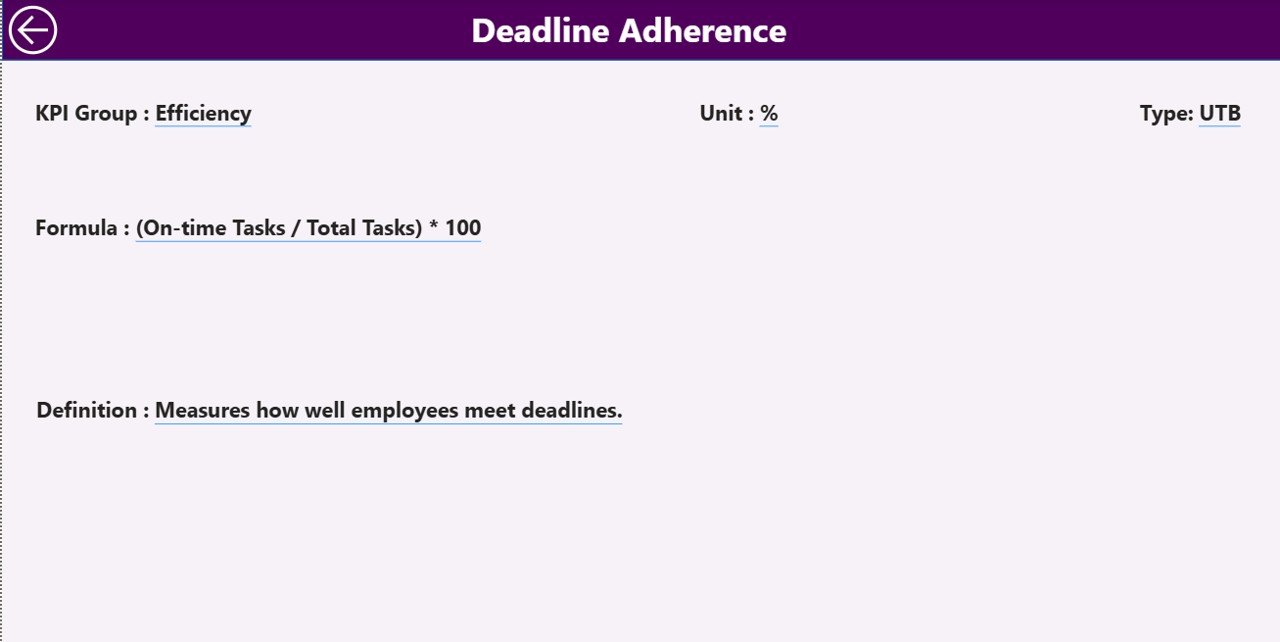
The KPI Definition Page serves as a drill-through reference page. Although the page remains hidden by default, users can access it directly from the Summary Page.
What Information Does the KPI Definition Page Show?
-
KPI Number
-
KPI Group
-
KPI Name
-
Unit
-
Formula
-
Detailed KPI Definition
-
KPI Type (LTB or UTB)
This page ensures clarity and consistency across the organization. As a result, every stakeholder understands how each KPI works and how performance gets measured.
To return to the main dashboard, users simply click the Back button available at the top left corner.
What Excel Data Is Required for the Performance Appraisal KPI Dashboard?
The dashboard uses an Excel file as its data source. This design keeps data entry simple and flexible.
Required Excel Worksheets
1) Input_Actual Sheet
Use this sheet to enter actual performance data.
Required Fields
-
KPI Name
-
Month (first date of the month)
-
MTD Actual value
-
YTD Actual value
2) Input_Target Sheet
Use this sheet to define performance targets.
Required Fields
-
KPI Name
-
Month (first date of the month)
-
MTD Target value
-
YTD Target value
3) KPI Definition Sheet
Use this sheet to define KPI metadata.
Required Fields
-
KPI Number
-
KPI Group
-
KPI Name
-
Unit
-
Formula
-
Definition
-
Type (LTB or UTB)
Because of this structured approach, users can maintain clean and reliable appraisal data.
Advantages of Performance Appraisal KPI Dashboard in Power BI
Using a Performance Appraisal KPI Dashboard in Power BI delivers several strategic advantages.
Key Benefits
-
📊 Centralized performance tracking
-
⚡ Faster appraisal reviews
-
🎯 Clear target vs actual comparison
-
📈 Visual performance trends
-
🔍 Improved transparency and fairness
-
📁 Easy Excel-based data management
-
🧠 Better decision-making with insights
Because of these advantages, organizations can align employee performance with business goals more effectively.
Who Can Benefit from a Performance Appraisal KPI Dashboard?
This dashboard supports multiple roles across an organization.
Ideal Users
-
HR Managers and HR Analysts
-
Department Heads
-
Team Leaders and Supervisors
-
Senior Management
-
Performance Review Committees
Each role gains tailored insights without complex technical effort.
Best Practices for the Performance Appraisal KPI Dashboard in Power BI
To maximize the value of the dashboard, follow these best practices.
1. Define Clear KPIs
Always select KPIs that align with organizational goals. Avoid vague or subjective metrics.
2. Maintain Consistent KPI Definitions
Click to Purchases Performance Appraisal KPI Dashboard in Power BI
Use the KPI Definition page to standardize formulas and interpretations across departments.
3. Update Data Regularly
Ensure monthly updates to Actual and Target sheets to keep insights accurate.
4. Use LTB and UTB Correctly
Apply LTB and UTB logic carefully so that icons and comparisons remain meaningful.
5. Review Trends, Not Just Numbers
Focus on performance trends instead of isolated results to ensure fair evaluations.
6. Train Users on Interpretation
Educate managers on reading KPI icons, percentages, and trend charts.
How Does This Dashboard Improve Decision-Making?
The Performance Appraisal KPI Dashboard supports smarter decisions by:
-
Highlighting underperforming areas early
-
Identifying top performers consistently
-
Supporting data-driven promotions and rewards
-
Enabling targeted training plans
-
Reducing appraisal bias
Because of real-time visibility, leaders can act confidently and proactively.
Real-World Use Cases of Performance Appraisal KPI Dashboards
Organizations use this dashboard in several scenarios.
Common Use Cases
-
Annual and quarterly appraisal cycles
-
Monthly performance monitoring
-
Department-wise KPI reviews
-
Leadership performance presentations
-
HR audits and compliance reporting
Each use case benefits from consistent metrics and visual clarity.
Conclusion: Why Choose a Performance Appraisal KPI Dashboard in Power BI?
A Performance Appraisal KPI Dashboard in Power BI transforms employee evaluation from a manual, subjective process into a structured, transparent, and data-driven system.
By combining Excel-based data entry with powerful Power BI visuals, this dashboard delivers actionable insights without complexity. Moreover, it empowers HR teams and managers to evaluate performance fairly, track progress continuously, and align people strategies with organizational goals.
If your organization wants clarity, consistency, and confidence in performance appraisals, this dashboard becomes an essential analytics tool.
Frequently Asked Questions About Performance Appraisal KPI Dashboard in Power BI
What is the main purpose of a Performance Appraisal KPI Dashboard?
The dashboard helps organizations track, analyze, and evaluate employee performance using measurable KPIs.
Can I update the data without Power BI expertise?
Yes. You only need to update the Excel input sheets. Power BI automatically refreshes the visuals.
Does the dashboard support MTD and YTD analysis?
Yes. The dashboard tracks both Month-to-Date and Year-to-Date performance.
What does LTB and UTB mean in KPIs?
LTB means Lower the Better, while UTB means Upper the Better.
Can I customize KPIs and KPI groups?
Yes. You can add, remove, or modify KPIs directly in the Excel data source.
Is the KPI Definition page necessary?
Yes. It ensures clarity, consistency, and transparency in performance measurement.
Who should use this dashboard?
HR teams, managers, team leaders, and senior leadership can all benefit from this dashboard.
Visit our YouTube channel to learn step-by-step video tutorials