Managing performance in the petroleum industry demands accuracy, clarity, and speed. However, many organizations still struggle with scattered reports, manual calculations, and delayed insights. As a result, decision-making often becomes reactive instead of proactive.
That is exactly where a Petroleum Industry KPI Scorecard in Excel plays a critical role.
In this detailed and SEO-friendly guide, you will learn what a Petroleum Industry KPI Scorecard in Excel is, why it matters, how it works, its worksheet-wise structure, key features, advantages, best practices, challenges, and frequently asked questions. Moreover, this article uses clear language, real-world logic, and practical explanations so you can apply it immediately.
Click to buy Petroleum Industry KPI Scorecard in Excel
What Is a Petroleum Industry KPI Scorecard in Excel?
A Petroleum Industry KPI Scorecard in Excel is a ready-to-use performance management tool designed to track, compare, and evaluate key performance indicators (KPIs) across petroleum operations.
Instead of relying on multiple spreadsheets, emails, and manual summaries, this scorecard consolidates all critical KPIs into a single Excel file. Consequently, managers, engineers, and analysts gain instant visibility into operational, financial, safety, and efficiency metrics.
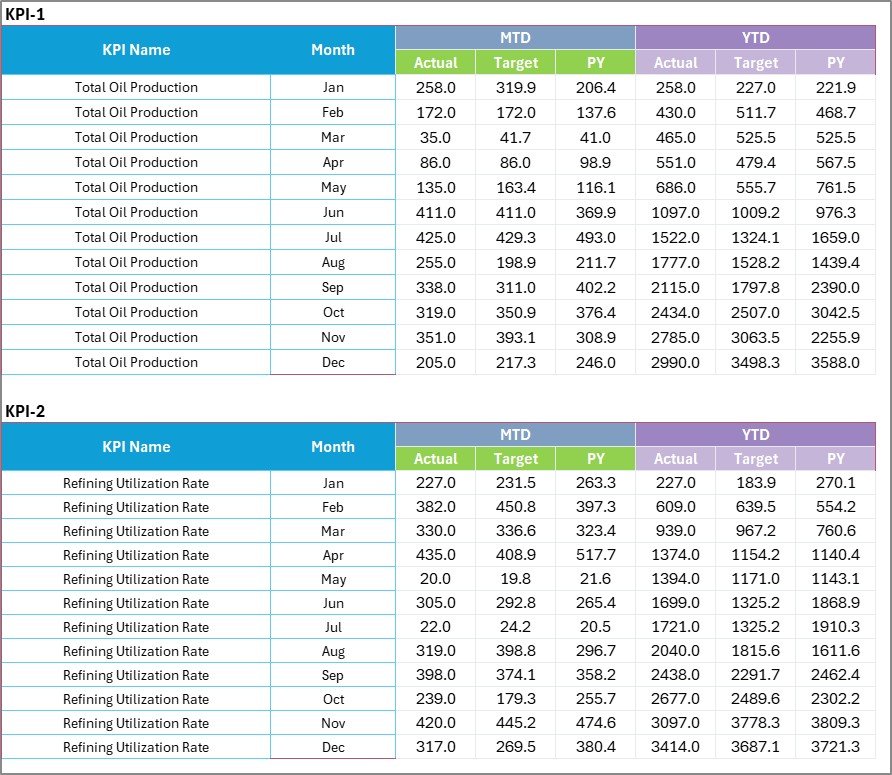
More importantly, the scorecard allows users to monitor MTD (Month-to-Date) and YTD (Year-to-Date) performance while comparing Actual vs Target and Previous Year (PY) values.
Why Does the Petroleum Industry Need a KPI Scorecard?
The petroleum industry operates in a highly complex and regulated environment. Therefore, tracking performance accurately becomes essential.
Here is why a KPI scorecard becomes unavoidable:
- Operations involve high capital investment and narrow margins
- Safety and compliance standards remain extremely strict
- Production efficiency directly impacts profitability
- Downtime, losses, or inefficiencies cause major financial damage
- Management teams need fast, data-driven decisions
Because of these reasons, a structured KPI scorecard in Excel helps organizations stay in control, remain compliant, and improve performance continuously.
How Does a Petroleum Industry KPI Scorecard in Excel Work?
The Petroleum Industry KPI Scorecard in Excel works as a centralized reporting system. First, users enter KPI data in a structured input sheet. Then, Excel formulas and pivot logic calculate MTD, YTD, targets, and comparisons automatically.
After that, the scorecard displays results using clear visuals, conditional formatting, and trend charts. As a result, users can instantly identify:
- Which KPIs meet targets
- Which KPIs underperform
- How performance changes over time
- Where corrective action is required
Because Excel supports dropdowns and dynamic formulas, users can analyze performance by month, KPI, or time period without rewriting formulas.
What Are the Key Features of the Petroleum Industry KPI Scorecard in Excel?
This ready-to-use template includes powerful yet simple features that make performance tracking efficient and reliable.
Key Features Overview
- Interactive dropdown selections
- MTD and YTD performance analysis
- Actual vs Target comparison
- Previous Year benchmarking
- Color-coded performance indicators
- KPI trend visualization
- Structured data input and definitions
Let us now explore each worksheet in detail.
What Is the Scorecard Sheet in the Petroleum Industry KPI Scorecard?
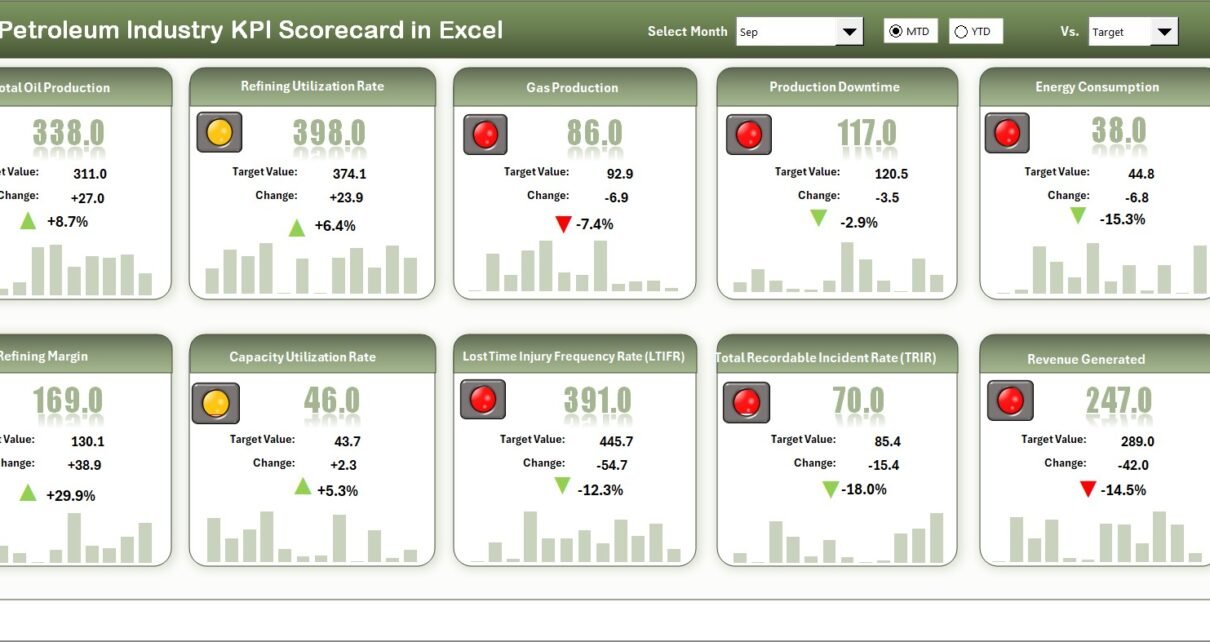
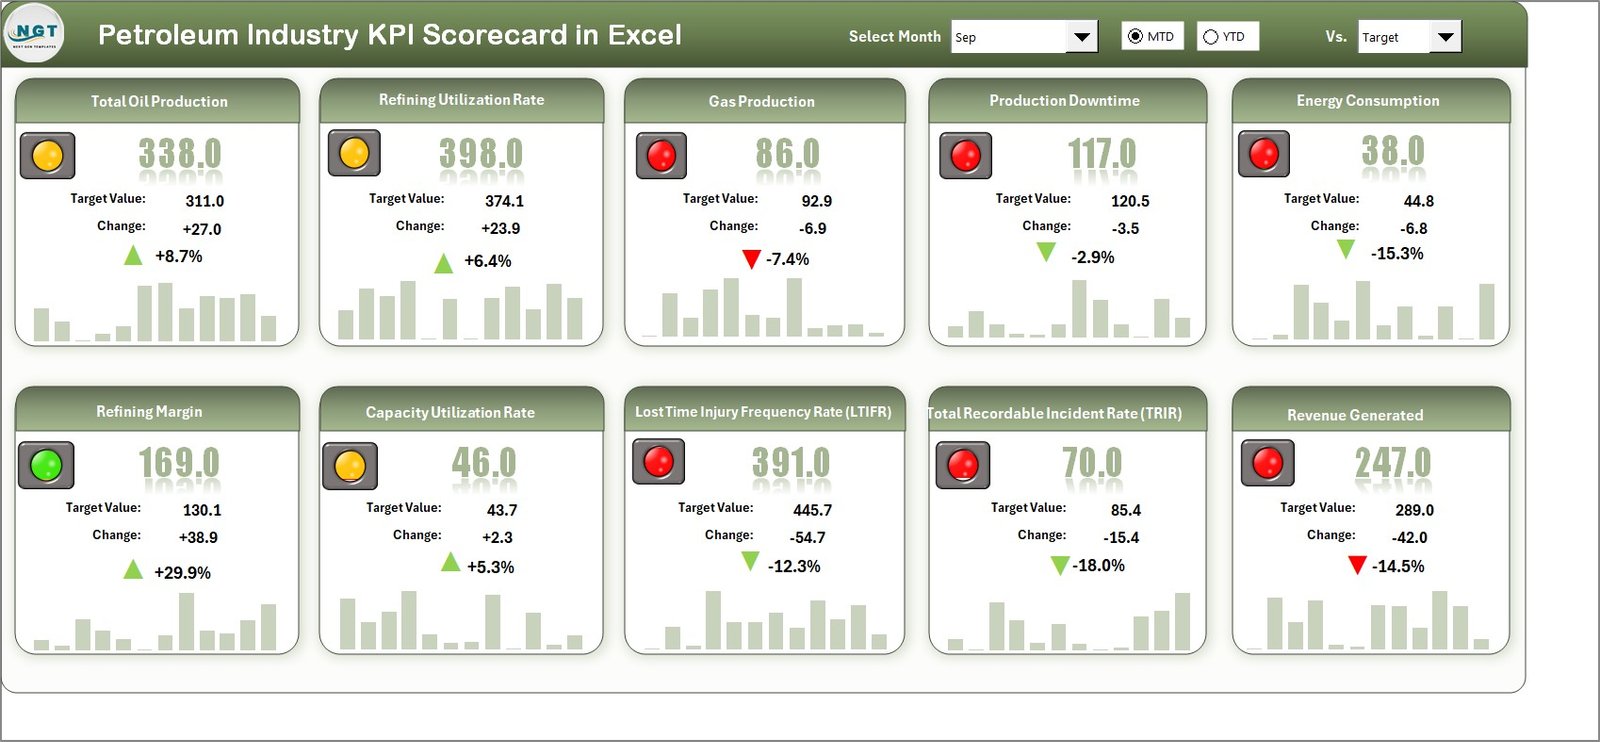
The Scorecard Sheet acts as the main interface of the entire KPI system. In fact, this sheet provides a consolidated view of petroleum KPIs at a glance.
Key Functionalities of the Scorecard Sheet
- Dropdown Menus
Users can select the month and choose between MTD or YTD performance. As soon as selections change, all values update automatically. - Actual vs Target Comparison
The scorecard compares actual results against predefined targets for each KPI. Therefore, users immediately know whether performance meets expectations. - Visual Indicators
Color-coded conditional formatting highlights good, average, or poor performance. Consequently, users identify issues without reading numbers. - Comprehensive KPI Overview
The sheet displays KPI group, unit, type, actual value, target value, variance, and status in one view. - 10 KPIs in One View
The scorecard shows up to 10 KPIs simultaneously, making it ideal for executive-level reviews.
Because of this design, the scorecard sheet becomes the first stop for management discussions.
Click to buy Petroleum Industry KPI Scorecard in Excel
How Does the KPI Trend Sheet Help in Performance Analysis?
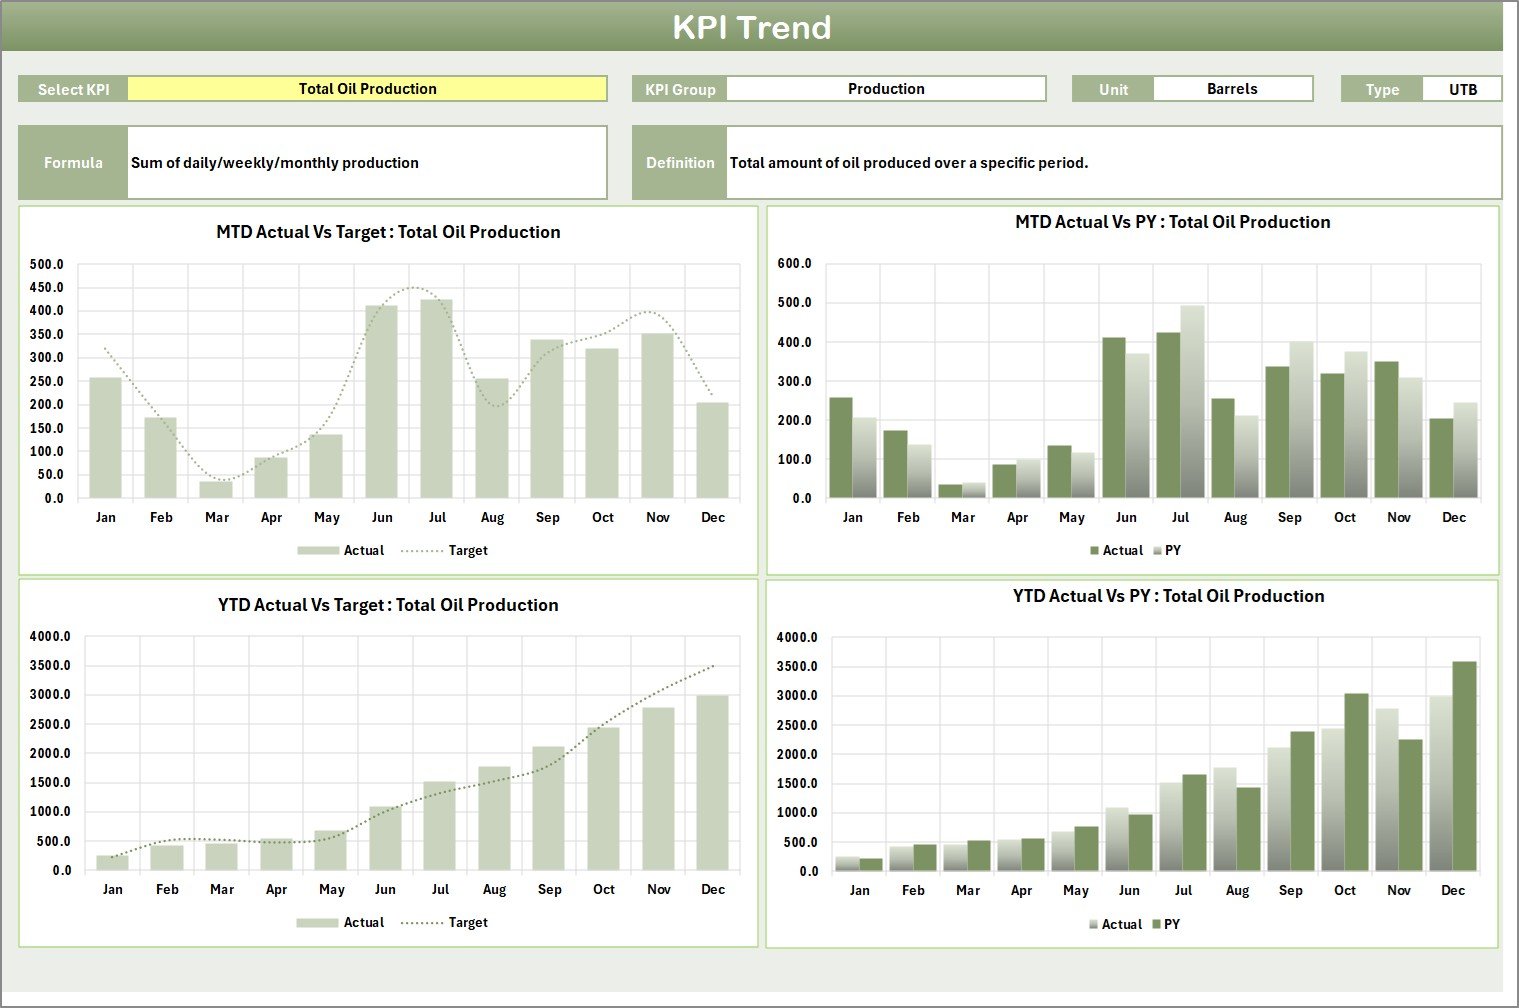
The KPI Trend Sheet focuses on time-based performance analysis. Instead of showing a snapshot, this sheet reveals performance behavior over time.
Key Elements of the KPI Trend Sheet
- KPI Selection Dropdown (Cell C3)
Users select a specific KPI from a dropdown list. Immediately, all related details update dynamically.
KPI Details Display
The sheet shows:
KPI Group
Unit of Measure
KPI Type (Lower the Better or Upper the Better)
KPI Formula
KPI Definition
MTD and YTD Trend Charts
The sheet displays trend charts for:
Actual values
Target values
Previous Year values
Because of these visuals, users can easily understand whether performance improves, declines, or stays stable.
Click to buy Petroleum Industry KPI Scorecard in Excel
Input Data Sheet
The Input Data Sheet serves as the backbone of the entire KPI scorecard.
Purpose of the Input Data Sheet
- Centralized Data Entry
Users record actual values, targets, and previous year numbers in a structured format. - Data Flexibility
Whenever new data becomes available, users simply update this sheet. Consequently, the entire scorecard refreshes automatically. - Error Reduction
Structured columns and validation reduce manual mistakes and inconsistencies.
Because the scorecard depends on this sheet, clean and accurate data entry ensures reliable insights.
Click to buy Petroleum Industry KPI Scorecard in Excel
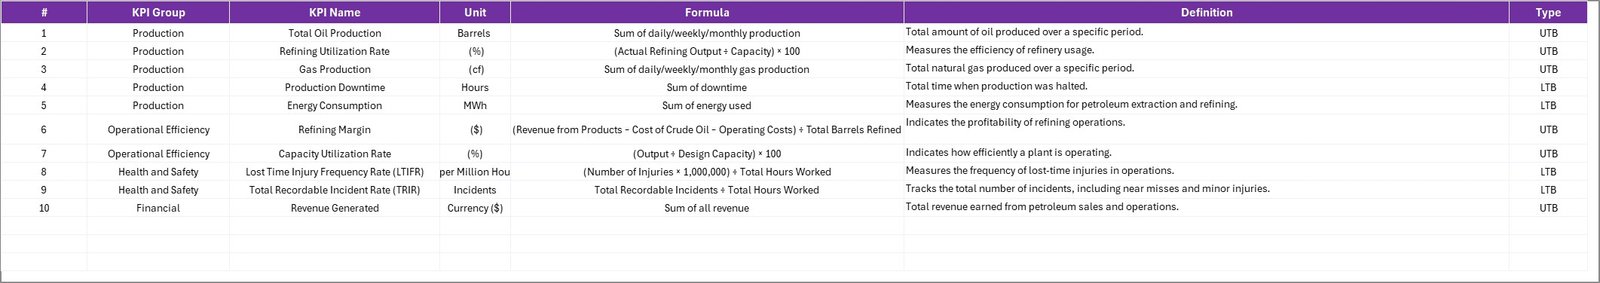
Definition Sheet
The KPI Definition Sheet ensures clarity, consistency, and standardization across the organization.
Information Captured in the KPI Definition Sheet
- KPI Name
- KPI Group
- Unit of Measurement
- KPI Formula
- KPI Definition
This sheet eliminates confusion and ensures that everyone interprets KPIs the same way. Moreover, new team members can quickly understand performance metrics without additional training.
Click to buy Petroleum Industry KPI Scorecard in Excel
Which KPIs Are Commonly Tracked in the Petroleum Industry?
Although KPIs vary by organization, many petroleum companies track the following categories:
Operational KPIs
- Production volume
- Refinery utilization rate
- Equipment downtime
- Energy consumption
Financial KPIs
- Operating cost per barrel
- Revenue per unit
- Profit margin
- Maintenance cost
Safety & Compliance KPIs
- Incident rate
- Lost time injury frequency
- Environmental compliance score
Efficiency KPIs
- Yield efficiency
- Process loss percentage
- Maintenance response time
A well-designed scorecard can accommodate all these KPIs easily.
Advantages of Petroleum Industry KPI Scorecard in Excel
Using a KPI scorecard in Excel offers multiple operational and strategic benefits.
Key Advantages
- Centralized Performance View
All KPIs remain available in one file, reducing reporting effort. - Improved Decision-Making
Managers make faster decisions because data remains clear and updated. - Cost-Effective Solution
Excel eliminates the need for expensive BI tools. - Ease of Customization
Users can add, remove, or modify KPIs without technical skills. - Time Savings
Automated calculations reduce manual reporting hours. - Transparency and Accountability
Clear targets and comparisons promote responsibility.
What Challenges Do Organizations Face Without a KPI Scorecard?
Without a structured KPI scorecard, petroleum organizations often face serious issues.
Common Challenges
- Fragmented data across multiple files
- Delayed reporting cycles
- Inconsistent KPI definitions
- Limited performance visibility
- Poor alignment with targets
However, a well-designed Excel scorecard solves these problems effectively.
Best Practices for the Petroleum Industry KPI Scorecard in Excel
To maximize value, organizations should follow proven best practices.
Best Practices
- Define Clear KPIs
Always align KPIs with business goals. - Limit the Number of KPIs
Focus on critical metrics instead of tracking everything. - Use Consistent Definitions
Maintain a dedicated KPI definition sheet. - Update Data Regularly
Schedule monthly or weekly data updates. - Use Visual Indicators Wisely
Keep formatting simple and meaningful. - Validate Input Data
Apply data validation to reduce errors. - Review Trends, Not Just Numbers
Trend analysis often reveals hidden problems early.
How Does This Scorecard Support Management and Strategy?
A Petroleum Industry KPI Scorecard in Excel does more than reporting. In fact, it supports long-term strategy.
- Management reviews performance objectively
- Teams align daily activities with targets
- Leaders identify improvement areas early
- Organizations track progress against strategic goals
Because of this, the scorecard becomes a strategic performance management tool.
Who Can Benefit from a Petroleum Industry KPI Scorecard in Excel?
This scorecard benefits a wide range of professionals.
Beneficiaries
- Operations managers
- Plant supervisors
- Maintenance teams
- Finance professionals
- Safety officers
- Senior management
Each stakeholder gains relevant insights without complex dashboards.
How to Get Started with a Petroleum Industry KPI Scorecard in Excel?
Getting started remains simple.
- Define KPIs and targets
- Prepare the input data sheet
- Populate the KPI definition sheet
- Review the scorecard output
- Analyze trends and take action
Because Excel handles calculations, users can focus on insights instead of formulas.
Conclusion
A Petroleum Industry KPI Scorecard in Excel provides a practical, powerful, and cost-effective way to track performance across petroleum operations. By combining structured data input, clear KPI definitions, interactive scorecards, and trend analysis, this tool transforms raw data into actionable insights.
Moreover, Excel’s flexibility ensures that organizations of any size can adapt the scorecard to their specific needs. When used correctly, this scorecard improves transparency, accountability, efficiency, and strategic decision-making.
Frequently Asked Questions (FAQs)
What is a Petroleum Industry KPI Scorecard in Excel?
It is an Excel-based performance tracking tool that monitors petroleum KPIs using MTD, YTD, and target comparisons.
Why should petroleum companies use Excel for KPI tracking?
Excel offers flexibility, affordability, and ease of customization without complex software.
Can I customize the KPI Scorecard?
Yes, users can easily add or modify KPIs, targets, and visuals.
How often should KPI data be updated?
Most organizations update data monthly, although some prefer weekly updates.
Does the scorecard support trend analysis?
Yes, it includes MTD and YTD trend charts for Actual, Target, and Previous Year values.
Is this scorecard suitable for executive reporting?
Absolutely. The scorecard provides a high-level overview ideal for management reviews.
Visit our YouTube channel to learn step-by-step video tutorials
Click to buy Petroleum Industry KPI Scorecard in Excel
Watch the step-by-step video tutorial: