Port operations play a critical role in global trade. Every delay, inefficiency, or missed target directly affects shipping schedules, logistics costs, and customer satisfaction. Therefore, port authorities, terminal operators, and logistics teams must rely on accurate data, real-time insights, and structured performance tracking.
That is exactly where a Port Operations KPI Dashboard in Power BI becomes essential.
This detailed guide explains what a Port Operations KPI Dashboard in Power BI is, why ports need it, how it works, its page-wise structure, key KPIs, advantages, best practices, and frequently asked questions. Moreover, this article uses simple language, strong transitions, and practical explanations to help you understand and implement the dashboard confidently.
Click to Purchases Port Operations KPI Dashboard in Power BI
What Is a Port Operations KPI Dashboard in Power BI?
A Port Operations KPI Dashboard in Power BI is an interactive, ready-to-use reporting solution that helps ports track, analyze, and improve operational performance using key performance indicators (KPIs).
Instead of working with scattered Excel files, static reports, or manual calculations, this dashboard centralizes all port operational data into a single Power BI file. As a result, decision-makers gain instant visibility into performance trends, target achievement, and operational efficiency.
Moreover, since the dashboard uses Excel as the data source and Power BI for visualization, teams can update data easily without technical complexity. Consequently, even non-technical users can maintain and use the dashboard effectively.
Why Do Ports Need a KPI Dashboard in Power BI?
Port operations involve multiple activities such as cargo handling, vessel turnaround, yard utilization, equipment availability, and productivity tracking. Therefore, monitoring performance manually becomes difficult and error-prone.
A Port Operations KPI Dashboard in Power BI solves this challenge effectively.
Key reasons ports need this dashboard:
-
Ports handle large volumes of operational data daily
-
Manual reports consume time and delay decisions
-
Performance gaps remain hidden without visual insights
-
Target tracking becomes inconsistent across departments
-
Leadership teams need quick, data-driven decisions
As a result, this dashboard acts as a single source of truth for port performance.
How Does a Port Operations KPI Dashboard in Power BI Work?
The dashboard follows a simple yet powerful workflow.
First, operational data gets captured in structured Excel sheets. Then, Power BI connects to this Excel file and transforms the data into meaningful KPIs, visuals, and trends.
Overall workflow:
-
Enter Actual performance data in Excel
-
Enter Target performance data in Excel
-
Define KPIs with formulas and types
-
Refresh Power BI dashboard
-
Analyze KPIs using slicers, cards, and charts
Because of this structure, users do not need complex coding or advanced Power BI skills.
Click to Purchases Port Operations KPI Dashboard in Power BI
Data Source Used in the Dashboard: Excel Integration
The data source of this Port Operations KPI Dashboard in Power BI is an Excel file. This design ensures flexibility, scalability, and ease of use.
Excel File Structure
The Excel file contains three mandatory worksheets:
1) Input_Actual Sheet
This sheet captures the actual operational performance data.
Columns to fill:
-
KPI Name
-
Month (use the first date of the month)
-
MTD (Month-to-Date) value
-
YTD (Year-to-Date) value
Here, users only need to update numbers regularly. Therefore, data maintenance remains quick and error-free.
2) Input_Target Sheet
This sheet captures the target performance values.
Columns to fill:
-
KPI Name
-
Month (use the first date of the month)
-
MTD target
-
YTD target
As a result, the dashboard automatically compares actual vs target performance.
3) KPI Definition Sheet
This sheet defines what each KPI represents.
Columns included:
-
KPI Number
-
KPI Group
-
KPI Name
-
Unit
-
Formula
-
Definition
-
Type (LTB or UTB)
This sheet improves clarity, consistency, and governance across the organization.
Click to Purchases Port Operations KPI Dashboard in Power BI
Page-Wise Structure of the Port Operations KPI Dashboard in Power BI
The dashboard contains three well-structured pages, each serving a specific purpose.
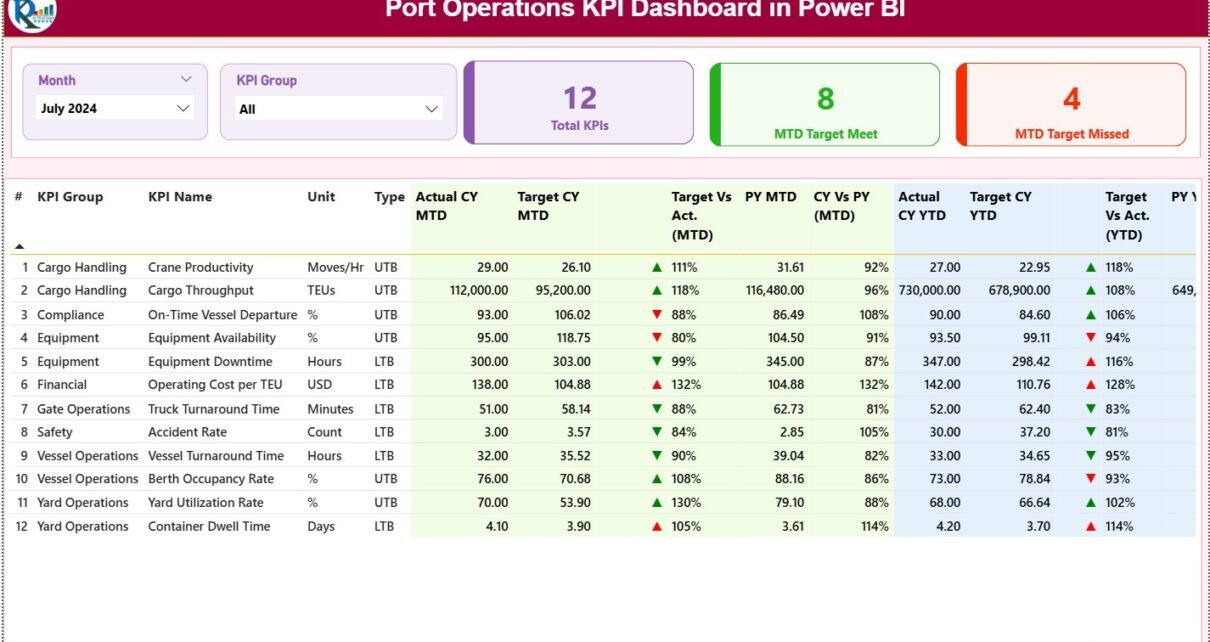
1) Summary Page: How Does the Main Dashboard Work?
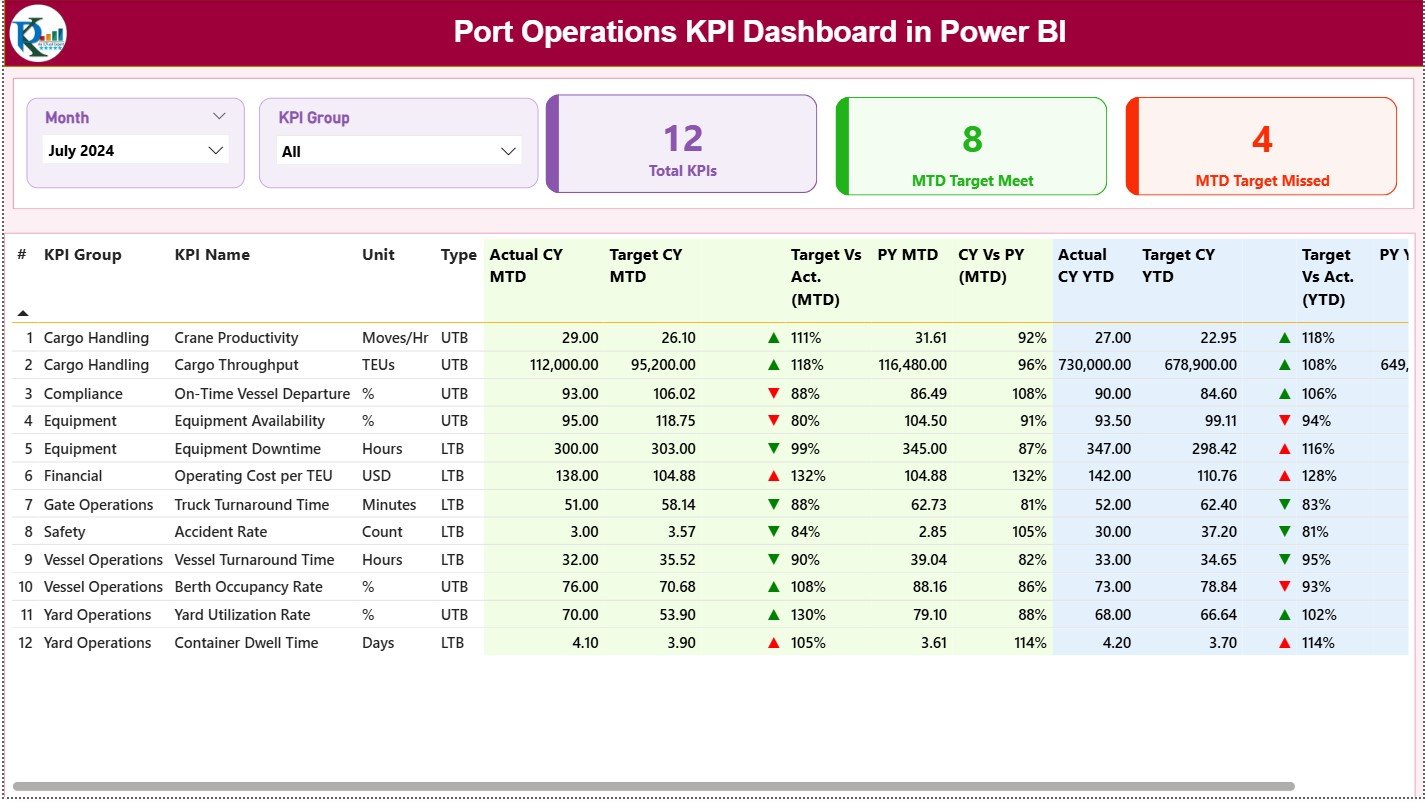
The Summary Page acts as the central control panel of the dashboard.
Top Section: Filters and Slicers
At the top, the dashboard displays:
-
Month slicer
-
KPI Group slicer
These slicers allow users to filter performance instantly. As a result, analysis becomes faster and more focused.
KPI Cards: Quick Performance Snapshot
Below the slicers, three KPI cards provide instant insights:
-
Total KPIs Count
-
MTD Target Met Count
-
MTD Target Missed Count
These cards help leadership quickly assess operational health without scrolling through tables.
Detailed KPI Performance Table
The summary table provides in-depth KPI-level analysis.
Columns included in the table:
-
KPI Number – Sequential identifier of the KPI
-
KPI Group – Category or functional area of the KPI
-
KPI Name – Name of the KPI
-
Unit – Measurement unit (e.g., %, Hours, TEUs)
-
Type – KPI type:
-
LTB (Lower the Better)
-
UTB (Upper the Better)
-
Performance Metrics: MTD Analysis
-
Actual CY MTD – Current year actual MTD value
-
Target CY MTD – Current year target MTD value
-
MTD Icon –
-
▲ Green for target achieved
-
▼ Red for target missed
-
-
Target vs Actual (MTD)
-
Formula:
Actual MTD / Target MTD
-
-
PY MTD – Previous year MTD value
-
CY vs PY (MTD)
-
Formula:
Current Year MTD / Previous Year MTD
-
These metrics help identify short-term performance gaps.
Performance Metrics: YTD Analysis
-
Actual CY YTD – Current year actual YTD value
-
Target CY YTD – Current year target YTD value
-
YTD Icon –
-
▲ Green for target achieved
-
▼ Red for target missed
-
-
Target vs Actual (YTD)
-
Formula:
Actual YTD / Target YTD
-
-
PY YTD – Previous year YTD value
-
CY vs PY (YTD)
-
Formula:
Current Year YTD / Previous Year YTD
-
As a result, management can track long-term trends clearly.
2) KPI Trend Page: How Can You Analyze Performance Trends?
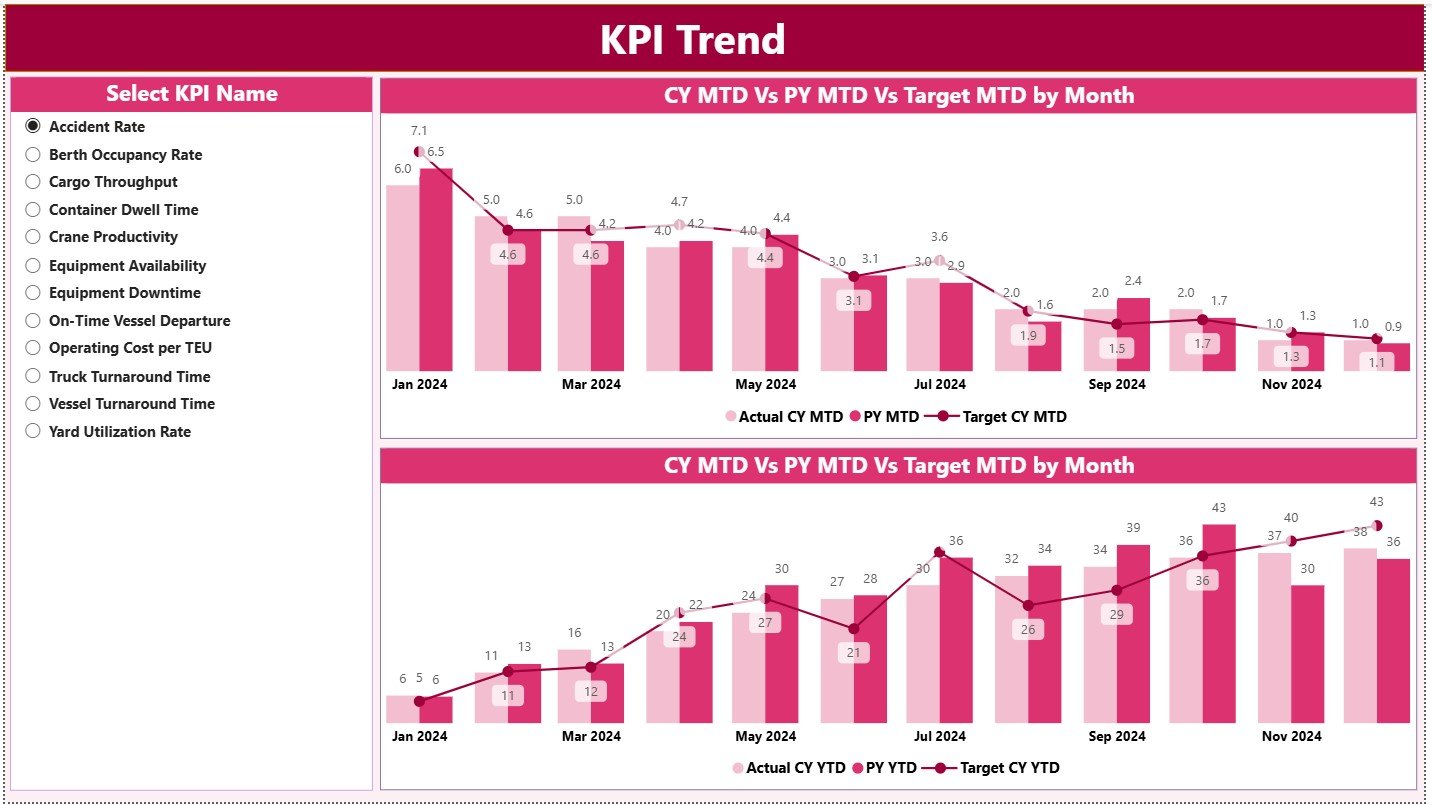
The KPI Trend Page focuses on performance movement over time.
Key Visuals on This Page
This page includes two combo charts:
-
MTD Trend Chart
-
YTD Trend Chart
Each chart displays:
-
Current Year Actual
-
Previous Year Actual
-
Target values
KPI Selection Slicer
A slicer on the left allows users to select a specific KPI. Consequently, the charts update instantly to show trends for that KPI.
This feature helps users:
-
Identify seasonal patterns
-
Compare year-over-year performance
-
Evaluate target setting accuracy
3) KPI Definition Page: Why Is Drill-Through Important?
The KPI Definition Page acts as a drill-through page.
This page remains hidden from the main navigation. However, users can access it by drilling through from the Summary Page.
Information Available on This Page
-
KPI Formula
-
KPI Definition
-
KPI Type (LTB or UTB)
This page improves transparency and ensures everyone understands KPI logic.
Navigation Tip
To return to the Summary Page, simply click the Back button at the top-left corner.
Click to Purchases Port Operations KPI Dashboard in Power BI
Advantages of Port Operations KPI Dashboard in Power BI
Implementing this dashboard delivers measurable benefits across operations and management.
Key Advantages
✅ Centralized performance tracking
✅ Faster decision-making
✅ Clear visibility into target achievement
✅ Reduced manual reporting effort
✅ Improved accountability across teams
✅ Easy Excel-based data updates
✅ Interactive and visually appealing reports
As a result, ports gain better control over operations and costs.
How Does This Dashboard Support Better Decision-Making?
The dashboard transforms raw data into actionable insights.
Decision-Making Benefits
-
Identify underperforming KPIs early
-
Focus resources on critical operational areas
-
Monitor progress against strategic goals
-
Improve planning and forecasting accuracy
-
Align teams with measurable objectives
Therefore, leadership moves from reactive to proactive management.
Best Practices for the Port Operations KPI Dashboard in Power BI
To maximize the value of this dashboard, follow these best practices.
Data Management Best Practices
-
Update Excel data regularly
-
Use consistent KPI names across sheets
-
Enter month dates using the first day of the month
-
Validate data before refreshing Power BI
Dashboard Usage Best Practices
-
Review MTD performance weekly
-
Analyze YTD trends monthly
-
Use KPI groups to segment analysis
-
Drill through KPI definitions for clarity
Governance Best Practices
-
Standardize KPI definitions
-
Limit manual overrides
-
Document KPI formulas clearly
-
Train users on interpretation
By following these practices, you ensure long-term dashboard success.
Click to Purchases Port Operations KPI Dashboard in Power BI
Who Can Use a Port Operations KPI Dashboard in Power BI?
This dashboard suits a wide range of stakeholders.
Ideal Users
-
Port Authorities
-
Terminal Operations Managers
-
Logistics and Supply Chain Teams
-
Operations Analysts
-
Senior Management and Executives
Each group benefits from tailored insights without technical barriers.
Conclusion: Why Should You Use a Port Operations KPI Dashboard in Power BI?
A Port Operations KPI Dashboard in Power BI empowers ports to manage performance with clarity, speed, and confidence.
Instead of relying on manual reports and delayed insights, this dashboard provides real-time visibility into operational efficiency, target achievement, and trends. Moreover, its Excel-based data structure ensures ease of use, while Power BI visuals deliver impactful insights.
Therefore, if you aim to improve productivity, reduce delays, and strengthen decision-making, this dashboard becomes an essential tool.
Frequently Asked Questions (FAQs)
What is a Port Operations KPI Dashboard in Power BI used for?
It helps ports monitor operational KPIs, compare actual vs target performance, and analyze trends using interactive visuals.
Do I need advanced Power BI skills to use this dashboard?
No. You only need basic Excel skills to update data. Power BI visuals update automatically after refresh.
Can I add new KPIs to the dashboard?
Yes. You can add new KPIs by updating the KPI Definition, Input_Actual, and Input_Target sheets.
How often should I update the dashboard?
You should update it monthly or weekly, depending on operational reporting needs.
Is this dashboard suitable for different port sizes?
Yes. The dashboard scales easily for small, medium, and large port operations.
Click to Purchases Port Operations KPI Dashboard in Power BI
Visit our YouTube channel to learn step-by-step video tutorials