Managing port tenders involves large investments, strict timelines, multiple stakeholders, and high financial risk. Therefore, port authorities, logistics companies, infrastructure firms, and bidding teams must monitor tender performance continuously. However, when tender data stays scattered across multiple Excel files, email chains, and manual reports, visibility drops and decision-making slows down.
That is exactly where the Port Tender KPI Dashboard in Excel becomes a powerful and practical solution.
This ready-to-use Excel KPI dashboard converts raw port tender data into structured KPIs, trend analysis, and visual insights. It allows teams to track tender performance efficiently, compare targets versus actuals, and identify risks early—without using expensive BI tools.
In this article, we explain the complete structure, sheets, KPIs, workflow, advantages, improvement opportunities, and best practices of the Port Tender KPI Dashboard in Excel.
What Is a Port Tender KPI Dashboard in Excel?
Click to Buy Port Tender KPI Dashboard in Excel
A Port Tender KPI Dashboard in Excel is an analytical reporting template designed to monitor and evaluate key performance indicators related to port tenders. It helps organizations track:
-
Tender volume and status
-
Estimated and awarded tender value
-
Profit and profit margin
-
Bid performance against targets
-
Monthly, MTD, and YTD trends
-
Historical comparisons with previous year data
Because the dashboard is built in Excel, users benefit from flexibility, automation, and familiarity while still gaining strong analytical insights.
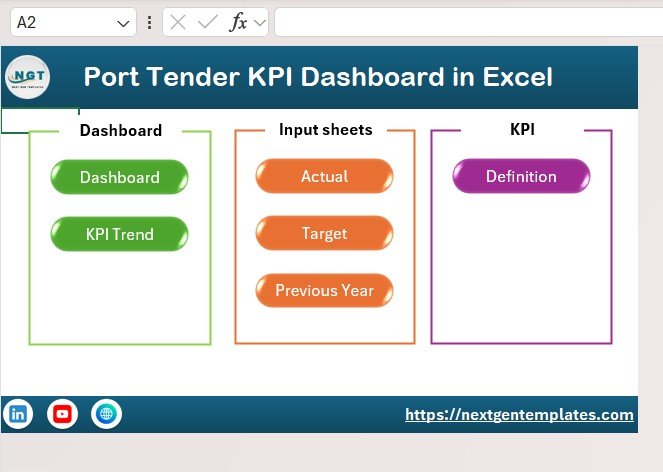
Overview of Dashboard Structure
This KPI dashboard consists of 7 well-structured worksheets, each serving a specific purpose in the performance-tracking workflow.
1. Summary Page (Index Sheet)
The Summary Page acts as the navigation hub of the dashboard.
Key Features:
-
Six clickable buttons
-
One-click navigation to major sheets
-
Clean layout for easy usability
This sheet ensures smooth movement across the dashboard, especially during management reviews or presentations.
Click to Buy Port Tender KPI Dashboard in Excel
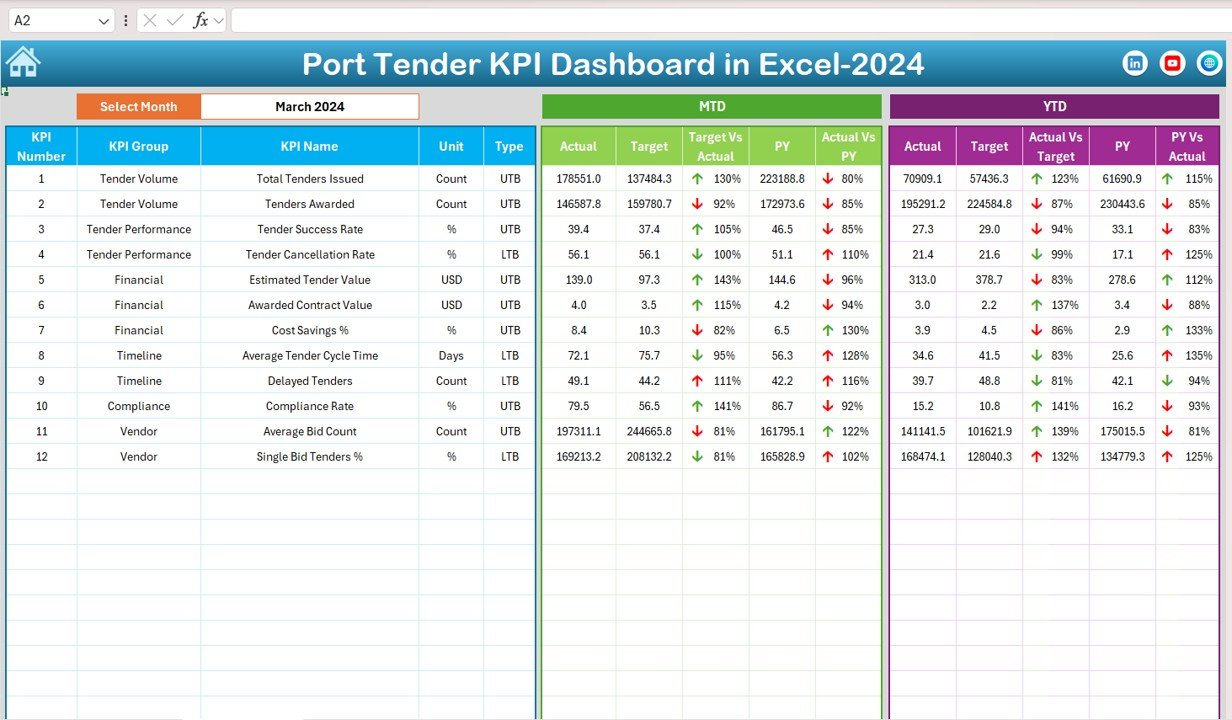
2. Dashboard Sheet Tab (Main KPI View)
The Dashboard Sheet is the heart of the KPI system.
Month Selector
-
Located at cell D3
-
Select any month from the dropdown
-
All KPI values update instantly for that month
KPIs Displayed
For each KPI, the dashboard shows:
MTD (Month-to-Date)
-
Actual
-
Target
-
Previous Year
-
Target vs Actual
-
PY vs Actual
YTD (Year-to-Date)
-
Actual
-
Target
-
Previous Year
-
Target vs Actual
-
PY vs Actual
Conditional Formatting
-
🔼 Green arrow → Positive performance
-
🔽 Red arrow → Negative performance
This allows users to quickly identify improvement areas without deep data analysis.
Click to Buy Port Tender KPI Dashboard in Excel
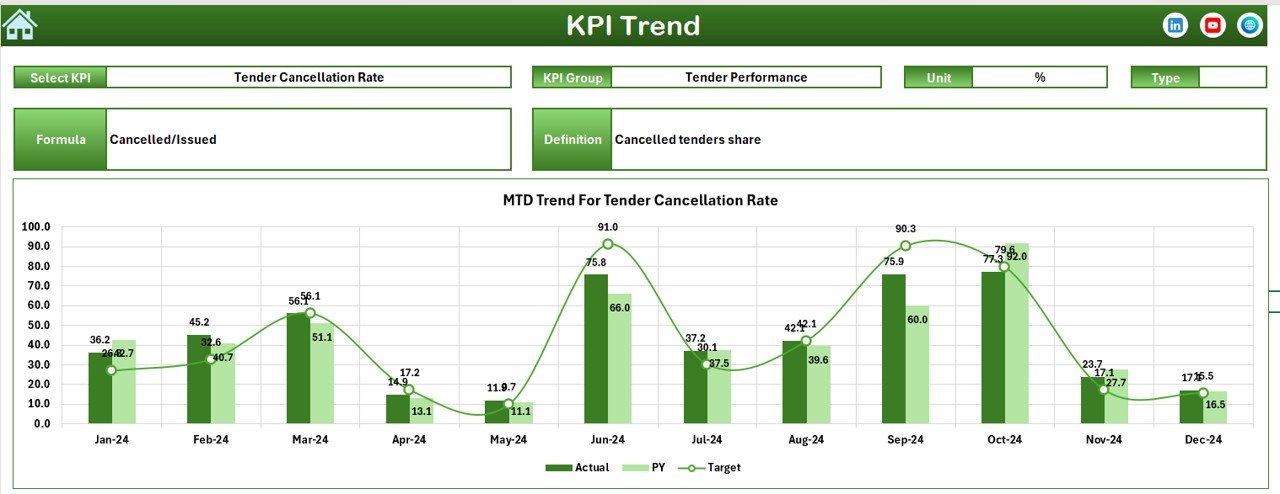
3. Trend Sheet Tab
The Trend Sheet provides detailed analysis for individual KPIs.
KPI Selection
-
KPI dropdown available in cell C3
Information Displayed
-
KPI Name
-
KPI Group
-
Unit of KPI
-
KPI Type (Lower the Better / Upper the Better)
-
KPI Formula
-
KPI Definition
Trend Charts
-
MTD trend chart
-
YTD trend chart
-
Actual vs Target vs Previous Year
This sheet helps teams understand performance patterns, seasonality, and consistency.’
Click to Buy Port Tender KPI Dashboard in Excel
4. Actual Numbers Input Sheet
This sheet is used for data entry of actual performance values.
How It Works:
-
Select the first month of the year in cell E1
-
Enter MTD and YTD actual values for each KPI
-
The dashboard updates automatically
This ensures accurate and controlled data input without disturbing formulas or visuals.
Click to Buy Port Tender KPI Dashboard in Excel
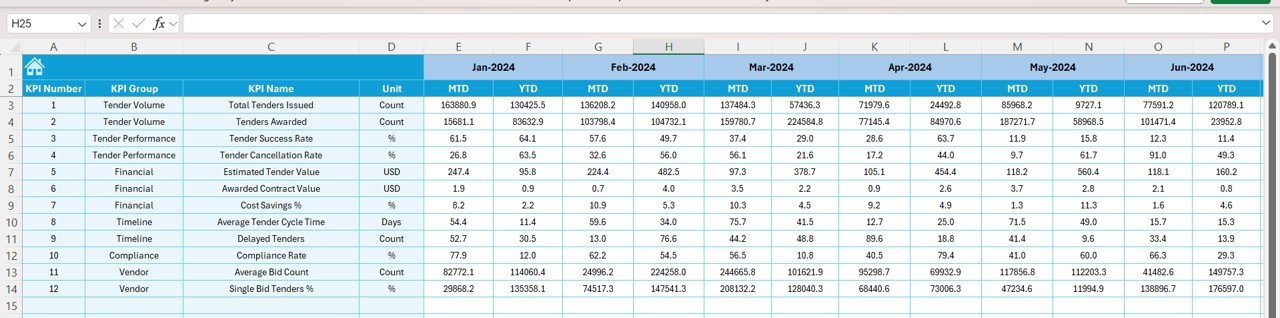
5. Target Sheet Tab
The Target Sheet stores performance goals.
Key Features:
-
Monthly MTD targets
-
YTD targets for each KPI
-
Easy target revision based on strategy changes
Targets allow organizations to measure planned versus actual performance clearly.
Click to Buy Port Tender KPI Dashboard in Excel
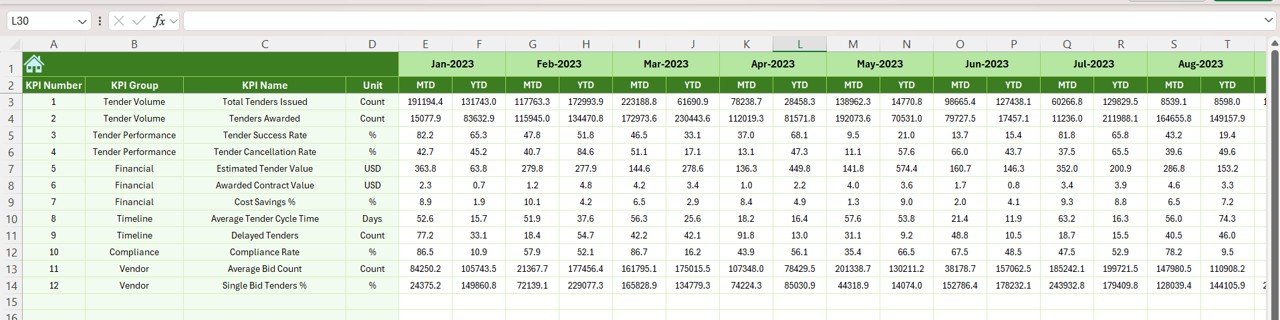
6. Previous Year Number Sheet Tab
This sheet holds historical data.
Purpose:
-
Store previous year MTD and YTD values
-
Enable year-over-year performance comparison
-
Identify long-term improvement or decline
This historical view strengthens strategic planning and benchmarking.
Click to Buy Port Tender KPI Dashboard in Excel
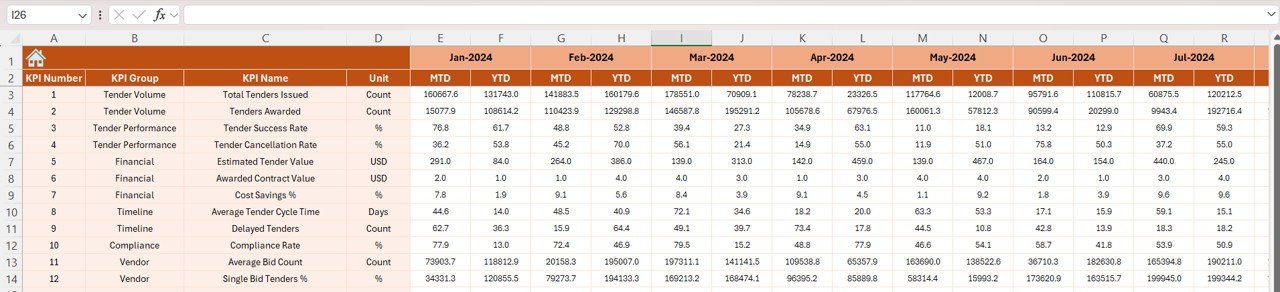
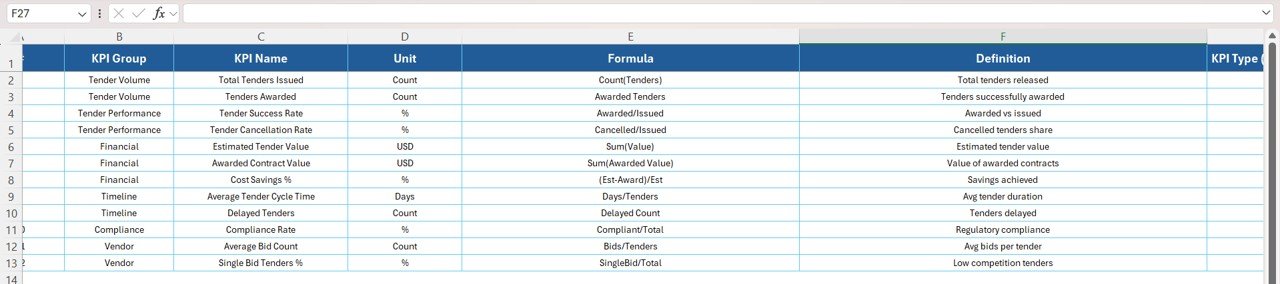
7. KPI Definition Sheet Tab
The KPI Definition Sheet acts as the master reference.
Fields Included:
-
KPI Name
-
KPI Group
-
Unit
-
Formula
-
KPI Definition
-
KPI Type (LTB / UTB)
This sheet ensures transparency and consistency across users, teams, and reporting cycles.
Why Use a Port Tender KPI Dashboard in Excel?
Port tender management requires clarity, speed, and accuracy. This dashboard delivers all three.
Key Reasons:
-
Centralized KPI monitoring
-
Automated calculations
-
Clear MTD and YTD tracking
-
Easy month selection
-
Strong visual storytelling
-
No dependency on external BI tools
As a result, decision-makers gain confidence and control over tender operations.
Advantages of the Port Tender KPI Dashboard
Click to Buy Port Tender KPI Dashboard in Excel
1. Improved Decision-Making
Leadership teams view real-time performance and act faster.
2. Better Tender Performance Tracking
Teams track tender success, profit margin, and evaluation status clearly.
3. Time Savings
Automated formulas eliminate manual reporting work.
4. Strong Financial Visibility
Profit, value, and margin KPIs highlight financial health.
5. User-Friendly Design
Excel familiarity reduces training effort.
6. Flexible and Customizable
KPIs, targets, and formulas can be adjusted easily.
Opportunities for Improvement in the Dashboard
Click to Buy Port Tender KPI Dashboard in Excel
Although the dashboard is powerful, further enhancements can add more value.
Possible Improvements:
-
Add vendor-wise or bidder-wise KPI breakdown
-
Introduce risk scoring for tenders
-
Add tender cycle time KPIs
-
Include cargo-type performance indicators
-
Automate data import using Power Query
-
Add forecast and pipeline analysis
These upgrades make the dashboard even more strategic.
Best Practices for Using the Dashboard
Click to Buy Port Tender KPI Dashboard in Excel
Update actual numbers monthly without delay
Review KPI trends, not just single-month values
Set realistic yet challenging targets
Maintain consistent KPI definitions
Use YTD insights for strategic planning
Protect formula cells to avoid errors
Following these practices ensures long-term dashboard accuracy and reliability.
Who Should Use This Dashboard?
-
Port Authorities
-
Shipping & Logistics Companies
-
Infrastructure Development Firms
-
Tender & Bid Management Teams
-
Finance and Commercial Teams
-
Senior Management and Decision-Makers
Conclusion
Click to Buy Port Tender KPI Dashboard in Excel
The Port Tender KPI Dashboard in Excel provides a structured, reliable, and visually powerful way to monitor tender performance. With seven well-designed worksheets, automated KPI tracking, trend analysis, and historical comparison, this dashboard transforms raw tender data into actionable insights.
Because it runs entirely in Excel, organizations gain advanced analytics without added software cost. When used consistently, this dashboard improves transparency, financial control, and strategic decision-making in port tender management.
Frequently Asked Questions (FAQs)
Click to Buy Port Tender KPI Dashboard in Excel
1. Can I customize KPIs in this dashboard?
Yes, you can add, remove, or modify KPIs from the KPI Definition sheet.
2. Does the dashboard support MTD and YTD analysis?
Yes, both MTD and YTD metrics are fully automated.
3. Can I track previous year performance?
Yes, the Previous Year sheet enables year-over-year comparison.
4. Is this dashboard suitable for large port projects?
Yes, it works well for both small and large-scale port tenders.
5. Do I need advanced Excel skills?
No, basic Excel knowledge is sufficient to use the dashboard.
6. Can this dashboard be shared with management?
Yes, the Summary and Dashboard sheets are ideal for presentations.
Visit our YouTube channel to learn step-by-step video tutorials
Youtube.com/@NeotechNavigators
Watch the step-by-step video tutorial:
Click to Buy Port Tender KPI Dashboard in Excel