In today’s fast-growing poultry industry, data is the key to success. Whether you manage a small-scale chicken farm or a large commercial operation, tracking the right performance metrics helps you improve productivity, control costs, and boost profits.
That’s where the Poultry Farming KPI Dashboard in Excel comes in. This ready-to-use Excel-based tool allows you to monitor essential Key Performance Indicators (KPIs) that matter most to your farm’s efficiency — from production output and feed conversion to mortality and profitability.
In this article, we’ll explore how this dashboard works, its key features, advantages, best practices, and how it can transform the way you manage your poultry business.
Click to Purchases Poultry Farming KPI Dashboard in Excel
🧩 What Is a Poultry Farming KPI Dashboard in Excel?
A Poultry Farming KPI Dashboard is a performance tracking system built in Microsoft Excel that brings together all your farm’s critical data in one place.
It allows farm owners, managers, and supervisors to:
-
Track production, feed usage, and flock health.
-
Compare monthly and yearly results.
-
Visualize trends using charts and conditional formatting.
-
Monitor targets vs. actuals for both MTD (Month-to-Date) and YTD (Year-to-Date).
With this tool, poultry businesses can make faster and better-informed decisions — without needing advanced software or coding skills.
📊 Key Features of the Poultry Farming KPI Dashboard
This Excel dashboard includes seven structured worksheet tabs, each designed for a specific purpose to ensure accuracy, clarity, and ease of use.
1️⃣ Home Sheet — The Command Center
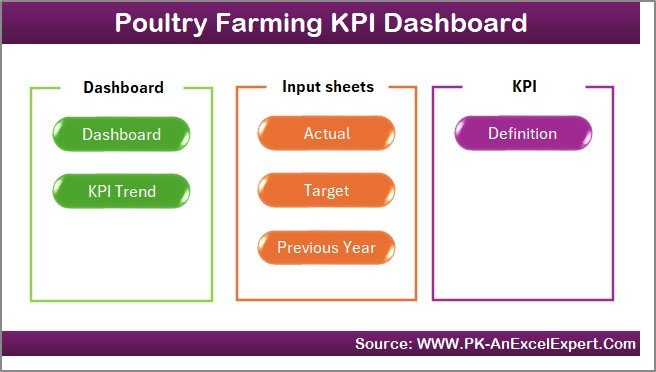
The Home Sheet acts as the index or navigation page. It contains six clickable buttons that instantly take you to the respective worksheets.
This design helps you move quickly across pages without scrolling or searching — making it ideal for daily operations.
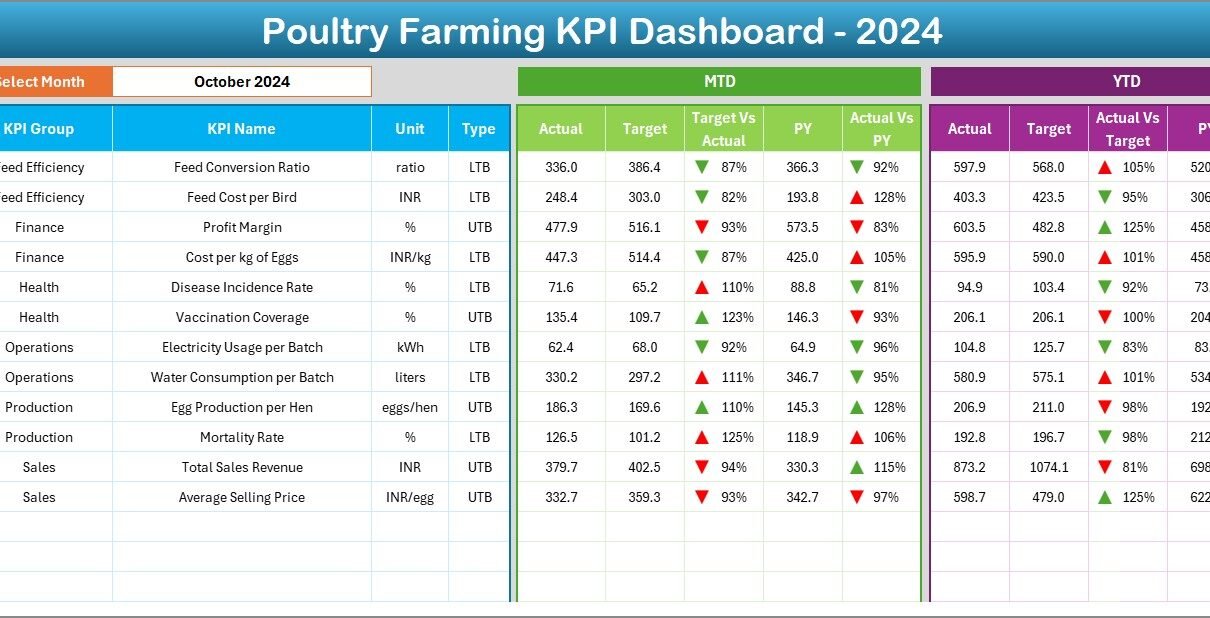
2️⃣ Dashboard Sheet — The Main Visualization Page
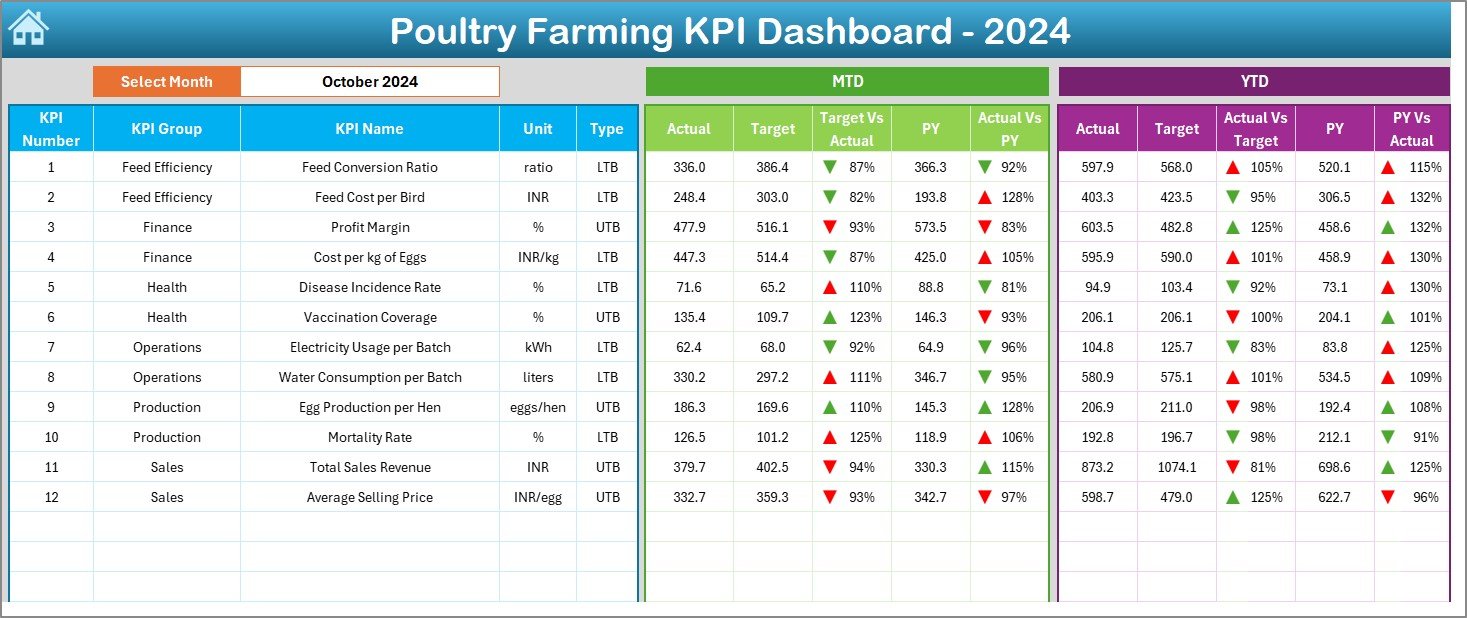
The Dashboard Sheet is the heart of the file. It visually summarizes your KPIs and gives a real-time snapshot of your farm’s performance.
Key Highlights:
-
📅 Month Selector (Cell D3): Choose any month from the drop-down to update the dashboard instantly.
-
📈 MTD and YTD Views: See both Month-to-Date and Year-to-Date actuals, targets, and previous year values.
-
🎯 Comparisons:
-
Target vs Actual percentage
-
PY vs Actual percentage
-
-
🟢 Visual Indicators: Conditional formatting with upward (▲) and downward (▼) arrows to indicate performance status.
-
📊 Dynamic Updates: All charts and tables automatically change based on the selected month.
This page helps managers see exactly how well the farm is performing — and where improvements are needed.
Click to Purchases Poultry Farming KPI Dashboard in Excel
3️⃣ KPI Trend Sheet — Tracking Progress Over Time
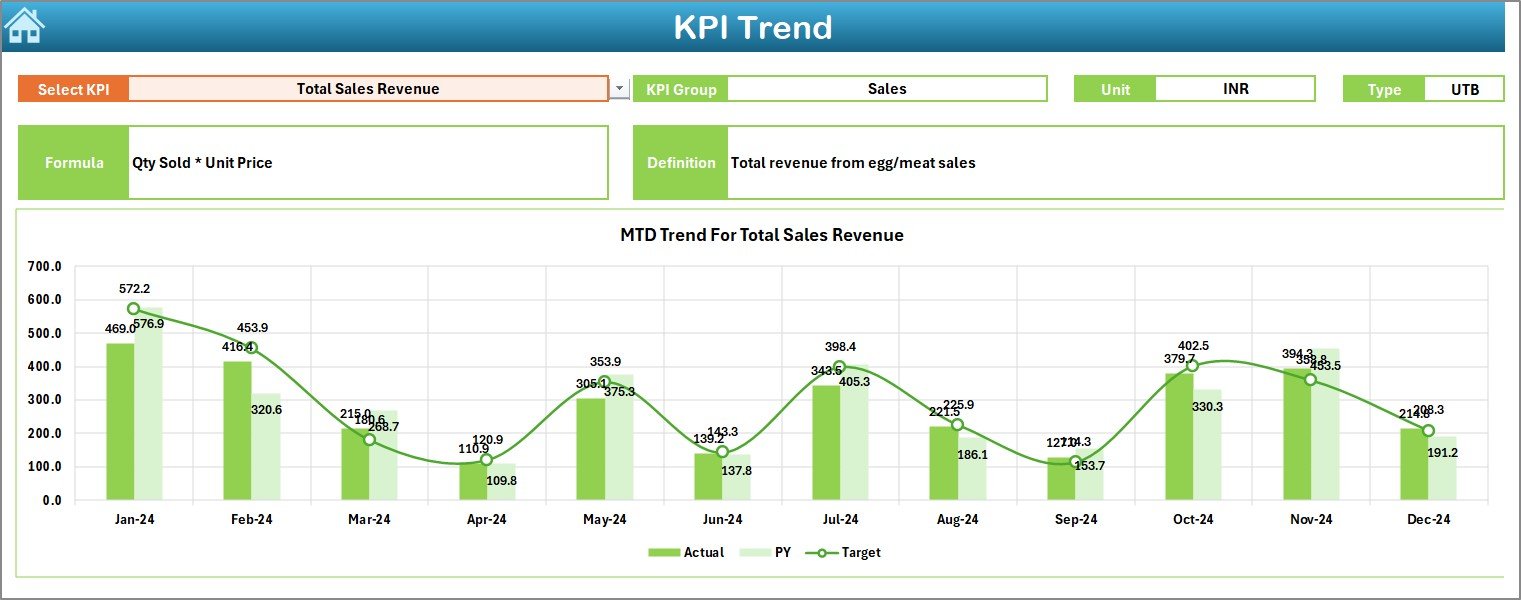
The KPI Trend Sheet provides detailed insights into individual KPIs.
Features:
-
🎚️ KPI Selector (Cell C3): Choose any KPI name from a drop-down list.
-
📋 KPI Details: Automatically display KPI Group, Unit, Type (Lower the Better or Upper the Better), Formula, and Definition.
-
📈 Trend Charts:
-
MTD trends for Actual, Target, and Previous Year (PY).
-
YTD trends for the same.
-
These visuals help identify whether a KPI is improving or declining over time. For example, you can track if your Feed Conversion Ratio (FCR) is getting better month after month.
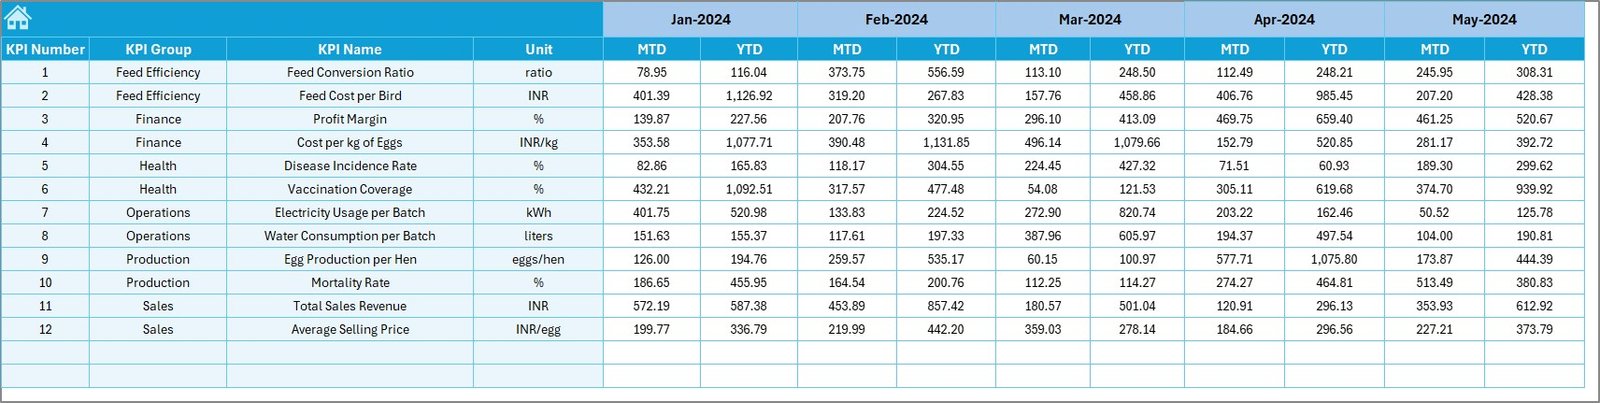
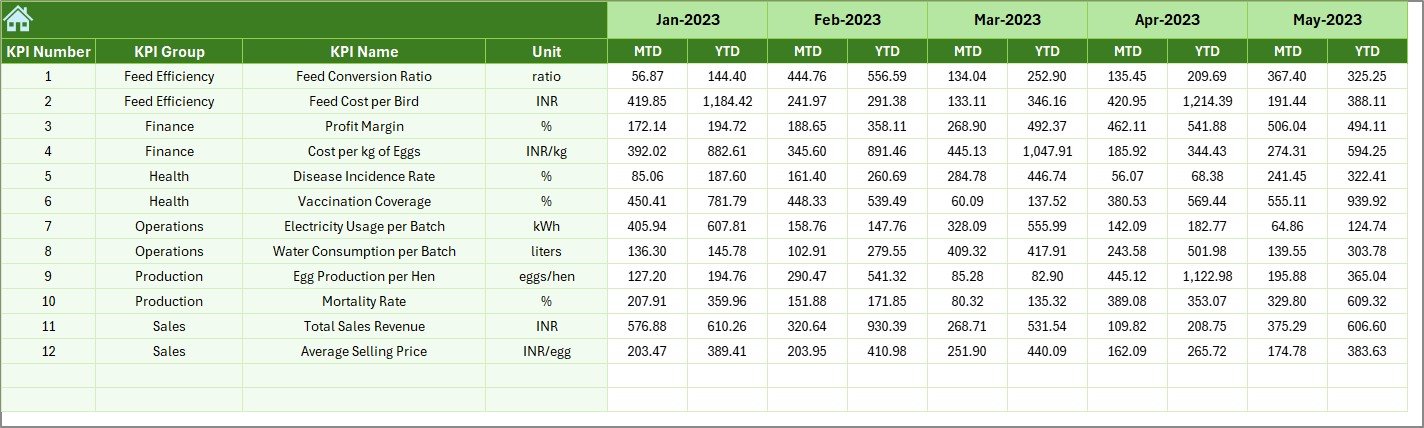
4️⃣ Actual Numbers Input Sheet — Data Entry Made Easy
This sheet is used to record your monthly MTD and YTD actual numbers for each KPI.
How it works:
-
Enter the first month of your fiscal year in cell E1.
-
Record values for each KPI and month.
-
All dashboard visuals automatically update.
This structure ensures data accuracy while keeping the system simple to maintain.
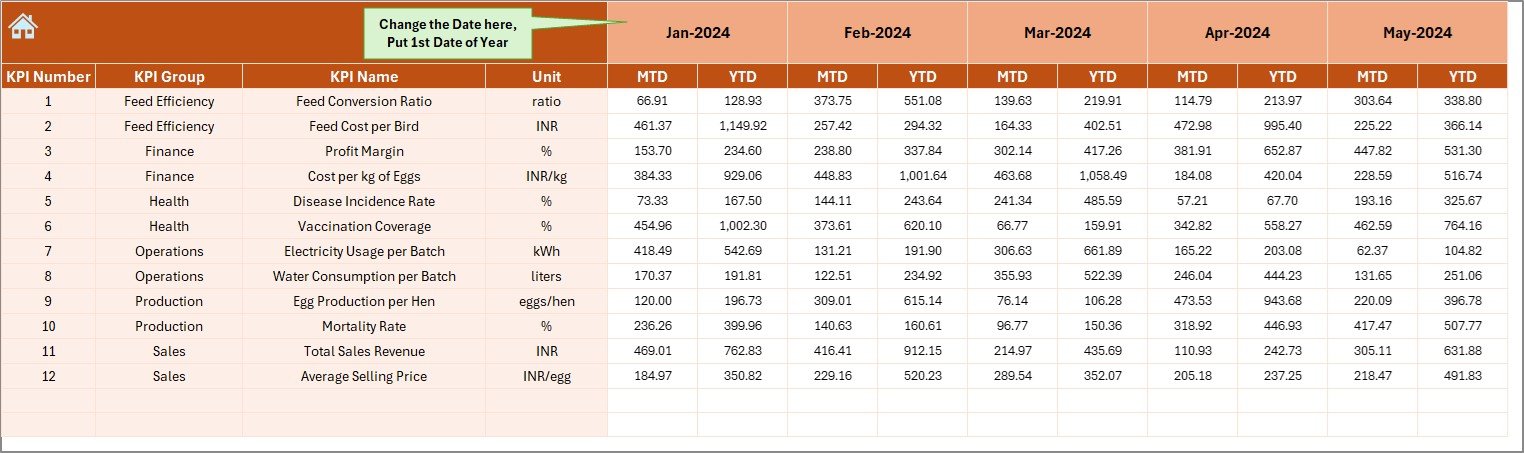
5️⃣ Target Sheet — Setting Benchmarks for Success
The Target Sheet defines your monthly and yearly goals. Here, you can input target values for each KPI — both MTD and YTD.
Setting clear targets helps you evaluate performance objectively and motivate your team to achieve measurable results.
6️⃣ Previous Year Numbers Sheet — For Historical Comparison
This tab stores data from the previous year, allowing for year-over-year comparisons.
By viewing Current Year vs. Previous Year trends, you can assess how operational changes have affected farm efficiency.
7️⃣ KPI Definition Sheet — Your KPI Library
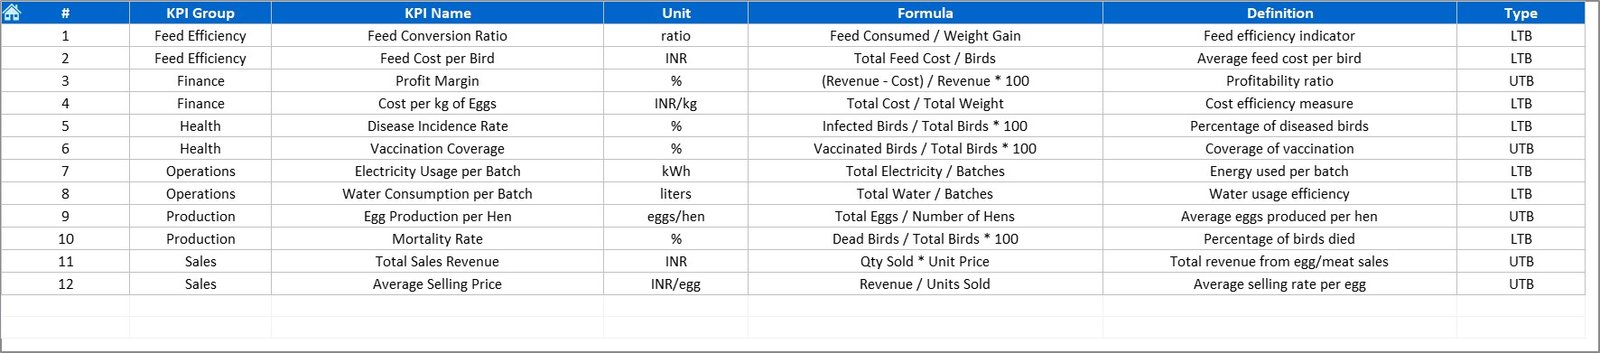
This sheet acts as a dictionary of all metrics.
Columns include:
-
KPI Name
-
KPI Group
-
Unit
-
Formula
-
Definition
It standardizes how every metric is calculated and interpreted — ensuring everyone in the organization measures performance the same way.
📈 How the Poultry Farming KPI Dashboard Works
The workflow of the dashboard is intuitive:
-
Input data into the Actual, Target, and Previous Year sheets.
-
Select the desired month from the Dashboard drop-down.
-
The dashboard automatically calculates MTD and YTD comparisons.
-
Arrows and color formatting instantly show whether performance is improving or declining.
-
The Trend Sheet visualizes changes over time.
With just a few clicks, you get a complete overview of your farm’s productivity and profitability.
🐣 Common KPIs to Track in Poultry Farming
Here are some of the most useful KPIs you can include in your Poultry Farming Dashboard:
Production KPIs
-
Egg Production Rate (%) – Total eggs produced ÷ Total hens × 100
-
Feed Conversion Ratio (FCR) – Feed consumed ÷ Weight gained
-
Mortality Rate (%) – Birds lost ÷ Total flock × 100
-
Average Daily Gain (g/day) – Weight gain ÷ Number of days
Financial KPIs
-
Cost per Bird (₹/$) – Total cost ÷ Number of birds
-
Revenue per Batch (₹/$) – Total sales revenue per flock cycle
-
Gross Profit Margin (%) – (Revenue − Cost) ÷ Revenue × 100
Operational KPIs
-
Feed Consumption per Bird (kg)
-
Water Consumption per Bird (liters)
-
Electricity Cost per Batch (₹/$)
-
Manpower Efficiency (%) – Output per employee
Customer & Quality KPIs
-
Customer Complaint Rate (%)
-
Order Fulfillment Accuracy (%)
-
On-Time Delivery (%)
By tracking these KPIs, you can easily measure farm efficiency, cost control, and production output — the three pillars of successful poultry management.
Click to Purchases Poultry Farming KPI Dashboard in Excel
🌟 Advantages of Using the Poultry Farming KPI Dashboard in Excel
✅ 1. Centralized Data Management
All your operational, financial, and production metrics are available in one file.
✅ 2. Visual Performance Tracking
Conditional formatting and charts make it easy to see performance at a glance.
✅ 3. Accurate Decision-Making
Comparing actual vs. target and year-over-year numbers helps identify areas for improvement.
✅ 4. Time and Cost Savings
No complex software or additional tools are required — Excel does it all.
✅ 5. Customization Flexibility
Add, remove, or modify KPIs easily to match your farm’s unique operations.
✅ 6. Historical Trend Analysis
Compare current results with previous years to identify long-term performance trends.
✅ 7. Real-Time Monitoring
Instant updates ensure you’re always working with the latest data.
✅ 8. Simplicity and Accessibility
Excel’s familiar interface means no special training is required.
🧠 How This Dashboard Helps Poultry Farmers
This dashboard turns complex poultry data into actionable insights. With just one glance, you can:
-
Identify issues like high mortality or feed waste.
-
Optimize resource usage and reduce cost per bird.
-
Track seasonal trends and plan production accordingly.
-
Communicate performance clearly with your staff or investors.
In short, it turns your farm data into a strategic advantage.
Click to Purchases Poultry Farming KPI Dashboard in Excel
🧭 Best Practices for Using the Poultry Farming KPI Dashboard
To get the most out of your dashboard, follow these best practices:
🐓 1. Update Data Consistently
Enter actual and target values at the end of each month for accurate MTD and YTD insights.
📅 2. Set Realistic Targets
Use historical data to create achievable, measurable goals.
🧩 3. Keep Data Clean
Avoid duplicate KPI names and empty rows — they may cause formula errors.
📈 4. Focus on Key Metrics
Don’t overload the dashboard with unnecessary KPIs. Focus on 15–20 key metrics that drive decisions.
🔍 5. Compare Periodically
Review trends monthly and quarterly to monitor long-term improvement.
💬 6. Share Reports Regularly
Use the dashboard for team discussions to encourage accountability and goal alignment.
💡 7. Customize Visuals
Use Excel charts, slicers, and colors that make interpretation quick and intuitive.
📊 8. Back Up Data
Keep copies of your monthly inputs to prevent accidental data loss.
Following these practices ensures accuracy, reliability, and long-term usefulness.
🧩 Example of KPI Analysis
Let’s say your Feed Conversion Ratio (FCR) target for June is 1.8, but your actual FCR is 2.1.
-
The dashboard will show a red ▼ icon for that month.
-
The Target vs. Actual (%) column will highlight the negative variance.
-
On the Trend Chart, you’ll notice the FCR trend increasing — indicating inefficiency.
Now, you can analyze causes such as feed quality, temperature, or disease, and take corrective measures immediately.
🪶 How It Supports Business Decision-Making
With this dashboard, poultry owners can:
-
Spot performance gaps early.
-
Forecast production based on current data.
-
Adjust feed, staffing, or capacity.
-
Increase profitability by optimizing input-output ratios.
-
Present professional reports to investors or partners.
It empowers decision-makers with clear data and visual evidence.
🧮 Customizing the Dashboard
Since the dashboard is Excel-based, you can easily:
-
Add more KPIs like Vaccine Cost per Bird or Broiler Weight Gain (%).
-
Modify the layout to match your branding.
-
Insert extra charts for specific insights such as region-wise or flock-wise performance.
-
Automate calculations with formulas or macros.
This flexibility ensures your dashboard evolves as your poultry business grows.
🏁 Conclusion
The Poultry Farming KPI Dashboard in Excel is not just a spreadsheet — it’s a powerful management system. It provides real-time insights into production, operations, and finance — empowering you to make confident, data-driven decisions.
With clear visuals, automated calculations, and full customization options, this tool simplifies performance monitoring for poultry farmers of all sizes.
If you want to transform your poultry business with professional data insights, this Excel dashboard is your perfect starting point.
Click to Purchases Poultry Farming KPI Dashboard in Excel
❓ Frequently Asked Questions (FAQs)
1. What is the Poultry Farming KPI Dashboard in Excel?
It’s an Excel-based performance tool that tracks production, cost, and efficiency KPIs for poultry farms.
2. Who can use this dashboard?
Farm owners, supervisors, and business analysts managing poultry operations can all use it.
3. How do I update data?
Simply enter actual, target, and previous year numbers into their respective sheets and select the desired month from the dashboard.
4. Can I add more KPIs?
Yes, it’s fully customizable — you can add or remove KPIs based on your needs.
5. Does it include MTD and YTD analysis?
Absolutely! It shows both Month-to-Date and Year-to-Date performance metrics with target comparisons.
6. Can I use it without advanced Excel skills?
Yes, it’s beginner-friendly — you only need basic Excel knowledge to operate it.
7. Is the dashboard dynamic?
Yes, all visuals and tables update automatically once you refresh the data.
8. What are the benefits of using this dashboard?
It saves time, improves decision-making, ensures accuracy, and simplifies farm management.
9. Can I track multiple farms or flocks?
Yes, by adding a “Farm Name” or “Batch ID” field, you can track separate data within the same file.
10. Where can I download it?
You can download the Poultry Farming KPI Dashboard in Excel directly from NextGenTemplates.com — your trusted source for professional business templates and dashboards.
Click to Purchases Poultry Farming KPI Dashboard in Excel
Visit our YouTube channel to learn step-by-step video tutorials