In today’s competitive business world, organizations must bring innovative products to market faster and more efficiently. Managing every phase of product development — from ideation to launch — requires not just creativity but also strong data-driven decision-making. That’s where the Product Development Dashboard in Power BI comes in.
This powerful, ready-to-use dashboard helps organizations visualize every aspect of their product lifecycle, track progress, manage budgets, and monitor departmental performance — all within an interactive and user-friendly Power BI interface.
Whether you’re managing a large R&D portfolio, overseeing multiple departments, or tracking project timelines and budgets, this dashboard empowers your team to make smarter, faster decisions.
Click to Purchases Product Development Dashboard in Power BI
What Is a Product Development Dashboard in Power BI?
A Product Development Dashboard in Power BI is a centralized analytical tool designed to monitor and evaluate key performance indicators (KPIs) related to product development. It connects directly to an Excel dataset that holds all relevant data — such as project status, budget, timelines, and departmental performance — and transforms it into visually engaging charts and insights.
Power BI enables teams to track project completion rates, identify delays, assess resource utilization, and analyze spending patterns — all through dynamic visuals. This not only saves time but also eliminates manual reporting and ensures complete transparency across teams.
Structure of the Product Development Dashboard
The Product Development Dashboard in Power BI consists of five analytical pages, each designed for specific insights. These pages include:
-
Overview Page
-
Department Analysis
-
Stage Analysis
-
Status Analysis
-
Monthly Trends
Each page serves a unique purpose and helps management monitor the product pipeline from different angles.
1. Overview Page
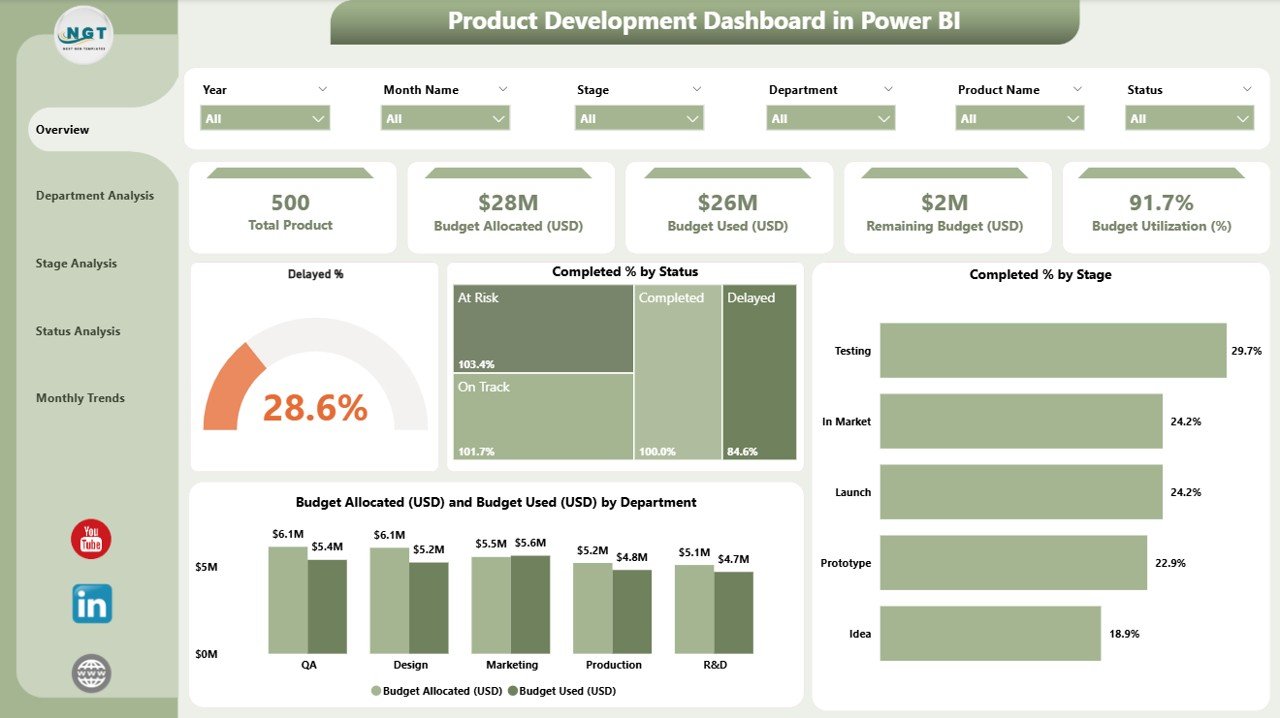
The Overview Page acts as the main control center of the dashboard. It summarizes the entire product development performance in a single view.
You can instantly track progress using five performance cards and four interactive charts that highlight the key indicators of product health and efficiency.
Cards Displayed:
-
Delayed Percentage (%)
-
Completed Percentage (%)
-
Total Projects
-
Budget Allocated (USD)
-
Budget Used (USD)
Charts Displayed:
-
Delayed % by Status
-
Completed % by Stage
-
Budget Allocated vs. Budget Used by Department
-
Project Distribution by Status
This page provides instant visibility into where the organization stands in its development journey, helping management quickly identify issues and areas needing attention.
2. Department Analysis
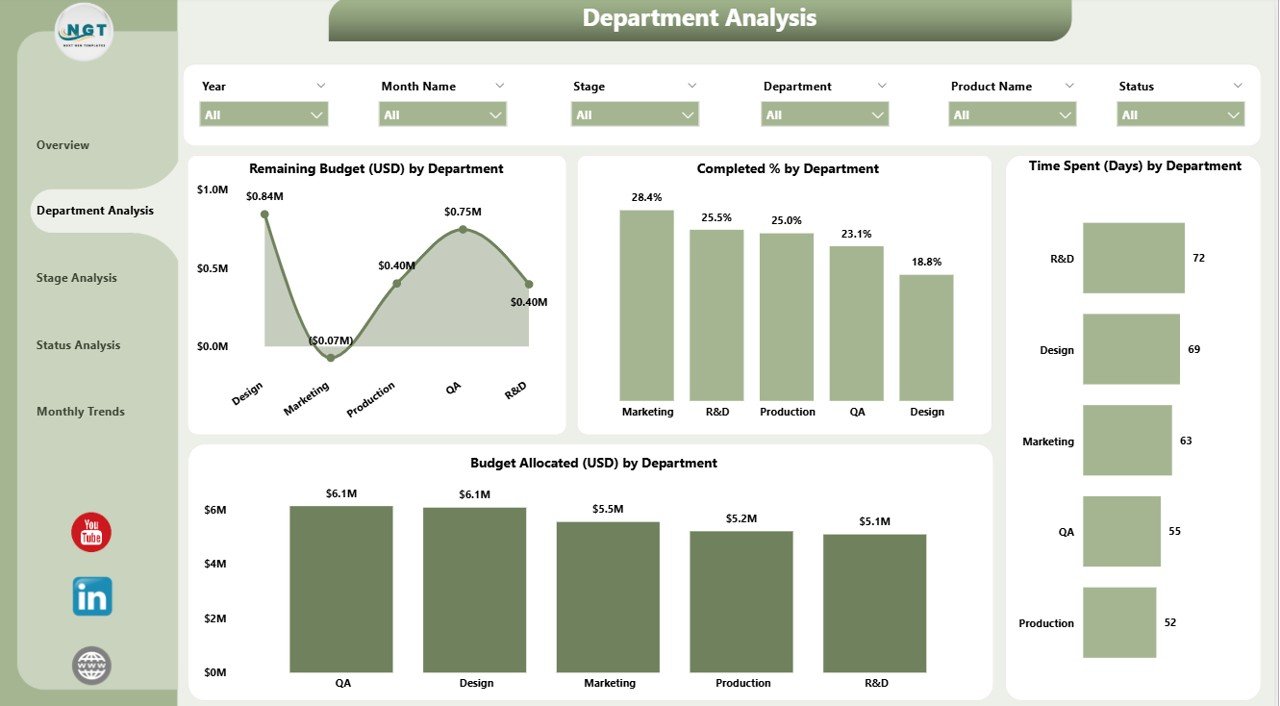
The Department Analysis Page breaks down the overall data by department, making it easier to compare performance, budgets, and timelines across teams.
Charts Displayed:
-
Remaining Budget (USD) by Department
-
Completed % by Department
-
Time Spent (Days) by Department
-
Budget Allocation (USD) by Department
This analysis helps management identify which departments are performing efficiently, which ones are overspending, and where process improvements are required.
It also encourages accountability, since each department’s metrics are transparently displayed and updated automatically from the Excel dataset.
3. Stage Analysis
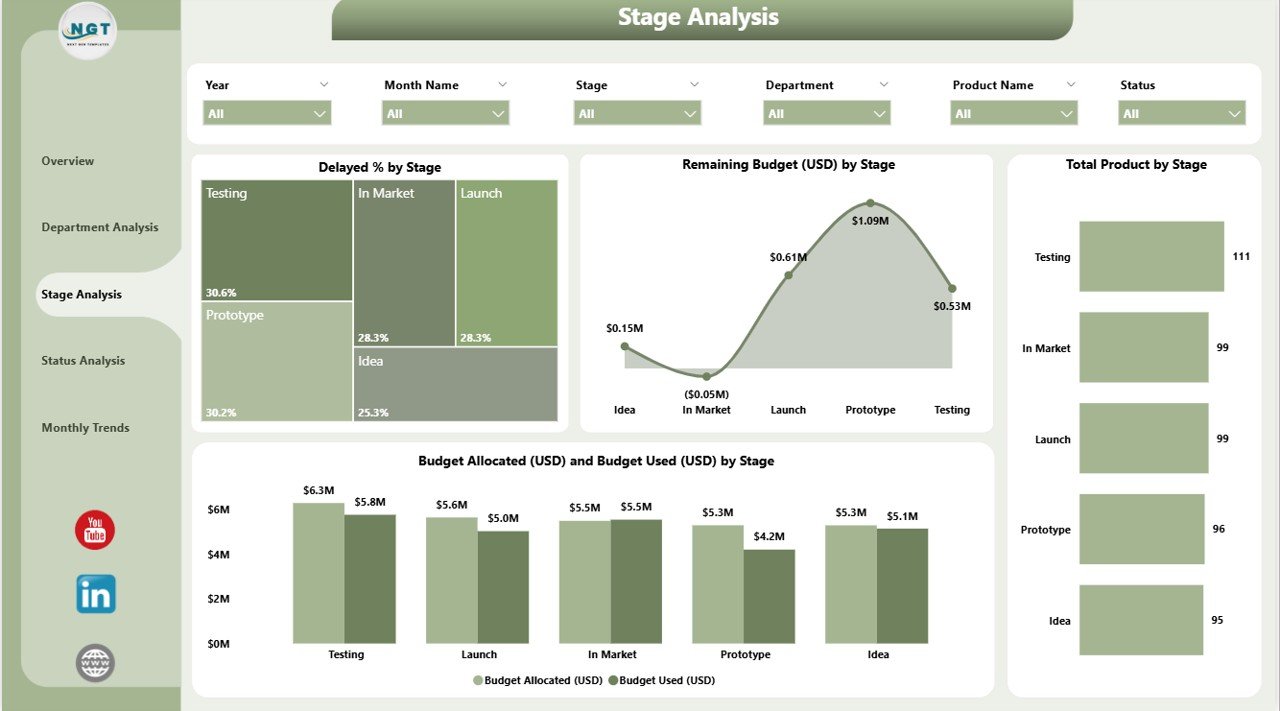
Every product development process goes through multiple stages — from concept creation and prototype design to testing and final launch. The Stage Analysis Page focuses on performance and budget utilization across these stages.
Charts Displayed:
-
Delayed % by Stage
-
Remaining Budget (USD) by Stage
-
Total Products by Stage
-
Budget Used (USD) by Stage
This helps project managers evaluate which stages consume the most resources, experience the most delays, or require additional funding.
With Power BI’s interactive filtering and slicers, you can instantly switch between product categories or departments to explore how different projects progress through each stage.
4. Status Analysis
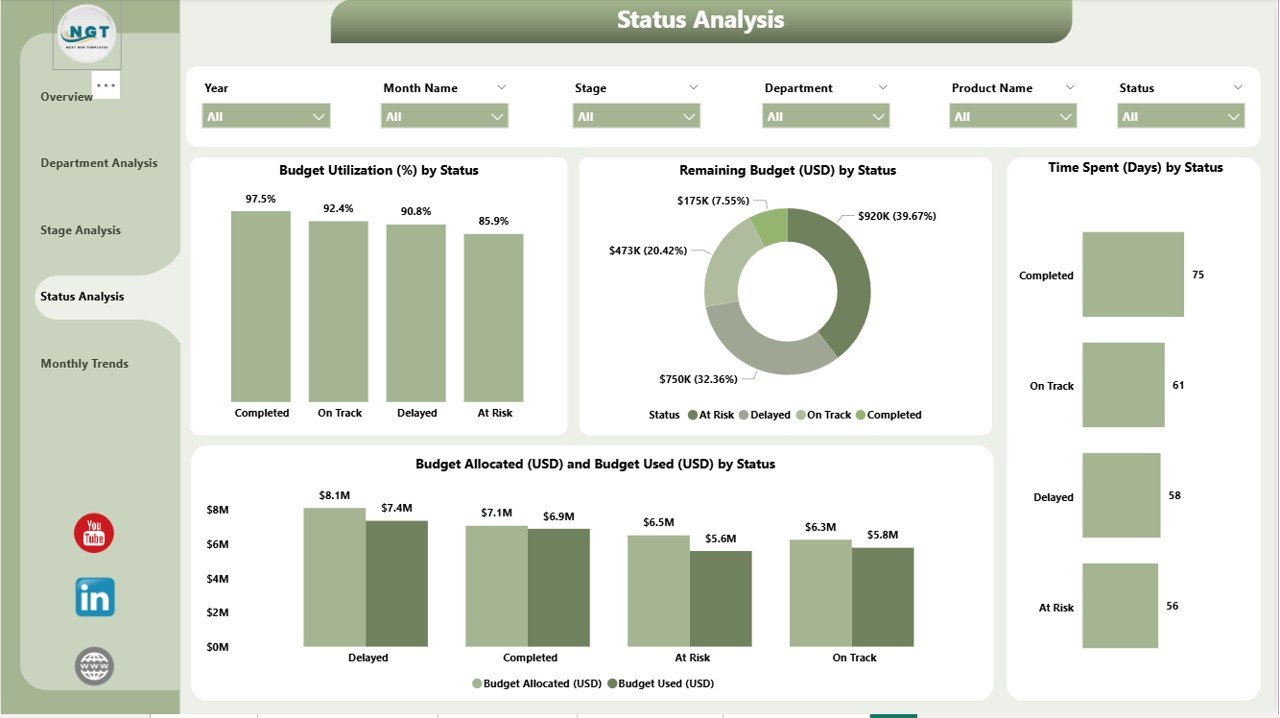
The Status Analysis Page provides an in-depth look into project progress and spending based on their current status — such as “In Progress,” “Completed,” “Delayed,” or “Pending Approval.”
Charts Displayed:
-
Budget Utilization (%) by Stage
-
Remaining Budget (USD) by Status
-
Time Spent (Days) by Status
-
Budget Allocated vs. Budget Used (USD) by Stage
By analyzing this data, teams can determine how well projects adhere to budgets and timelines. It also helps in identifying potential bottlenecks before they become costly delays.
Click to Purchases Product Development Dashboard in Power BI
5. Monthly Trends
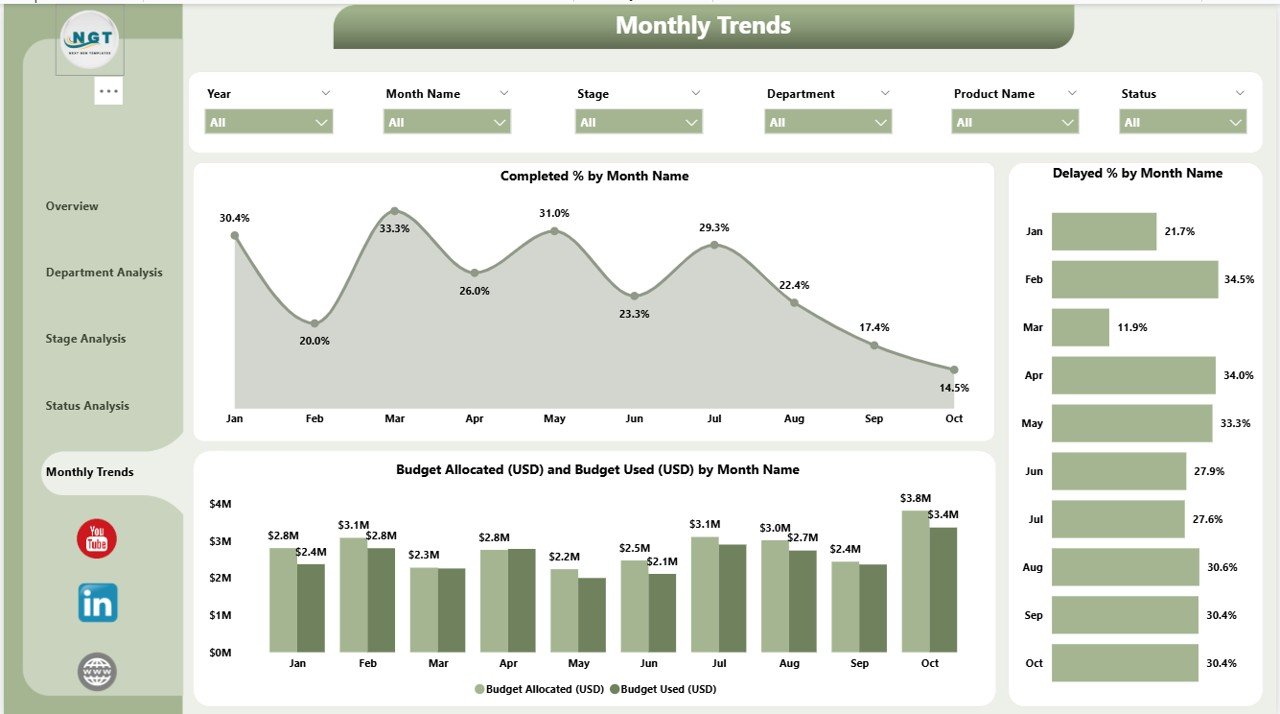
The Monthly Trends Page highlights performance variations over time. This is crucial for understanding seasonality, workflow efficiency, and spending trends.
Charts Displayed:
-
Completed % by Month
-
Delayed % by Month
-
Budget Allocated (USD) vs. Budget Used (USD) by Month
These insights allow management to anticipate resource needs, forecast future project performance, and fine-tune strategies based on data-backed evidence.
Why Every Business Needs a Product Development Dashboard
A Product Development Dashboard is not just a reporting tool; it’s a strategic asset that supports innovation and operational excellence.
Here are some of the reasons businesses rely on it:
-
Real-Time Visibility: Access up-to-date performance data anytime, anywhere.
-
Centralized Information: Combine all Excel data sources into one visual dashboard.
-
Informed Decision-Making: Base decisions on factual data rather than assumptions.
-
Improved Accountability: Track departmental and stage-level contributions clearly.
-
Efficient Budget Management: Avoid overspending by comparing allocated vs. used budgets.
-
Better Time Management: Identify delays early and act before they affect launch timelines.
Advantages of the Product Development Dashboard in Power BI
Implementing a Product Development Dashboard delivers a wide range of benefits. Let’s explore some of the key advantages:
1. Enhanced Transparency
The dashboard ensures everyone — from project managers to executives — can view real-time updates on project progress, cost, and deadlines.
2. Data-Driven Decisions
Instead of relying on manual reports or gut feeling, teams make decisions based on visual insights and factual data.
3. Streamlined Collaboration
All departments work using the same dataset and visuals, improving interdepartmental coordination and reducing confusion.
4. Budget Control
By tracking allocated and used budgets, management can easily identify areas of overspending or underutilization.
5. Risk Mitigation
By closely monitoring delays, project managers can take proactive measures to avoid major setbacks.
6. Time Efficiency
Automation through Power BI saves hours of manual data compilation and report generation.
7. Customization Flexibility
The dashboard can be customized to match organizational KPIs, stages, or departments effortlessly.
How to Use the Product Development Dashboard Effectively
To gain maximum benefits from your Power BI dashboard, follow these practical steps:
-
Update Excel Data Regularly: Ensure your underlying Excel data source is accurate and up to date.
-
Set Realistic Targets: Define measurable KPIs for completion rate, budget utilization, and delay percentage.
-
Use Filters and Slicers: Apply filters for department, status, or stage to narrow down insights.
-
Schedule Refreshes: Automate data refreshes to keep your visuals current.
-
Analyze Monthly Trends: Review monthly trends to forecast upcoming challenges.
-
Collaborate Across Teams: Share insights with all stakeholders through Power BI’s sharing and publishing options.
Best Practices for the Product Development Dashboard in Power BI
To ensure smooth functioning and reliable insights, follow these best practices:
1. Keep the Data Clean and Consistent
Regularly clean your Excel dataset to remove duplicates or inconsistencies. Consistent data ensures accuracy and reliability of visuals.
2. Maintain a Logical Data Model
Structure your data with clear relationships between tables (Projects, Departments, Budget, and Stages). This enhances calculation performance and accuracy.
3. Use Conditional Formatting
Leverage Power BI’s conditional formatting to highlight risk areas — such as overspent budgets or overdue projects — instantly.
4. Apply Meaningful KPIs
Avoid overloading the dashboard with unnecessary visuals. Focus only on KPIs that align with business goals.
5. Implement Role-Based Access
Restrict access based on team roles to maintain data confidentiality and relevance.
6. Automate Data Refresh
Use Power BI’s automatic refresh feature to ensure the dashboard always shows real-time data without manual updates.
7. Combine Visuals with Context
Always include textual explanations or tooltips to make data interpretations easier for non-technical users.
Use Cases of the Product Development Dashboard
This dashboard can be adapted for multiple business scenarios:
-
R&D Departments: Track innovation projects and prototype progress.
-
Manufacturing Companies: Monitor production design and testing cycles.
-
Software Firms: Manage sprints, feature development, and release timelines.
-
Marketing Teams: Evaluate product launch performance and promotional ROI.
-
Finance Teams: Control and audit departmental budgets for each product line.
Power BI Features That Make It Stand Out
Power BI offers several features that make this dashboard interactive and effective:
-
Interactive Filters and Slicers for real-time exploration.
-
Drill-Through Functionality to deep-dive into any KPI.
-
Data Refresh Automation linked to Excel or online datasets.
-
Custom Visuals and Themes to enhance readability.
-
Export Options for PDF, PowerPoint, or Excel reporting.
-
Cloud Sharing for collaboration across teams and departments.
Conclusion
The Product Development Dashboard in Power BI transforms how organizations manage their product lifecycle. It bridges the gap between planning and execution by providing real-time, data-backed insights into performance, budget utilization, and progress.
By integrating Excel data and automating updates, this dashboard eliminates manual reporting, enhances transparency, and accelerates decision-making.
Whether you’re managing ten projects or a hundred, this dashboard empowers your organization to stay on track, control costs, and deliver successful products faster.
Frequently Asked Questions (FAQs)
1. What is the main purpose of a Product Development Dashboard in Power BI?
It helps organizations monitor and analyze every stage of product development — from concept to launch — using interactive charts and visuals that connect to Excel data.
2. Can I connect data sources other than Excel?
Yes. Power BI allows you to connect multiple data sources, including SQL Server, SharePoint, Google Sheets, and cloud databases like Azure or AWS.
3. How often should I refresh the data?
For accurate reporting, schedule automatic data refreshes daily or weekly, depending on your data update frequency.
4. Is this dashboard suitable for startups?
Absolutely! Startups can use it to track R&D performance, monitor expenses, and optimize timelines even with limited resources.
5. Can I customize the KPIs?
Yes, Power BI is fully customizable. You can modify KPIs, visuals, or even page layouts based on your organization’s goals.
6. How secure is the data in Power BI?
Power BI ensures enterprise-grade security through encryption, access control, and role-based permissions.
7. Do I need technical skills to use this dashboard?
No advanced technical skills are needed. Once set up, users can interact with visuals and explore data through simple clicks and filters.
8. What makes this dashboard better than manual reporting?
Manual reports are time-consuming and prone to errors. This Power BI dashboard automates data analysis and provides instant, accurate insights.
Visit our YouTube channel to learn step-by-step video tutorials
Click to Purchases Product Development Dashboard in Power BI