Managing product inventory effectively is one of the biggest challenges for businesses today. Stockouts lead to lost sales, while overstocking ties up working capital and increases holding costs. Organizations need real-time insights to strike the perfect balance between demand and supply. This is where a Product Inventory Dashboard in Power BI becomes a game-changing solution.
With Power BI, businesses can connect inventory data from Excel or other sources, transform it into interactive visuals, and analyze it from multiple perspectives such as category, location, vendor, and monthly trends. This not only improves decision-making but also ensures that stakeholders can monitor product performance at a glance.
In this article, we will explore everything you need to know about the Product Inventory Dashboard in Power BI, including its structure, benefits, best practices, and frequently asked questions.
Click to Purchases Product Inventory Dashboard in Power BI
What is a Product Inventory Dashboard in Power BI?
A Product Inventory Dashboard in Power BI is a pre-built business intelligence solution that allows organizations to track, monitor, and analyze their inventory performance in real time. Instead of managing data in multiple spreadsheets and relying on manual reporting, this dashboard consolidates everything into a single interactive view.
It empowers managers to:
-
Identify which products are active or inactive.
-
Analyze inventory by category, vendor, and location.
-
Track reorder percentages and stock coverage.
-
Monitor total inventory value across business units.
The best part is that the dashboard uses Excel data as input, making it easy to integrate into existing workflows without requiring advanced technical skills.
Key Features of the Product Inventory Dashboard in Power BI
The Product Inventory Dashboard in Power BI includes five key pages, each offering a unique perspective on inventory data. Let’s explore them one by one.
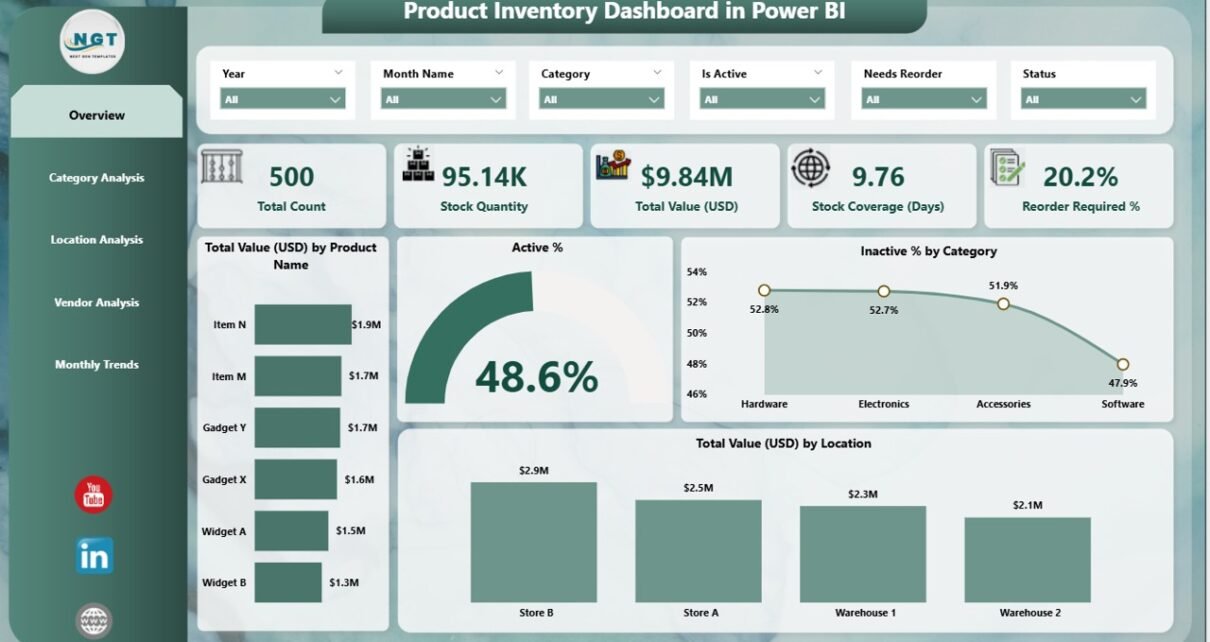
Overview Page
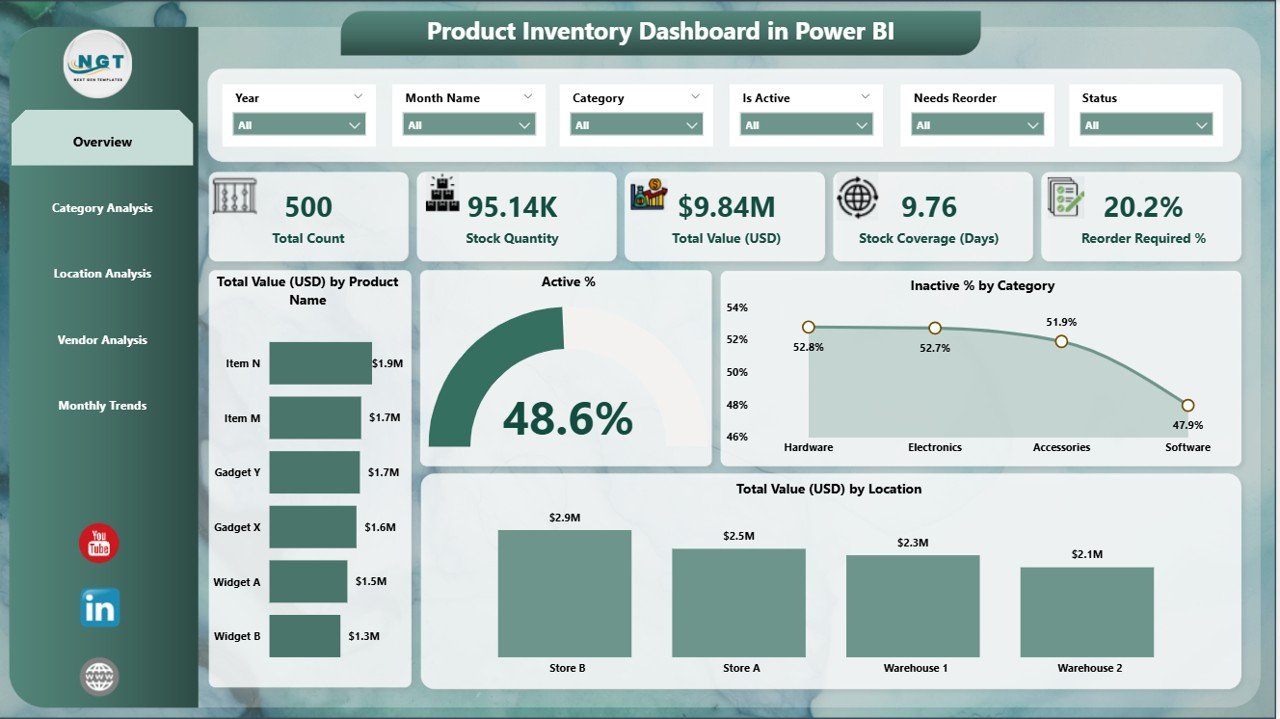
The Overview page is the central hub of the dashboard. It gives a quick snapshot of overall inventory health.
-
Cards Section: Displays total inventory value (USD), active percentage, inactive percentage, and other KPIs.
-
Charts: Show total value by product name, active % vs inactive %, and total value by location.
-
Purpose: Provides a high-level summary for executives who want to see the “big picture” without diving into granular details.
Category Analysis Page
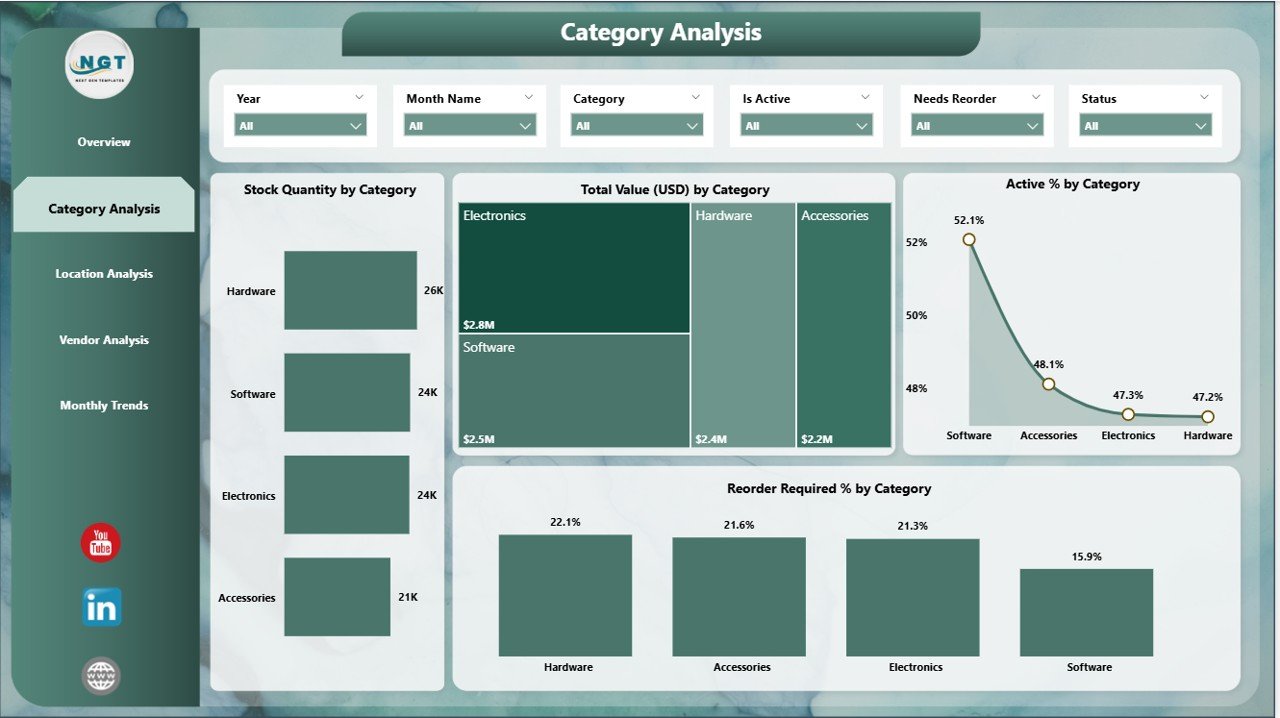
The Category Analysis page allows businesses to drill down into inventory performance by product categories.
Charts Included:
- Stock quantity by category
- Total value (USD) by category
- Active % by category
- Reorder % by category
-
Purpose: Helps managers identify which categories drive the highest stock levels and which ones may require reordering or discontinuation.
Location Analysis Page
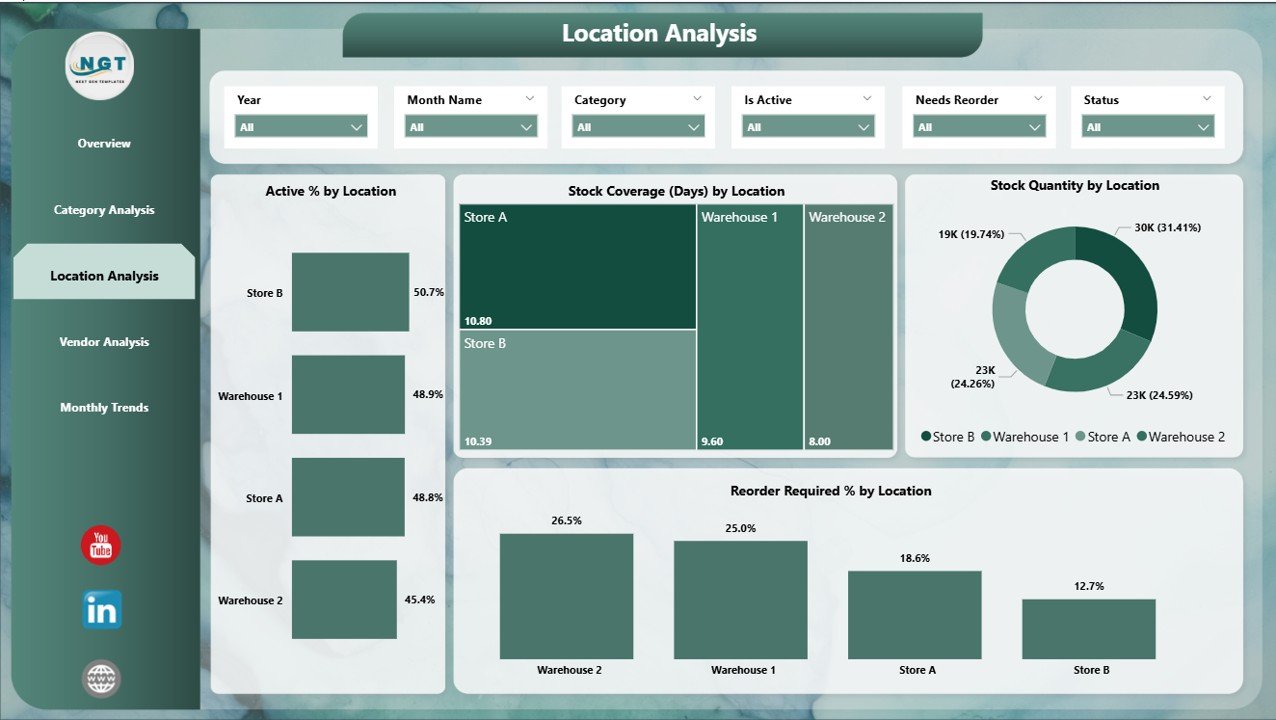
The Location Analysis page provides insights into inventory distribution across business locations.
Charts Included:
- Active % by location
- Stock coverage (days) by location
- Stock quantity by location
- Reorder % by location
-
Purpose: Helps businesses optimize logistics, track warehouse efficiency, and ensure inventory is positioned where demand is highest.
Vendor Analysis Page
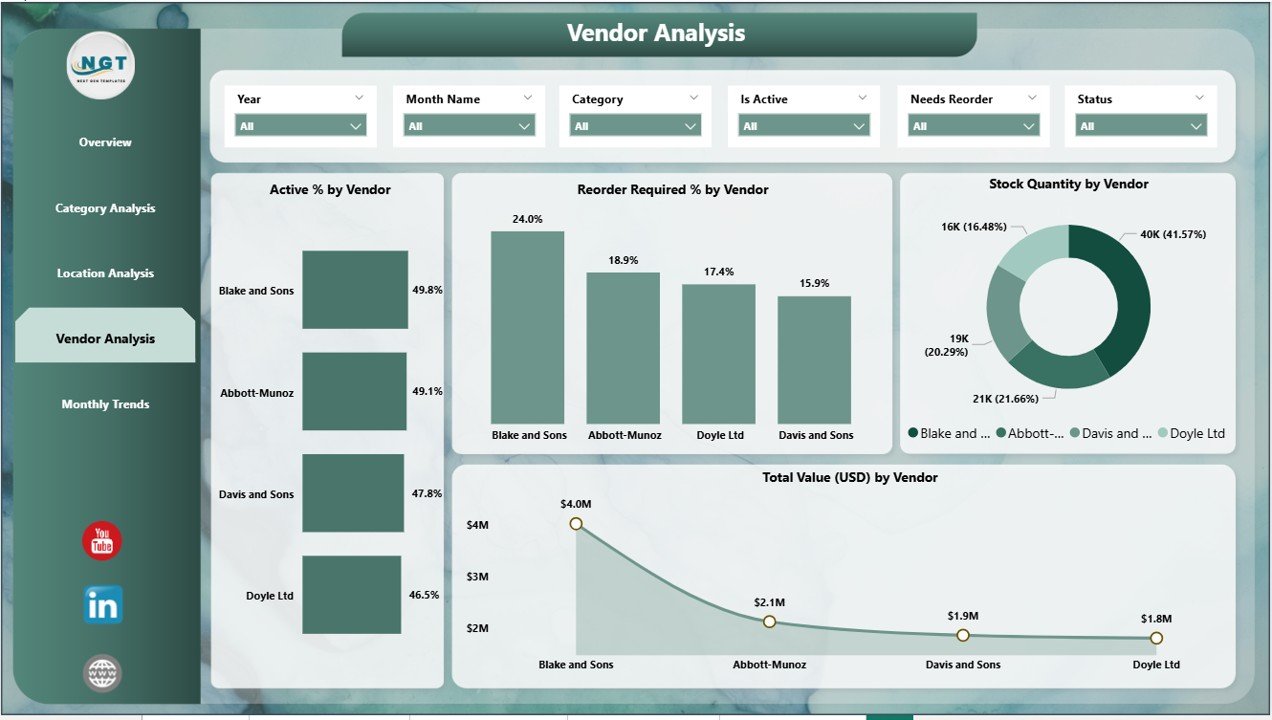
The Vendor Analysis page evaluates supplier performance and stock allocation by vendor.
Charts Included:
- Active % by vendor
- Stock quantity by vendor
- Reorder required % by vendor
- Total value (USD) by vendor
-
Purpose: Helps procurement teams evaluate vendor reliability, identify dependency risks, and negotiate better terms based on stock performance.
Monthly Trends Page
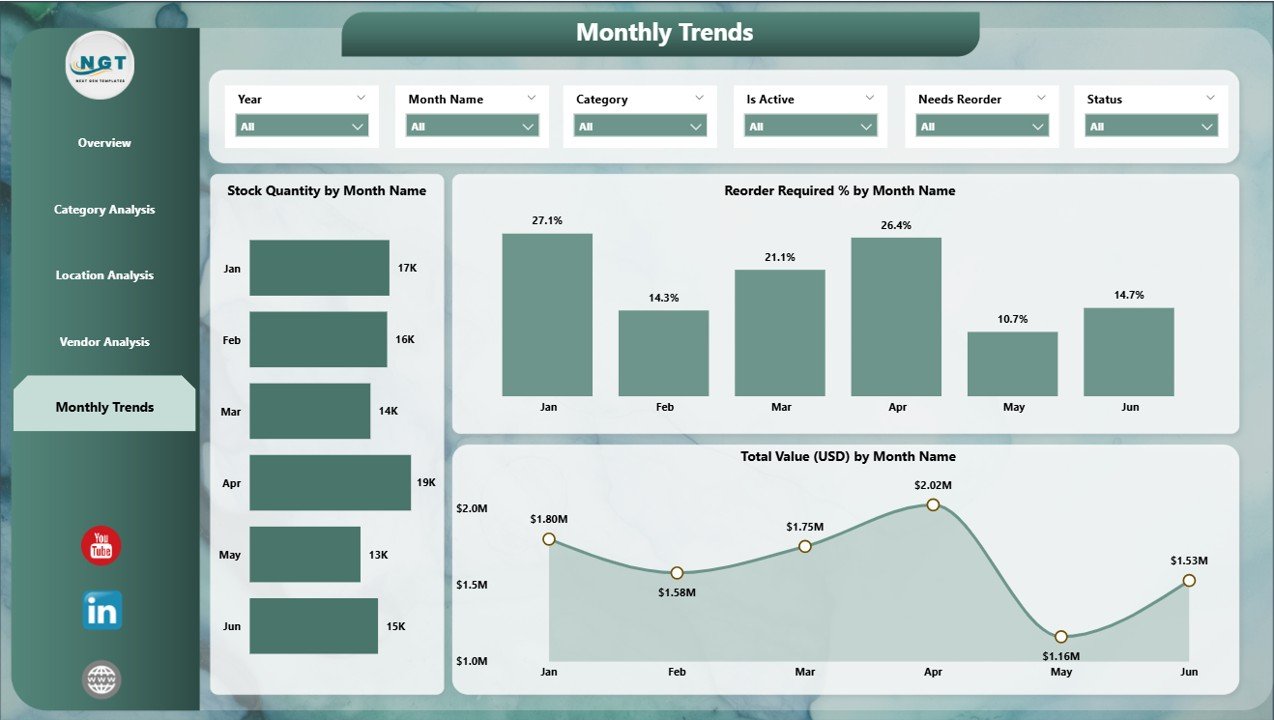
The Monthly Trends page focuses on time-based inventory analysis.
Charts Included:
- Stock quantity by month
- Reorder required % by month
- Stock quantity by vendor over time
- Total value (USD) by month
-
Purpose: Enables organizations to monitor seasonal trends, forecast demand, and plan purchasing schedules.
Why Use a Product Inventory Dashboard in Power BI?
Businesses benefit from an inventory dashboard because it converts raw data into actionable insights. Instead of reacting to stock issues after they occur, companies can proactively manage their supply chain.
Some reasons to use this dashboard include:
-
Real-time visibility of stock levels and product performance.
-
Faster decision-making through interactive visuals.
-
Improved forecasting with monthly trend analysis.
-
Better vendor management through supplier performance metrics.
-
Optimized warehouse utilization by analyzing stock at each location.
Click to Purchases Product Inventory Dashboard in Power BI
Advantages of Product Inventory Dashboard in Power BI
Here are some major benefits of using a product inventory dashboard:
✅ Centralized Data View – All inventory data is consolidated in one place.
✅ Improved Efficiency – Reduces time spent on manual reporting and reconciliation.
✅ Interactive Analysis – Users can filter, drill down, and customize views.
✅ Cost Control – Identifies overstocking and understocking issues quickly.
✅ Vendor Insights – Helps in evaluating vendor performance and managing procurement risks.
✅ Location Optimization – Provides clarity on stock distribution across warehouses.
✅ Trend Forecasting – Supports demand planning with month-wise stock tracking.
Opportunities for Improvement
Even though the dashboard is powerful, there are always areas to enhance.
🔹 Integrate with ERP systems to automate real-time data refresh.
🔹 Add predictive analytics using AI models for demand forecasting.
🔹 Expand KPIs to include carrying cost, lead time, and order fulfillment rate.
🔹 Enhance visuals with heat maps or drillthrough pages for advanced analysis.
🔹 Mobile Optimization so managers can track inventory on the go.
Best Practices for the Product Inventory Dashboard in Power BI
To maximize the value of your dashboard, follow these best practices:
📊 Define Clear KPIs – Focus on the most relevant metrics like stock coverage days, reorder %, and total value.
🔄 Automate Data Refresh – Connect to live data sources for up-to-date analysis.
🎯 Use Slicers Effectively – Provide filters for category, location, vendor, and time to allow users flexible analysis.
🧩 Maintain Data Quality – Ensure the Excel source file has clean, accurate, and consistent data.
📱 Enable Mobile View – Configure a mobile layout for better usability across devices.
📈 Combine with Other Dashboards – Link this dashboard with sales, procurement, or financial dashboards for holistic decision-making.
How to Build a Product Inventory Dashboard in Power BI?
Here’s a step-by-step guide to building your own version:
Prepare Data
- Collect product inventory data in Excel.
- Include fields such as Product Name, Category, Location, Vendor, Stock Quantity, Active Status, and Total Value.
Load Data into Power BI
- Import the Excel file into Power BI Desktop.
- Clean and transform data using Power Query.
Create Relationships
- Define relationships between different tables like Product, Vendor, and Location.
Design Pages
- Add KPIs and visuals as described in the five-page structure.
Apply Slicers
- Insert slicers for category, vendor, location, and time for interactive filtering.
Format Dashboard
- Use consistent color themes, labels, and tooltips.
Publish and Share
- Publish to Power BI Service for team-wide collaboration.
Conclusion
A Product Inventory Dashboard in Power BI helps businesses monitor inventory health, optimize supply chains, and make informed decisions with ease. By providing insights into categories, locations, vendors, and monthly trends, this dashboard becomes a vital tool for managers across industries.
With proper implementation and adherence to best practices, companies can not only avoid inventory bottlenecks but also improve customer satisfaction, reduce costs, and stay competitive in today’s fast-paced markets.
Frequently Asked Questions (FAQs)
1. What data sources can I use with the Product Inventory Dashboard in Power BI?
You can use Excel, CSV, SQL databases, ERP systems, and cloud-based platforms like Azure or Google Sheets.
2. Can this dashboard track inventory in real-time?
Yes. By connecting Power BI to live data sources or APIs, you can enable automatic refresh for real-time updates.
3. Is this dashboard suitable for small businesses?
Absolutely. Small businesses can start with Excel-based data and scale up as their operations grow.
4. How can this dashboard help in cost reduction?
It highlights stock imbalances, identifies inactive products, and provides vendor performance metrics, helping businesses cut unnecessary costs.
5. Can I customize the dashboard for my business needs?
Yes, Power BI dashboards are fully customizable. You can add or remove KPIs, change visuals, and even integrate with other dashboards.
6. Does this dashboard support mobile devices?
Yes. With Power BI mobile app, you can access and interact with the dashboard from smartphones and tablets.
7. How often should I update the inventory data?
It depends on your business needs. For fast-moving products, daily or real-time updates are ideal, while for slower categories, weekly updates may be sufficient.
Visit our YouTube channel to learn step-by-step video tutorials