Effective customer engagement is essential for the success of any project. Tracking and analyzing key performance indicators (KPIs) related to customer interaction ensures you deliver value and satisfaction consistently. In this article, you’ll discover how a Project Management Customer Engagement KPI Dashboard in Excel helps you manage these metrics efficiently.
What is a Project Management Customer Engagement KPI Dashboard?
A Project Management Customer Engagement KPI Dashboard is an Excel-based tool designed specifically to track and analyze customer engagement metrics. It simplifies monitoring and visualizing important KPIs, allowing project managers to quickly assess performance and make informed decisions.
Click to Purchases Project Management Customer Engagement KPI Dashboard in Excel
Why Use Excel for a KPI Dashboard?
Excel is widely used because it is:
- Easy to customize.
- User-friendly and familiar.
- Capable of managing complex calculations.
- Accessible and cost-effective.
Key Features of the Project Management Customer Engagement KPI Dashboard
This Excel dashboard template includes seven critical worksheets to organize and visualize your customer engagement KPIs clearly.
Home Sheet (Index Sheet)
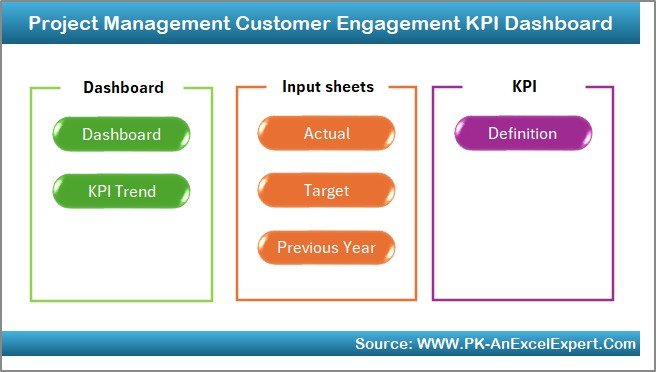
The Home Sheet serves as your navigation hub. It contains buttons linking directly to each worksheet, making it effortless to jump between sections of your dashboard.
Dashboard Sheet Tab
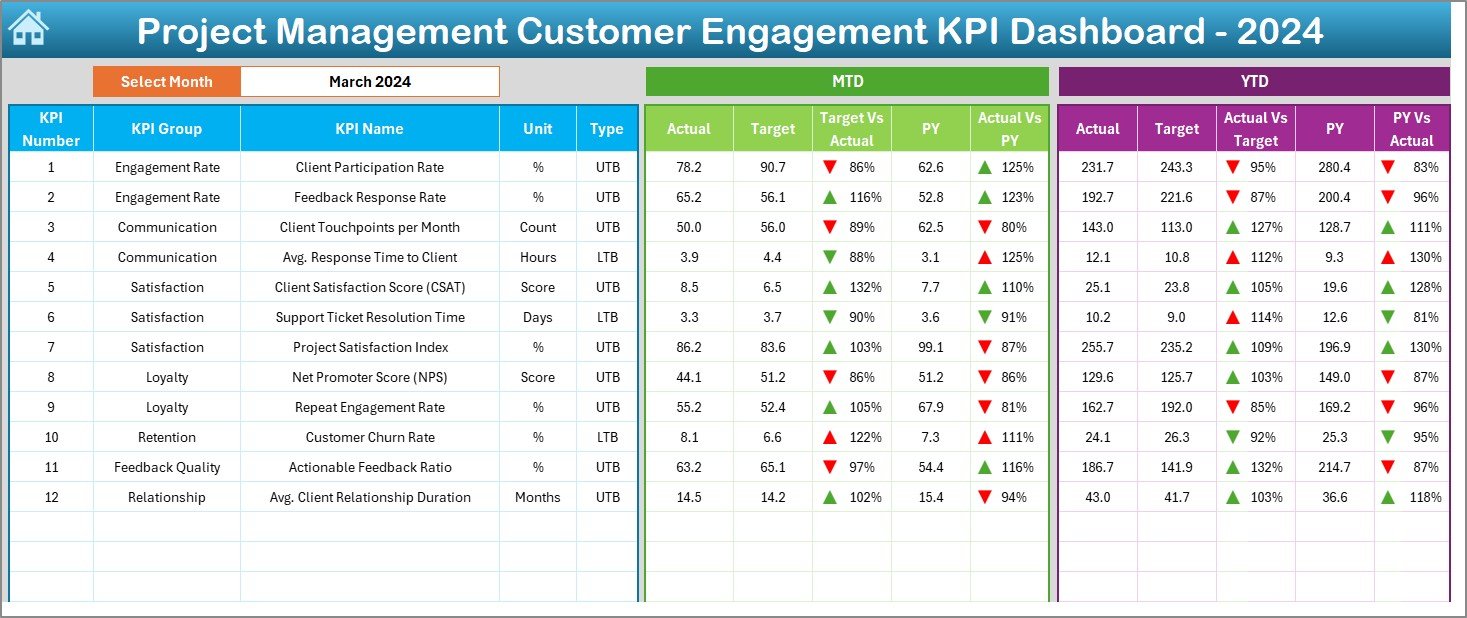
The Dashboard Sheet is the heart of your KPI management. Here, you can:
- Select the reporting month from a simple dropdown (located at cell D3).
- View Month-to-Date (MTD) and Year-to-Date (YTD) figures for Actual, Target, and Previous Year data.
- Quickly see comparisons such as Target vs. Actual and Previous Year vs. Actual.
- Benefit from intuitive conditional formatting with clear visual indicators (up/down arrows).
KPI Trend Sheet Tab
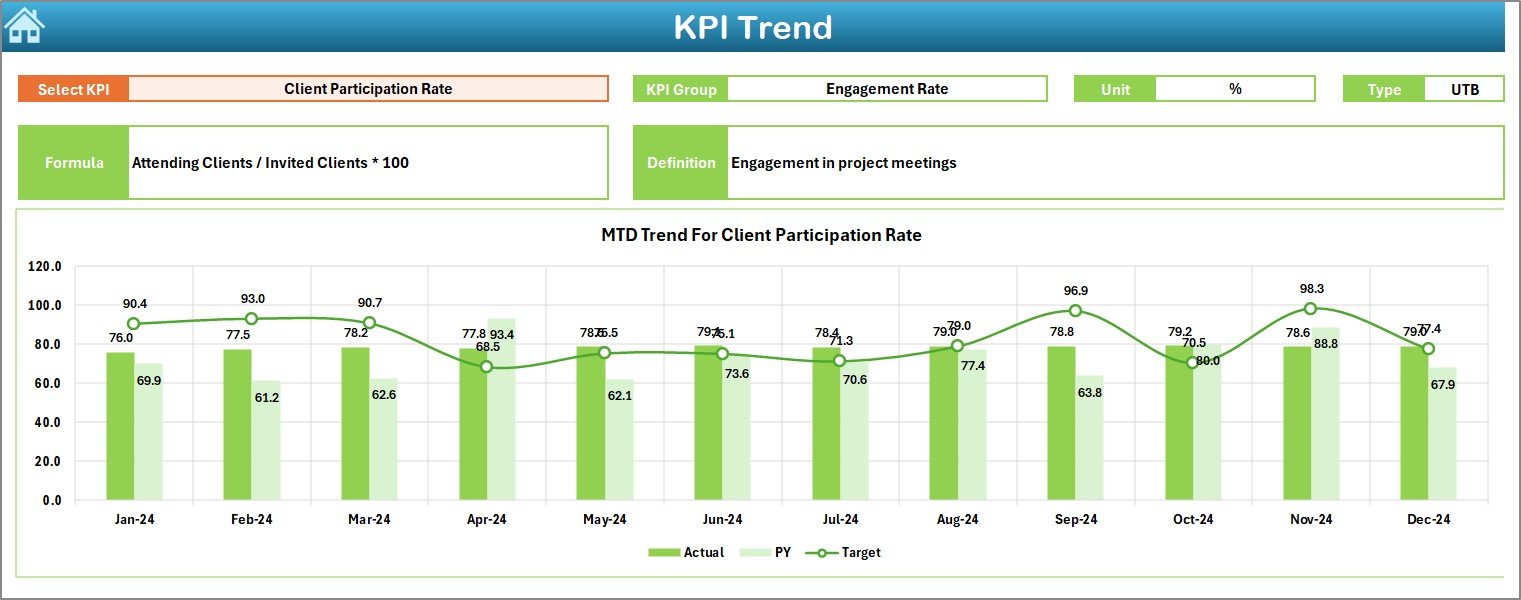
This worksheet offers detailed trend analyses:
- Select KPIs from a dropdown menu at cell C3.
- View KPI Group, Unit, Type (Lower the Better or Upper the Better), Formula, and Definition.
- Visualize MTD and YTD performance trends through easy-to-understand charts.
Actual Numbers Input Sheet
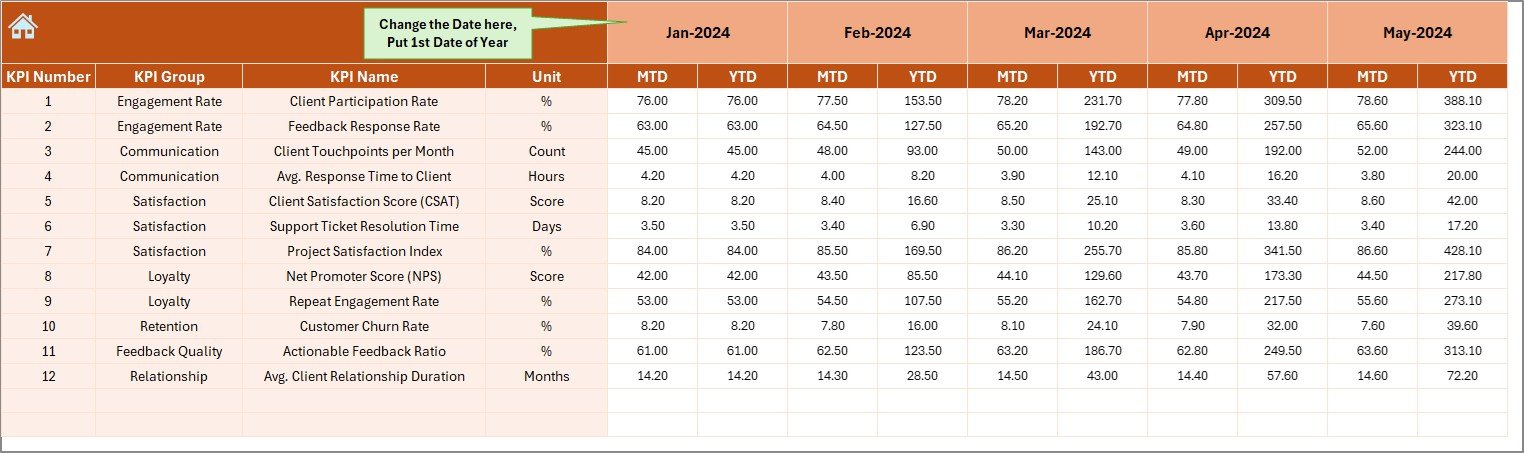
The Actual Numbers Input Sheet is your data entry workspace:
Click to Purchases Project Management Customer Engagement KPI Dashboard in Excel
- Enter MTD and YTD actual figures.
- Easily change months from cell E1 by entering the first month of the year.
Target Sheet Tab
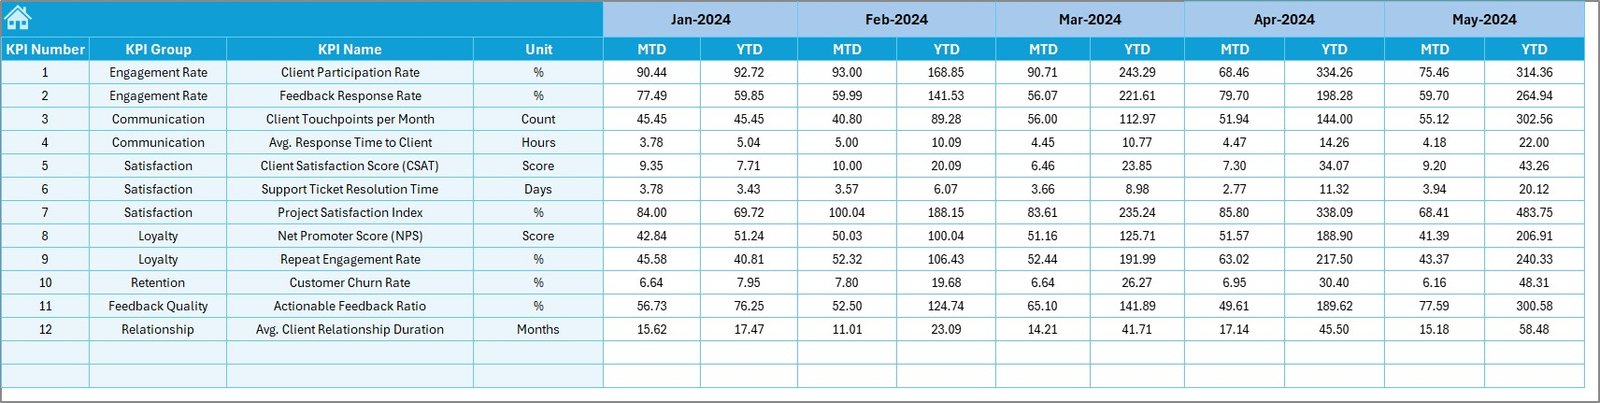
In the Target Sheet:
- Input monthly and yearly target values for each KPI.
- Stay organized and ensure accurate comparisons and performance tracking.
Previous Year Number Sheet Tab
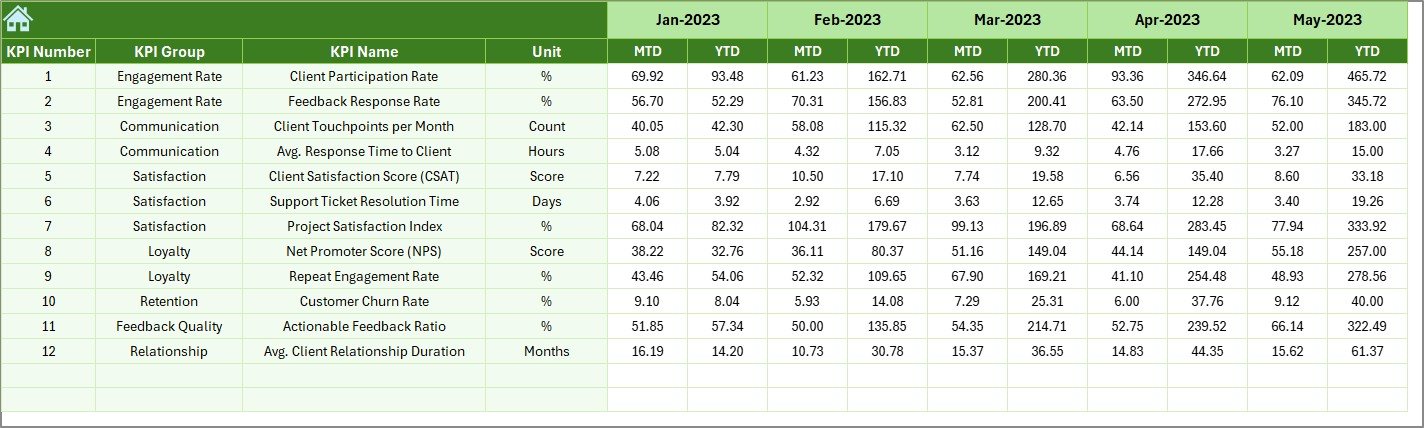
- Enter corresponding figures from the previous year.
- Enables precise year-over-year (YoY) comparisons.
KPI Definition Sheet Tab
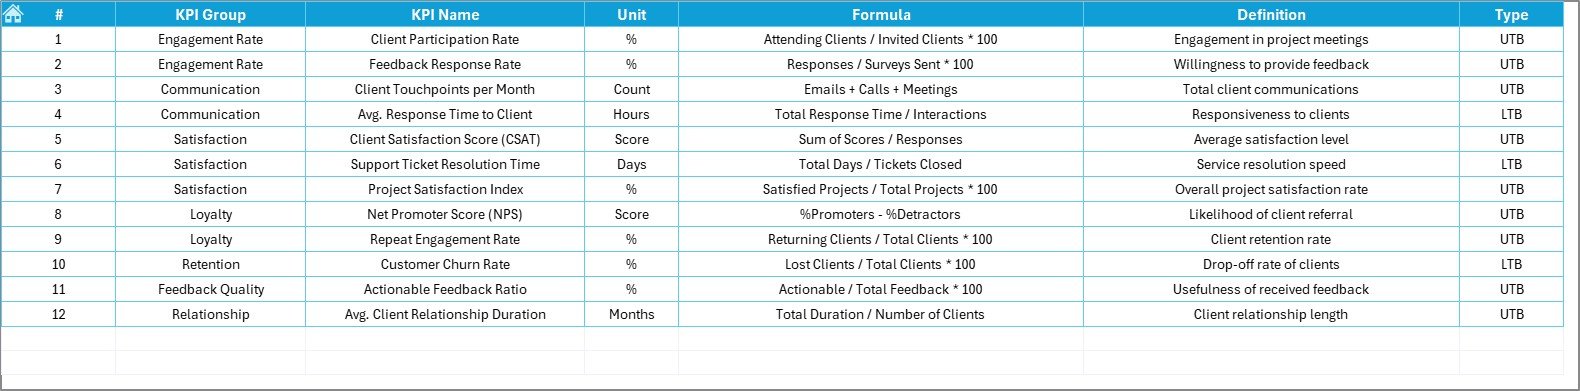
This worksheet allows you to:
- Clearly define each KPI (Name, Group, Unit, Formula, and Description).
- Ensure clarity and consistency across your reporting.
Advantages of Project Management Customer Engagement KPI Dashboard
A well-structured KPI dashboard delivers significant advantages:
- Enhanced Visibility: Clearly see customer engagement metrics at a glance.
- Improved Decision Making: Data-driven insights help in making informed decisions.
- Better Performance Tracking: Easily monitor progress toward customer engagement goals.
- Increased Efficiency: Saves time spent compiling and analyzing data manually.
- Improved Customer Satisfaction: Directly enhance customer experience through targeted improvements.
Best Practices for Using Project Management Customer Engagement KPI Dashboard
To maximize the effectiveness of your KPI Dashboard:
- Regular Updates: Frequently update data to ensure accuracy.
- Clear Definitions: Keep KPI definitions concise and straightforward.
- Consistent Reviews: Regularly analyze data and discuss trends during team meetings.
- Actionable Insights: Use insights from the dashboard to take proactive measures.
- Customization: Tailor the dashboard to suit your project’s unique needs and goals.
Common Customer Engagement KPIs to Track
Here are key customer engagement KPIs worth tracking:
- Customer Satisfaction Score (CSAT)
- Net Promoter Score (NPS)
- Customer Retention Rate
- Customer Churn Rate
- Response Time
- Resolution Time
Tips to Boost Customer Engagement
Improving KPIs starts with practical customer engagement strategies:
- Personalized Communication: Tailor interactions to customer preferences.
- Timely Response: Quickly address customer queries and concerns.
- Continuous Feedback: Regularly seek and act on customer feedback.
- Proactive Support: Anticipate customer needs and proactively offer solutions.
Conclusion
Implementing a Project Management Customer Engagement KPI Dashboard in Excel significantly enhances your ability to monitor and improve customer interactions. It’s a powerful tool that transforms raw data into clear, actionable insights, enabling you to boost project success and customer satisfaction efficiently.
Frequently Asked Questions with Answers
Q1: Can I customize the Excel KPI Dashboard to suit my business needs?
Yes, Excel dashboards are highly customizable. You can adjust KPIs, layouts, and metrics according to your project’s specific requirements.
Q2: How frequently should I update the KPI Dashboard?
Update the dashboard regularly—ideally weekly or monthly—to ensure accurate, timely insights.
Q3: What KPIs should I prioritize for better customer engagement?
Prioritize KPIs such as Customer Satisfaction Score, Net Promoter Score, Response Time, and Retention Rate.
Q4: Is Excel the best tool for managing KPI Dashboards?
Excel is an excellent and affordable tool for small to medium-sized projects. For larger-scale or enterprise-level projects, more specialized software may be appropriate.
Q5: How does tracking customer engagement KPIs improve my projects?
Tracking these KPIs provides valuable insights into customer satisfaction and loyalty, helping you make targeted improvements that drive overall project success and customer retention.
Click to Purchases Project Management Customer Engagement KPI Dashboard in Excel
Visit our YouTube channel to learn step-by-step video tutorials