In today’s competitive property market, data-driven decision-making decides success. Real estate businesses generate large volumes of data every day. However, raw data alone never creates value. Instead, you must convert that data into clear, visual, and actionable insights.
That is exactly where a Real Estate Dashboard in Power BI becomes essential.
In this detailed and practical guide, you will learn what a Real Estate Dashboard in Power BI is, why it matters, how it works, its page-wise structure, advantages, best practices, and frequently asked questions. Moreover, this article uses simple language, active voice, and real-world logic so you can apply everything immediately.
What Is a Real Estate Dashboard in Power BI?
Click to Purchases Real Estate Dashboard in Power BI
A Real Estate Dashboard in Power BI is an interactive reporting and analytics solution that helps real estate companies track, analyze, and monitor property performance in one centralized place.
Instead of managing scattered Excel files, CRMs, and reports, this dashboard consolidates all critical metrics into dynamic charts, KPI cards, slicers, and trend analysis views.
As a result, real estate developers, brokers, investors, and managers gain instant visibility into:
-
Property performance
-
Pricing efficiency
-
Customer satisfaction
-
Regional trends
-
Client behavior
-
Monthly movement patterns
Because Power BI updates visuals dynamically, users can filter data by region, property type, client type, time period, and funding source within seconds.
Why Do Real Estate Businesses Need a Dashboard in Power BI?
Real estate decisions involve high-value investments. Therefore, guesswork creates risk. A dashboard removes uncertainty and adds clarity.
Key Challenges Without a Dashboard
-
Data scattered across multiple systems
-
Manual reporting that consumes time
-
Delayed insights and slow decisions
-
Inconsistent metrics across teams
-
Limited visibility into trends and performance
How Power BI Solves These Problems
-
Centralizes all real estate data
-
Automates reporting and updates
-
Visualizes complex data clearly
-
Improves forecasting and planning
-
Enables faster and confident decisions
Because of these benefits, a Real Estate Dashboard in Power BI becomes a strategic tool rather than just a reporting file.
Who Can Benefit from a Real Estate Dashboard in Power BI?
A well-designed real estate dashboard serves multiple stakeholders.
-
🏢 Real Estate Developers – Track cost, area utilization, and demand
-
🏠 Brokers & Agents – Analyze property performance and client preferences
-
💼 Investors – Monitor ROI drivers and regional trends
-
📊 Sales Managers – Evaluate leads, ratings, and property status
-
🧑💻 Executives – Get high-level insights through KPIs
Because Power BI dashboards are interactive, every role can view the same data from different angles.
Page-Wise Structure of the Real Estate Dashboard in Power BI
This Real Estate Dashboard in Power BI consists of 5 well-structured pages, each designed to answer specific business questions.
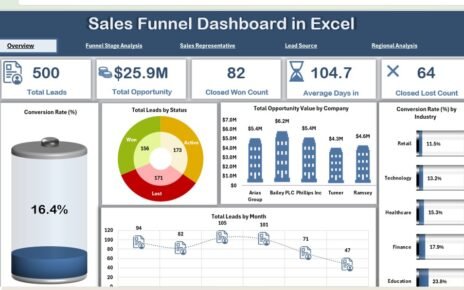
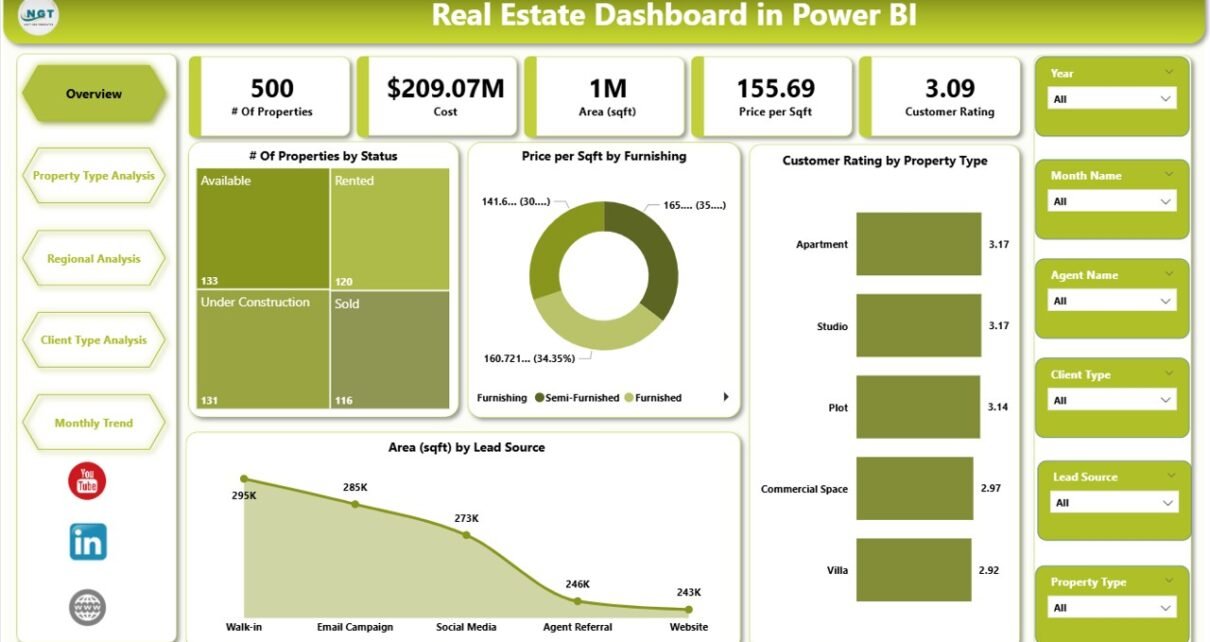
1. Overview Page – What Is the Overall Real Estate Performance?
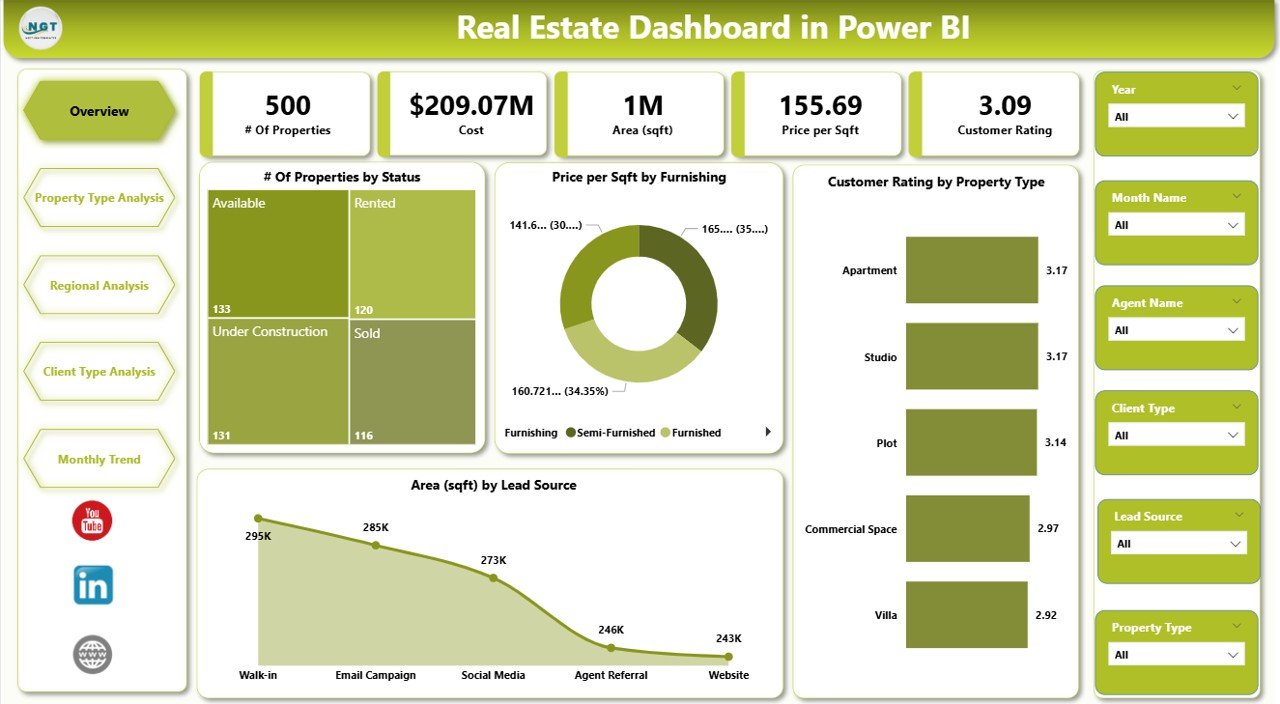
The Overview Page serves as the entry point of the dashboard. Therefore, it focuses on high-level KPIs and summary insights.
Key Features of the Overview Page
-
Interactive slicers for quick filtering
-
4 KPI cards for instant performance tracking
-
Visual charts for performance comparison
KPI Cards on the Overview Page
-
# of Properties by Status
-
Shows properties as Available, Sold, Under Construction, or Booked
-
-
Price per Sqft by Funding
-
Compares pricing efficiency across funding types
-
-
Customer Rating by Property Type
-
Measures buyer satisfaction across property categories
-
-
Area by Lead Source
-
Identifies which lead sources drive higher property area demand
-
Why the Overview Page Matters
-
Provides a quick business snapshot
-
Helps executives identify red flags instantly
-
Supports faster strategic decisions
Because everything appears in one view, users can understand performance within seconds.
2. Property Type Analysis – Which Property Types Perform Best?
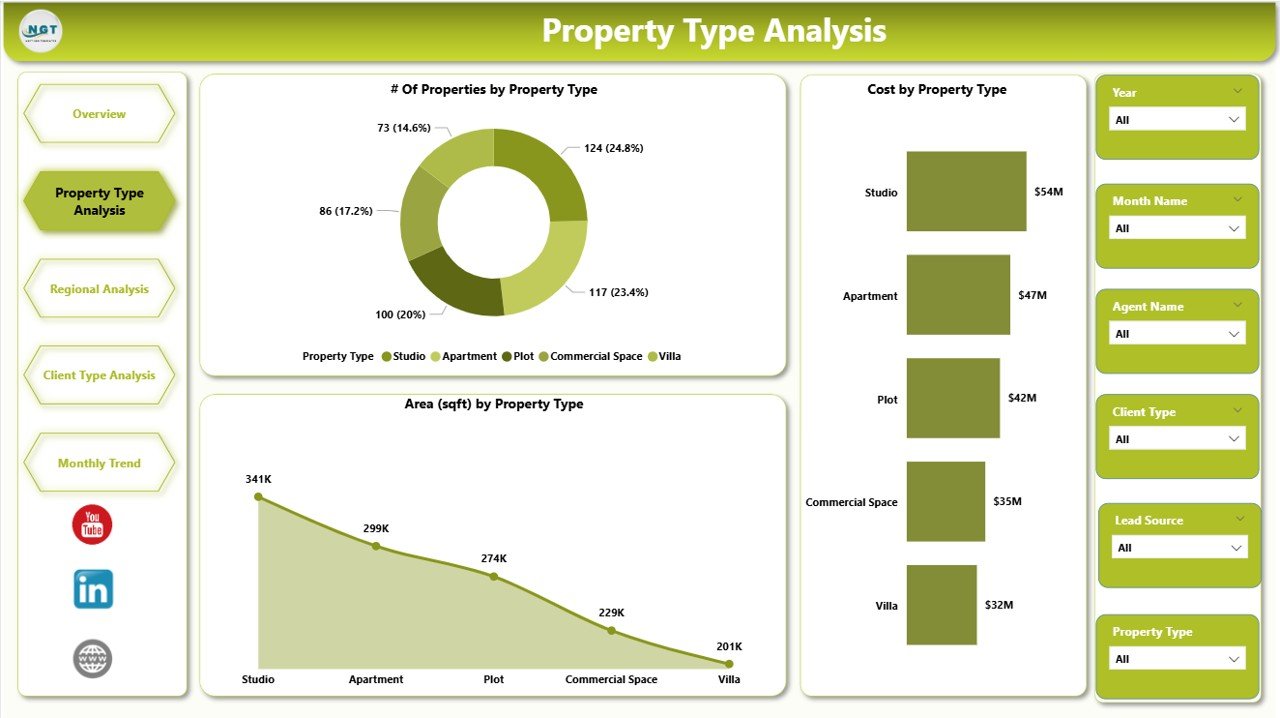
The Property Type Analysis Page dives deeper into performance based on property categories.
Charts on the Property Type Analysis Page
-
# of Properties by Property Type
-
Customer Rating by Property Type
-
Area by Property Type
Key Insights You Can Derive
-
Identify high-demand property types
-
Understand customer preferences clearly
-
Compare space utilization across property categories
For example, you can instantly see whether Apartments, Villas, Commercial Units, or Plots attract better ratings and demand.
3. Regional Analysis – Which Regions Drive Maximum Value?
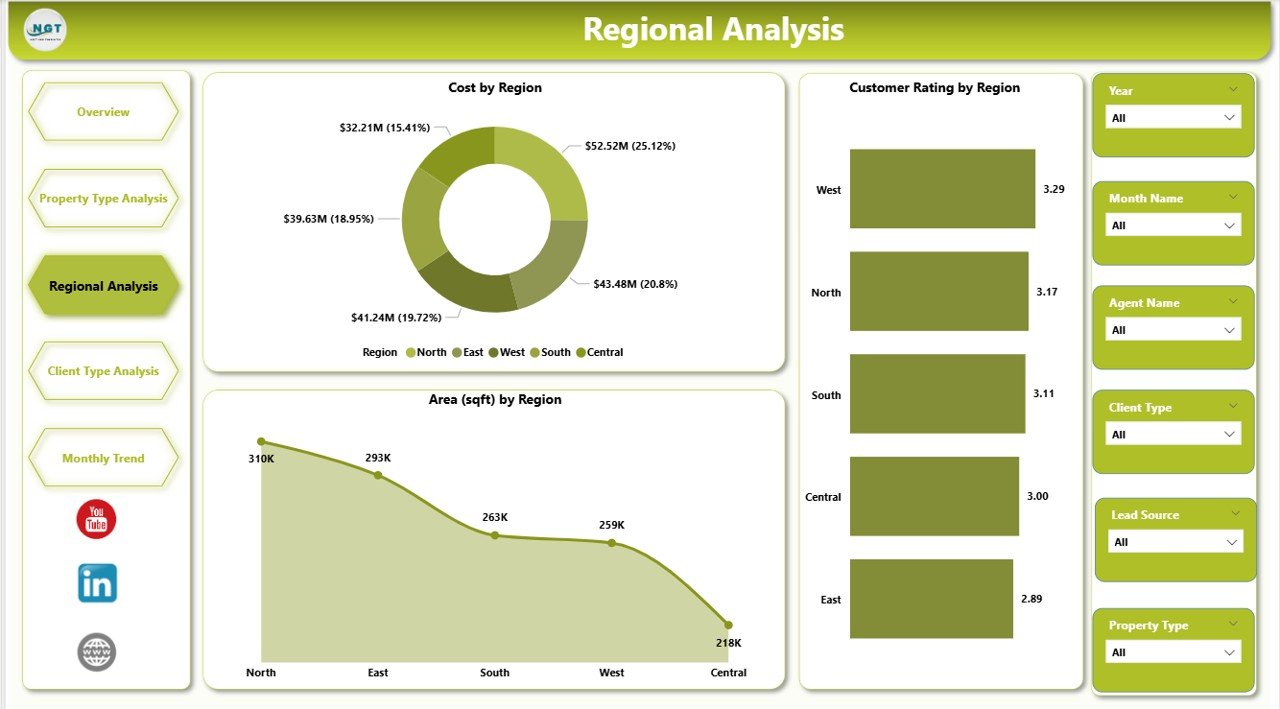
The Regional Analysis Page highlights geographic performance.
Charts on the Regional Analysis Page
-
Net Cost by Region
-
Customer Rating by Region
-
Area by Region
Why Regional Analysis Is Important
-
Helps identify high-performing locations
-
Supports expansion and investment planning
-
Improves regional pricing strategies
Because location plays a crucial role in real estate, this page becomes vital for long-term growth planning.
Click to Purchases Real Estate Dashboard in Power BI
4. Client Type Analysis – Which Client Segments Matter Most?
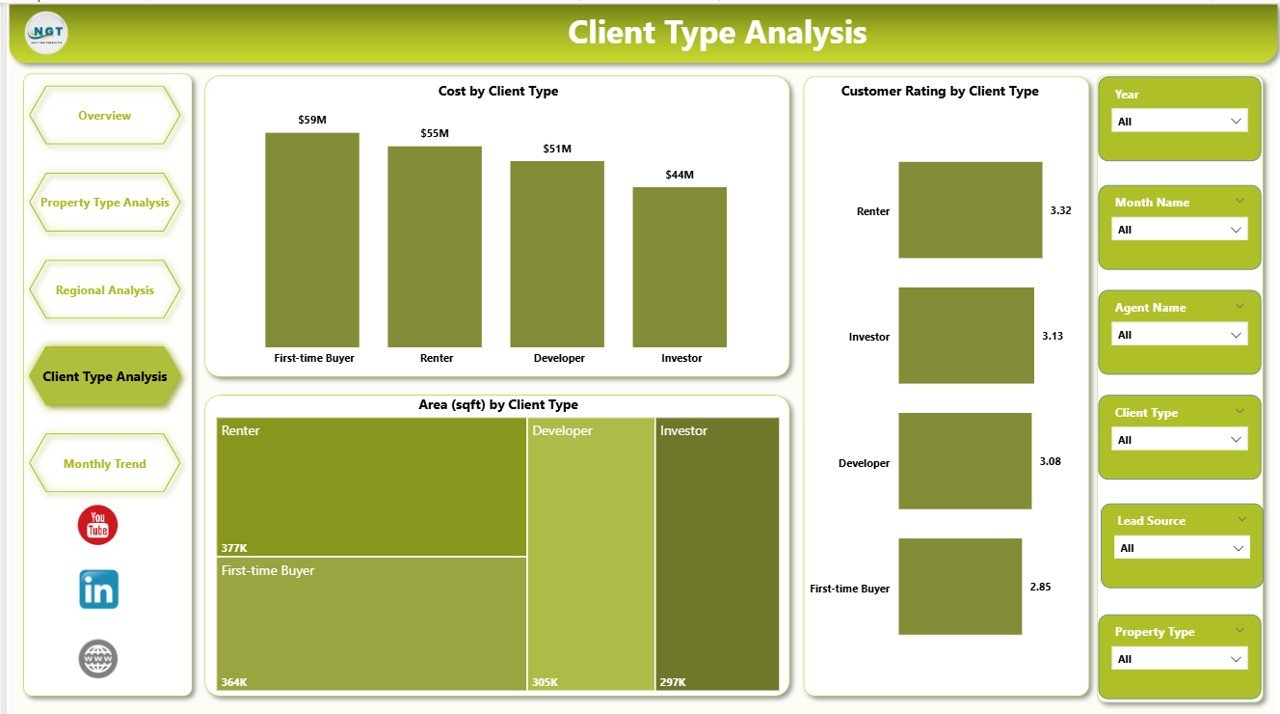
The Client Type Analysis Page focuses on customer segmentation.
Charts on the Client Type Analysis Page
-
Cost by Client Type
-
Customer Rating by Client Type
-
Area by Client Type
Key Business Questions This Page Answers
-
Which client types spend more?
-
Which segment gives better ratings?
-
Which client group demands larger areas?
As a result, sales and marketing teams can create targeted campaigns for each client segment.
5. Monthly Trends – How Is the Business Changing Over Time?
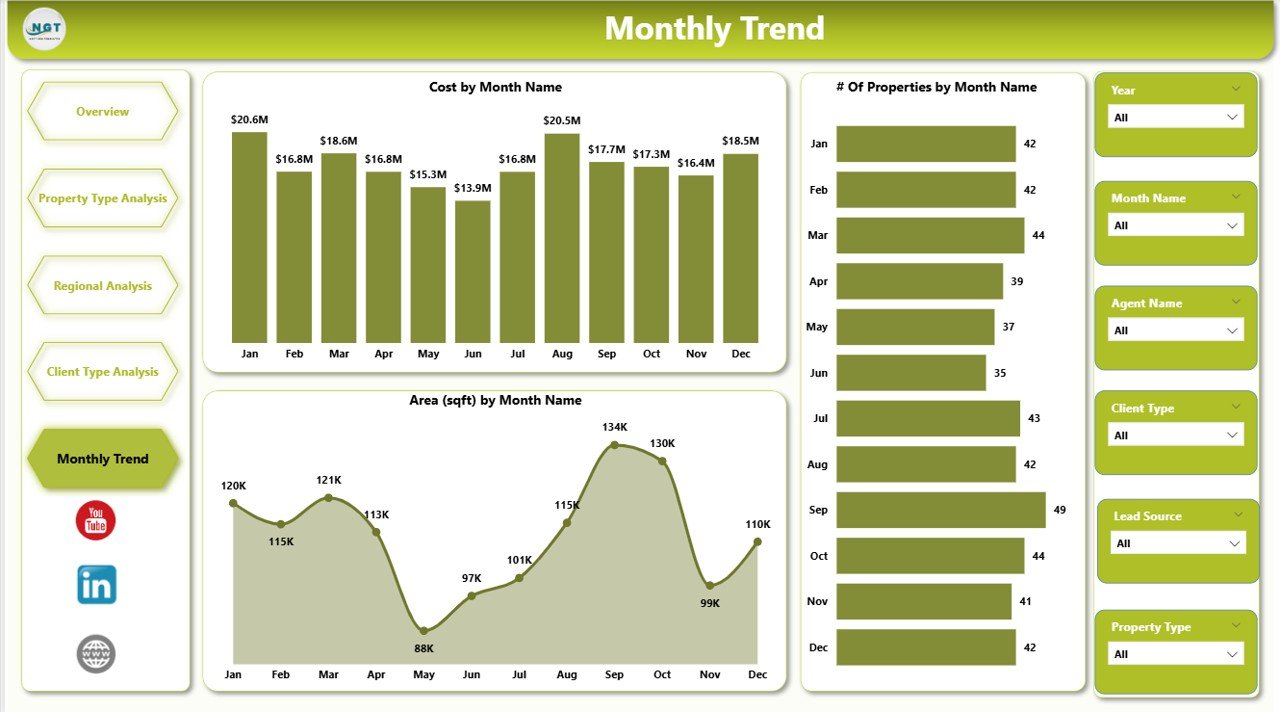
The Monthly Trends Page tracks time-based performance.
Charts on the Monthly Trends Page
-
Cost by Month
-
Customer # of Properties by Month
-
Area by Month
Why Monthly Trends Matter
-
Identify seasonal demand patterns
-
Track growth or decline early
-
Support accurate forecasting
Because trends reveal future direction, this page supports proactive decision-making.
Advantages of a Real Estate Dashboard in Power BI
A Real Estate Dashboard in Power BI offers multiple advantages.
🔹 Centralized Data Management
-
Combines multiple data sources
-
Eliminates scattered reporting
-
Improves data consistency
🔹 Faster Decision-Making
-
Real-time visual updates
-
Instant filtering with slicers
-
Reduced dependency on manual reports
🔹 Improved Transparency
-
Clear KPIs for all stakeholders
-
Standardized metrics across teams
-
Better accountability
🔹 Enhanced Customer Insights
-
Understand buyer preferences
-
Track ratings and feedback
-
Improve customer satisfaction
🔹 Scalable and Flexible
-
Easy to add new metrics
-
Supports future business growth
-
Works for small and large portfolios
-
Click to Purchases Real Estate Dashboard in Power BI
Best Practices for the Real Estate Dashboard in Power BI
To get maximum value, you must follow proven best practices.
1. Define Clear Business Goals
Always decide what questions the dashboard should answer before building visuals.
2. Use Simple and Consistent KPIs
Avoid clutter. Instead, focus on metrics that truly matter.
3. Design Clean and Readable Visuals
-
Use consistent colors
-
Avoid overcrowded charts
-
Maintain visual balance
4. Optimize Data Model
-
Use proper relationships
-
Clean data before loading
-
Avoid unnecessary columns
5. Leverage Interactive Slicers
Slicers improve usability and allow deeper exploration without confusion.
6. Review Performance Regularly
Continuously refine visuals based on user feedback and business changes.
How Does a Real Estate Dashboard in Power BI Improve ROI?
A dashboard improves ROI by:
-
Reducing manual reporting effort
-
Improving pricing decisions
-
Identifying high-value regions
-
Enhancing customer satisfaction
-
Supporting data-backed investments
As a result, businesses save time, reduce risk, and increase profitability.
Common Mistakes to Avoid While Building a Real Estate Dashboard
-
Using too many KPIs
-
Ignoring user requirements
-
Overloading visuals
-
Not validating data accuracy
-
Skipping performance optimization
Avoiding these mistakes ensures long-term dashboard success.
Conclusion: Why a Real Estate Dashboard in Power BI Is a Smart Investment
A Real Estate Dashboard in Power BI transforms raw property data into meaningful insights. It enables real estate professionals to track performance, understand customers, analyze regions, and monitor trends with ease.
Because the dashboard offers clarity, speed, and accuracy, it becomes an essential tool for modern real estate businesses. Moreover, its interactive nature ensures every stakeholder makes confident, data-driven decisions.
If you want to stay competitive in today’s property market, investing in a Real Estate Dashboard in Power BI is no longer optional—it is essential.
Frequently Asked Questions About Real Estate Dashboard in Power BI
1. What data is required for a Real Estate Dashboard in Power BI?
You need property details, cost data, area information, customer ratings, client types, regions, and date fields for trends.
2. Can small real estate firms use Power BI dashboards?
Yes. Power BI scales easily and works for both small firms and large enterprises.
3. How often does the dashboard update?
The dashboard updates based on data refresh settings, which can be scheduled or manual.
4. Can I customize the dashboard for my business needs?
Absolutely. You can add new KPIs, filters, and pages based on your requirements.
5. Does a Power BI real estate dashboard replace Excel?
No. Instead, it complements Excel by offering advanced visualization and interactivity.
6. Is Power BI suitable for real-time real estate reporting?
Yes. Power BI supports near real-time reporting with proper data connections.
Visit our YouTube channel to learn step-by-step video tutorials