Recruitment agencies run in a fast-moving environment where client expectations, candidate pipelines, and hiring timelines change every day. Because of this dynamic nature, recruitment teams need clear visibility into performance, cost, profitability, and candidate quality. A Recruitment Agencies Dashboard in Power BI gives them exactly that. It brings all hiring KPIs into one place so that teams track performance and make informed decisions quickly.
This article explains everything you need to know about this dashboard. You will understand how the dashboard works, what each page shows, how agencies can use it, the advantages, best practices, and answers to common questions.
Let’s explore the complete guide.
Click to Purchases Recruitment Agencies Dashboard in Power BI
What Is a Recruitment Agencies Dashboard in Power BI?
A Recruitment Agencies Dashboard in Power BI is a visual decision-making tool that converts raw recruitment data into meaningful insights. It helps hiring teams, recruiters, managers, and business leaders track the overall performance of the agency.
The dashboard shows key metrics like:
-
Client satisfaction
-
Interviewing percentage
-
Recruitment cost and revenue
-
Profit by industry, region, and client type
-
Monthly trend insights
-
Candidate source performance
It becomes a single snapshot of agency performance and helps stakeholders understand what works, what needs improvement, and where they should focus next.
Why Recruitment Agencies Need a Power BI Dashboard
Recruitment agencies collect a huge amount of data every day. Without a dashboard, these numbers stay scattered in Excel sheets, emails, or applicant tracking systems. A Power BI dashboard organizes this data and improves decision-making.
Recruitment agencies need this dashboard because:
-
Hiring patterns change across months.
-
Profitability varies across industries and locations.
-
Candidate sources perform differently.
-
Agency owners need real-time visibility.
-
Recruiters want clear targets and instant progress updates.
A Power BI dashboard turns complicated hiring data into easy visuals that support better planning.
Key Features of the Recruitment Agencies Dashboard in Power BI
This dashboard comes with five powerful pages inside the Power BI file. Each page focuses on a specific part of agency operations.
Below is the enhanced and expanded version of your already written content, rewritten for clarity and quality.
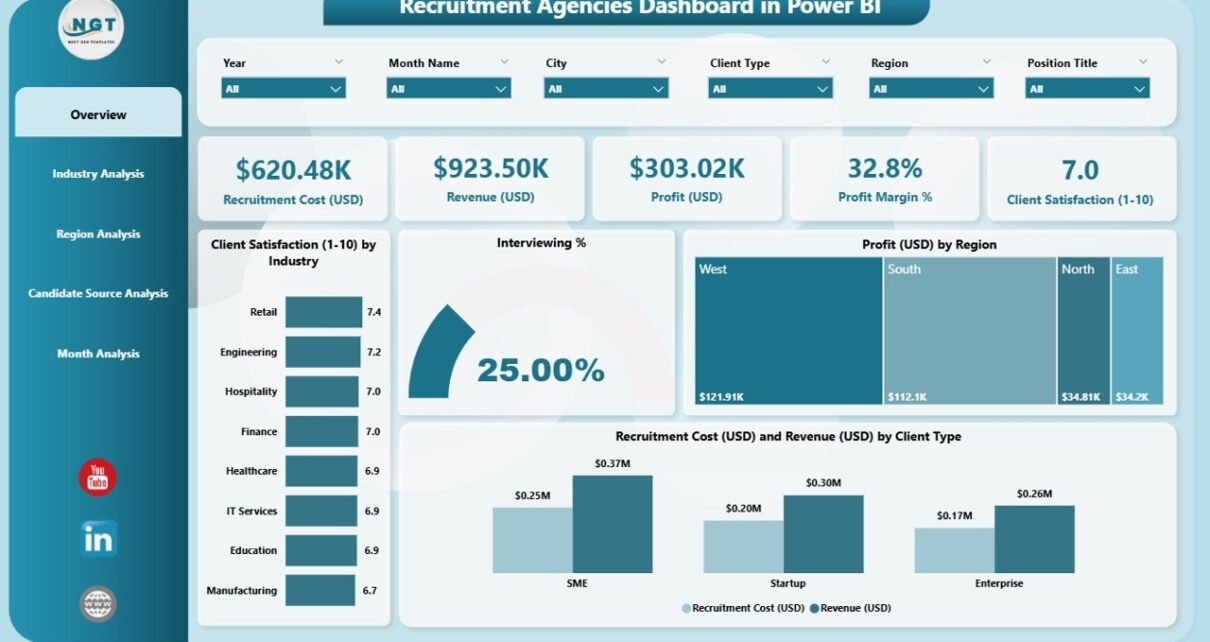
1. Overview Page
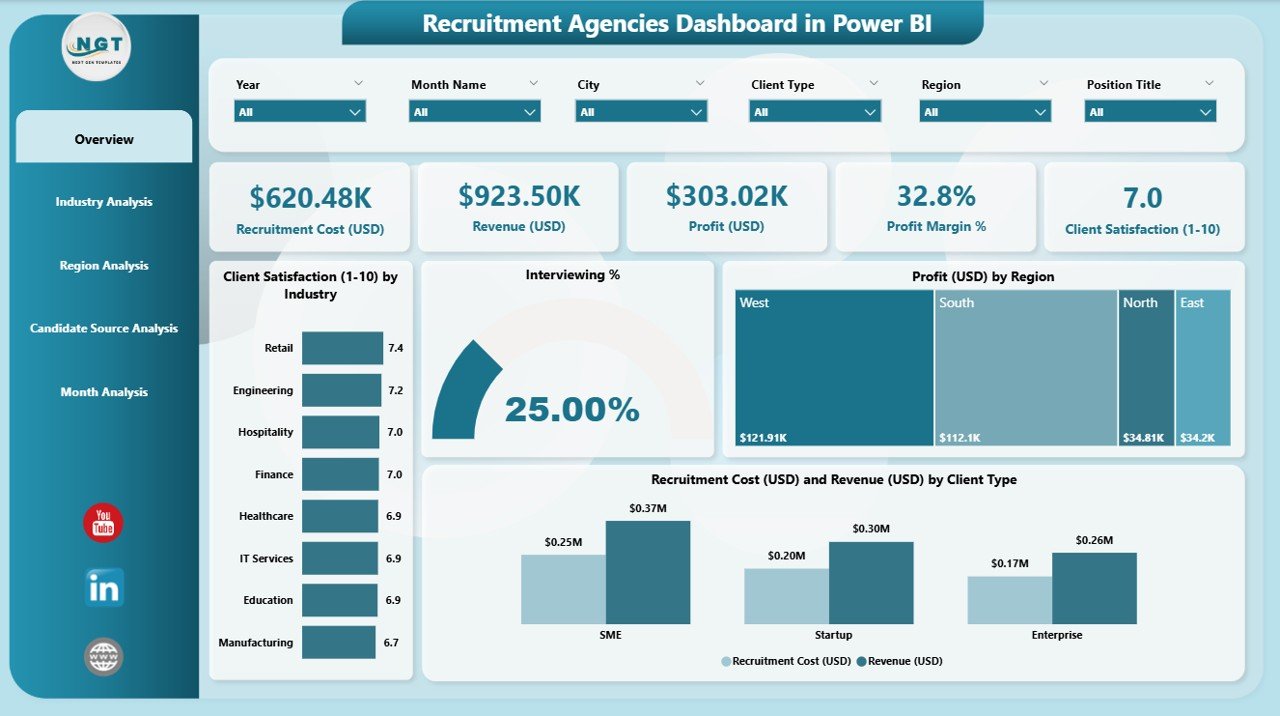
The Overview Page is the main control center of the dashboard. Users get a complete snapshot of agency performance in one place.
This page includes:
**✔ Interactive Slicers
✔ Four KPI Cards
✔ Four Key Charts**
Slicers
You can change the view using filters such as:
-
Month
-
Industry
-
Region
-
Client Type
These slicers help you analyze data from different angles.
KPI Cards
The Overview page shows four important cards:
-
Total Clients Covered
-
Interviewing %
-
Total Profit (USD)
-
Total Recruitment Cost (USD)
Charts
This page includes four critical charts:
-
Client Satisfaction by Industry
-
Interviewing %
-
Profit (USD) by Region
-
Recruitment Cost and Revenue by Client Type
The Overview Page makes it easy to understand agency growth, productivity, and financial status.
Click to Purchases Recruitment Agencies Dashboard in Power BI
2. Industry Analysis Page
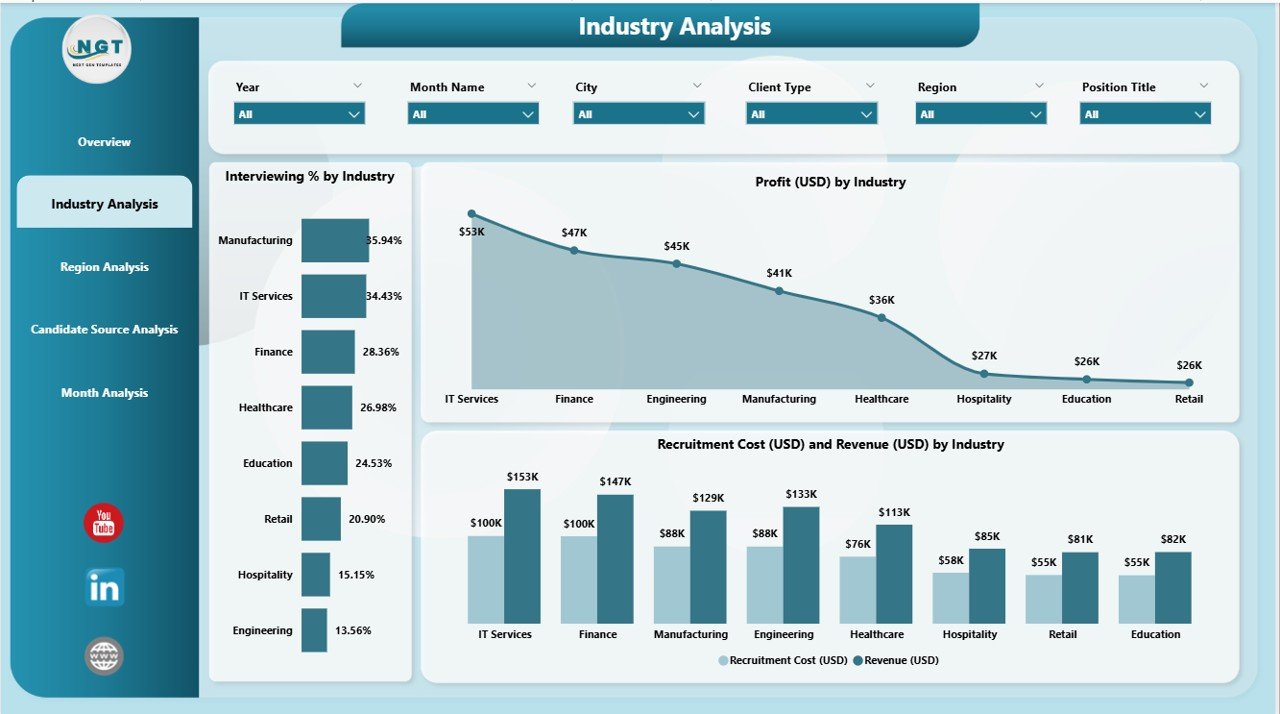
The Industry Analysis Page allows users to see how each industry performs. Since recruitment agencies often work with multiple industries, this page helps compare performance in a simple way.
The page includes:
✔ Three Detailed Charts
-
Interviewing % by Industry
-
Profit (USD) by Industry
-
Recruitment Cost and Revenue by Industry
You can compare:
-
Which industries generate the most profit
-
Which sectors deliver higher satisfaction
-
Where the recruitment cost is high
-
Which industry requires more effort and time
This page helps agency leaders allocate resources wisely.
3. Region Analysis Page
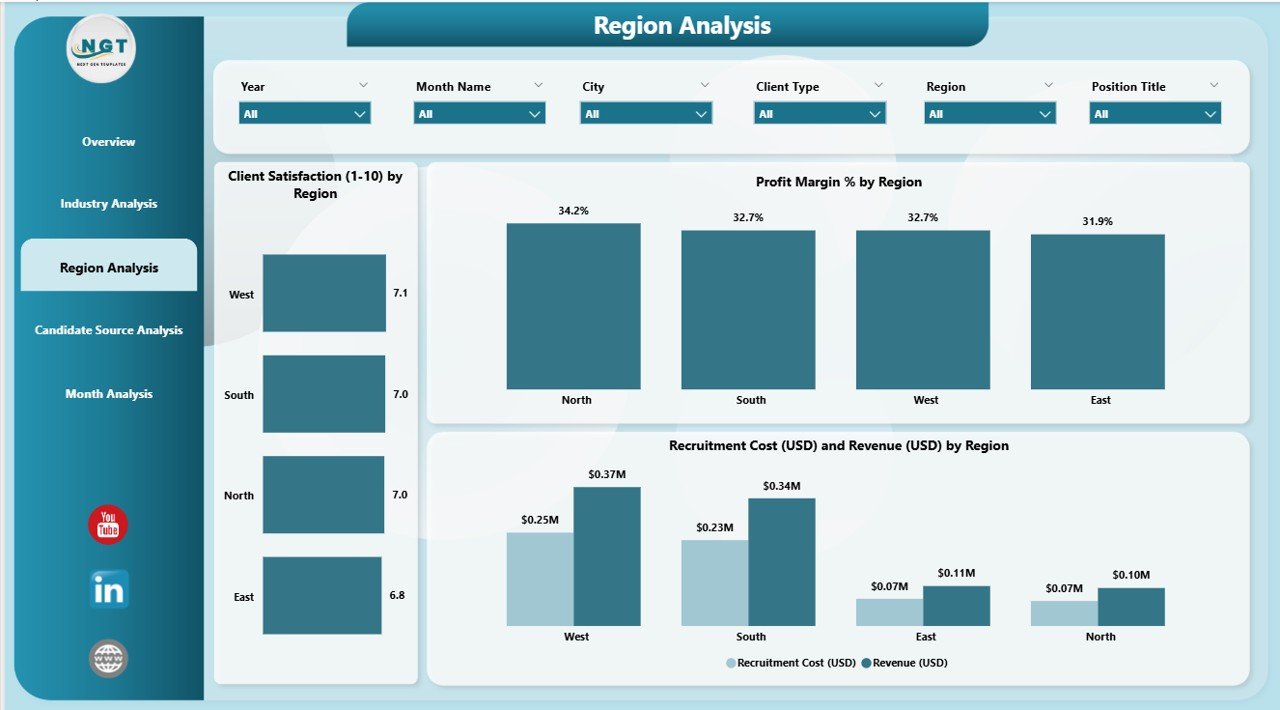
Recruitment performance often varies by region because of:
-
Talent availability
-
Economic trends
-
Competition
-
Client behavior
The Region Analysis Page highlights these differences.
Charts Included:
-
Client Satisfaction by Region
-
Profit (USD) by Region
-
Recruitment Cost and Revenue by Region
Recruitment agencies can use this page to:
-
Identify strong and weak regions
-
Improve client engagement
-
Adjust pricing or cost structures
-
Plan regional hiring strategies
4. Candidate Source Analysis Page
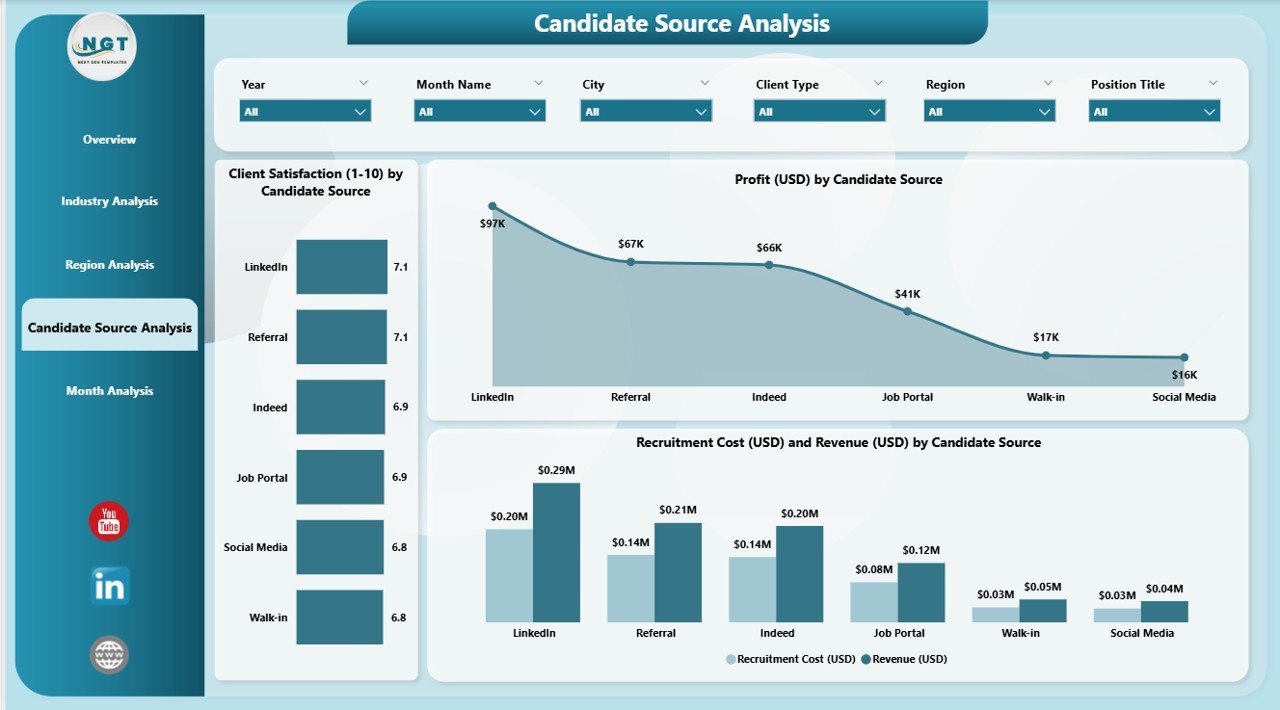
Every recruitment agency uses multiple channels to find candidates:
-
Job portals
-
LinkedIn
-
Employee referrals
-
Social media
-
Recruitment campaigns
-
Walk-ins
Some sources work better than others. This dashboard page shows exactly that.
Charts Included:
-
Client Satisfaction by Candidate Source
-
Profit (USD) by Candidate Source
-
Recruitment Cost and Revenue by Candidate Source
This analysis helps agencies:
-
Identify top-performing sources
-
Reduce spending on low-quality sources
-
Improve candidate quality
-
Increase hiring success rates
5. Monthly Trends Page
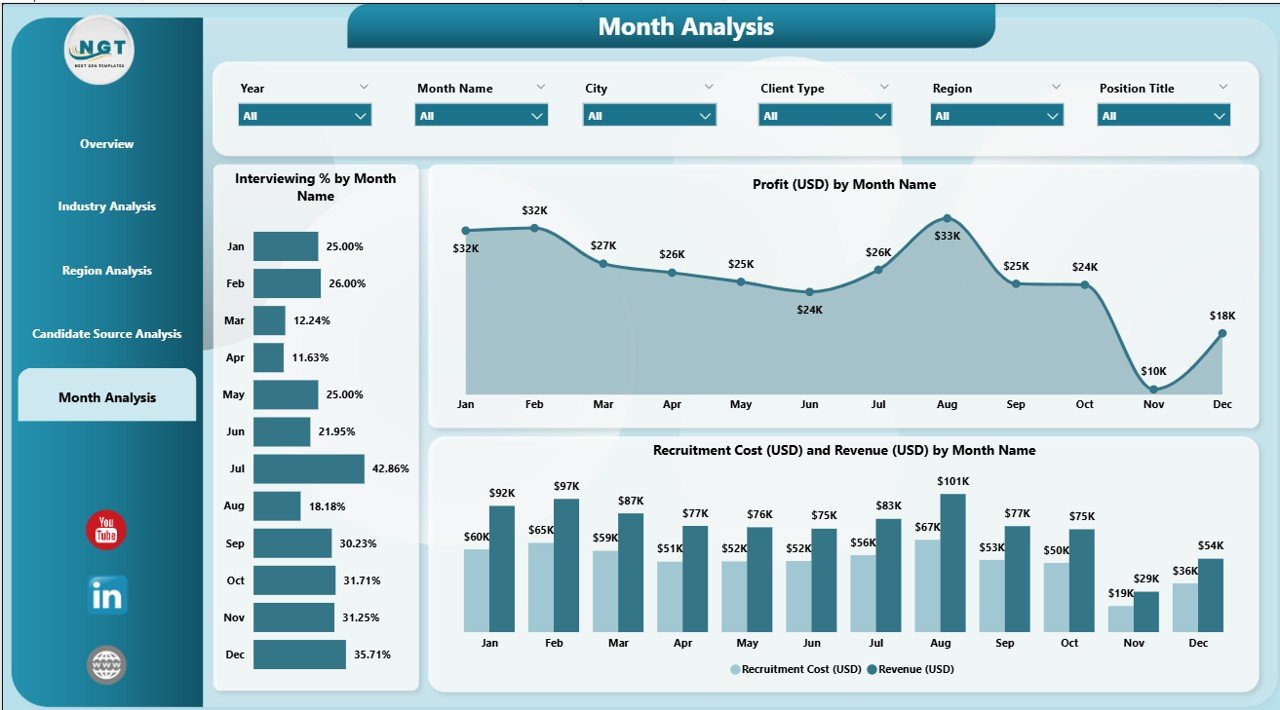
Recruitment performance changes with time because:
-
Hiring cycles vary by month
-
Companies plan budgets quarterly
-
Seasonal hiring impacts some industries
The Monthly Trends Page helps track agency growth throughout the year.
Charts Included:
-
Interviewing % by Month
-
Profit (USD) by Month
-
Recruitment Cost and Revenue by Month
This page helps leaders predict future hiring trends and set better targets.
Advantages of a Recruitment Agencies Dashboard in Power BI
Below are powerful reasons why recruitment agencies benefit from this dashboard:
1. Instant Access to Hiring Insights
Teams see live performance without opening multiple files.
2. Better Client Management
Client satisfaction charts help agencies improve service quality.
3. Cost and Revenue Transparency
Recruiters understand where money comes from and where it goes.
4. Better Candidate Source Planning
Agencies invest in only the best-performing candidate channels.
5. Improved Profitability
Leaders make decisions that increase profit and reduce hiring cost.
6. Clear Monthly Performance Tracking
Monthly trend charts help with forecasting and budgeting.
7. Smart Resource Allocation
Data highlights where recruiters should focus their efforts.
8. 360-Degree View of Recruitment
All important data appears in one place for complete clarity.
How Recruitment Agencies Can Use This Dashboard Effectively
Click to Purchases Recruitment Agencies Dashboard in Power BI
Agencies can take maximum benefit when they follow a structured approach.
1. Monitor Weekly and Monthly Progress
The dashboard makes it easy to track KPIs in real time.
2. Compare Industries and Regions
Teams identify the strongest sectors and adjust strategies.
3. Improve Client Satisfaction
Feedback patterns help agencies deliver better service.
4. Enhance Recruiter Performance
Managers track interviewing %, hiring speed, and candidate quality.
5. Control Hiring Cost
Cost-related visuals guide agencies to maintain better budgets.
6. Improve Lead Conversion
Sales teams use insights to close more clients.
7. Improve Decision Making
Leaders take data-driven decisions instead of guesswork.
Best Practices for Using a Recruitment Agencies Dashboard in Power BI
Follow these practices to get the best results:
1. Update Data Regularly
Refresh the dashboard daily or weekly for accurate insights.
2. Use Slicers for Deep Analysis
Analyze data by month, region, source, or client type.
3. Standardize KPI Definitions
Ensure all recruiters use the same meaning for each KPI.
4. Track Trends Instead of Single Values
Trend lines show real performance changes.
5. Share Reports with Teams
Use Power BI Service to share the dashboard with decision-makers.
6. Use Alerts
Set alerts for low client satisfaction or high cost.
7. Keep the Data Clean
Remove duplicates and incorrect entries before refreshing.
Important KPIs Every Recruitment Agency Should Track
Below are essential KPIs for recruitment agencies:
-
Interviewing percentage
-
Client satisfaction score
-
Recruitment cost
-
Revenue by industry
-
Profit by region
-
Candidate source performance
-
Time to hire
-
Offer acceptance rate
-
Monthly profit trend
-
Hiring pipeline conversion rate
Tracking these KPIs helps agencies improve performance and customer experience.
How Power BI Improves Recruitment Agency Operations
Power BI supports recruitment agencies by offering:
✔ Data integration from multiple sources
✔ Easy-to-read visuals
✔ Real-time decision support
✔ Secure sharing options
✔ Automatic updates
It reduces manual work and gives agencies accurate performance insights.
Conclusion
A Recruitment Agencies Dashboard in Power BI helps agencies streamline operations, understand performance, and improve decision-making. It provides important insights on interviewing %, client satisfaction, industry performance, regional growth, monthly trends, and candidate sources. Agencies use these insights to reduce cost, improve profit, increase client trust, and deliver better recruitment services.
In today’s competitive hiring world, every recruitment agency should use a Power BI dashboard to stay ahead.
Frequently Asked Questions (FAQs)
1. What is a Recruitment Agencies Dashboard in Power BI?
It is a visual reporting tool that shows recruitment KPIs like interviewing %, profit, client satisfaction, and monthly performance.
2. Who can use this dashboard?
Recruiters, agency owners, HR leaders, managers, and business development teams can use this dashboard.
3. What data do I need to create this dashboard?
You need data like candidate details, interview results, industry information, region, cost, revenue, and client satisfaction.
4. Can I customize this dashboard?
Yes, Power BI allows complete customization based on your agency workflows.
5. Why is client satisfaction important?
Client satisfaction helps agencies build trust, get repeat business, and grow faster.
6. How often should I update the dashboard?
You should update it daily or weekly depending on your recruitment volume.
7. Can this dashboard reduce hiring costs?
Yes, cost visuals help agencies analyze spending and reduce unnecessary expenses.
8. What are the most important KPIs to track?
Interviewing %, profit, revenue, satisfaction levels, and source performance are the top KPIs.
9. Can beginners use this dashboard?
Yes, the interface is easy to understand and suitable for beginners.
10. Why should agencies use Power BI instead of Excel?
Power BI offers better visuals, automation, interactivity, and real-time insights.
Visit our YouTube channel to learn step-by-step video tutorials
Click to Purchases Recruitment Agencies Dashboard in Power BI